. 2017 Jul;27(7):1273-1285.
doi: 10.1101/gr.213694.116. Epub 2017 Apr 5.

The developmental proteome of Drosophila melanogaster

Affiliations

The developmental proteome of Drosophila melanogaster

Nuria Casas-Vila et al. Genome Res. 2017 Jul.

Abstract

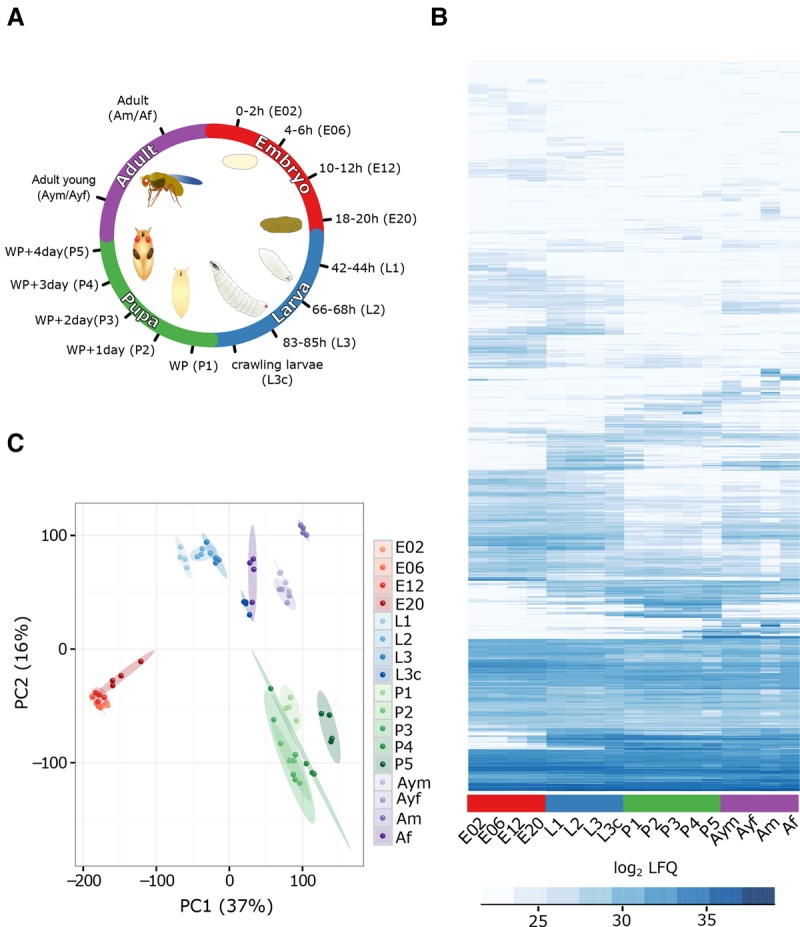
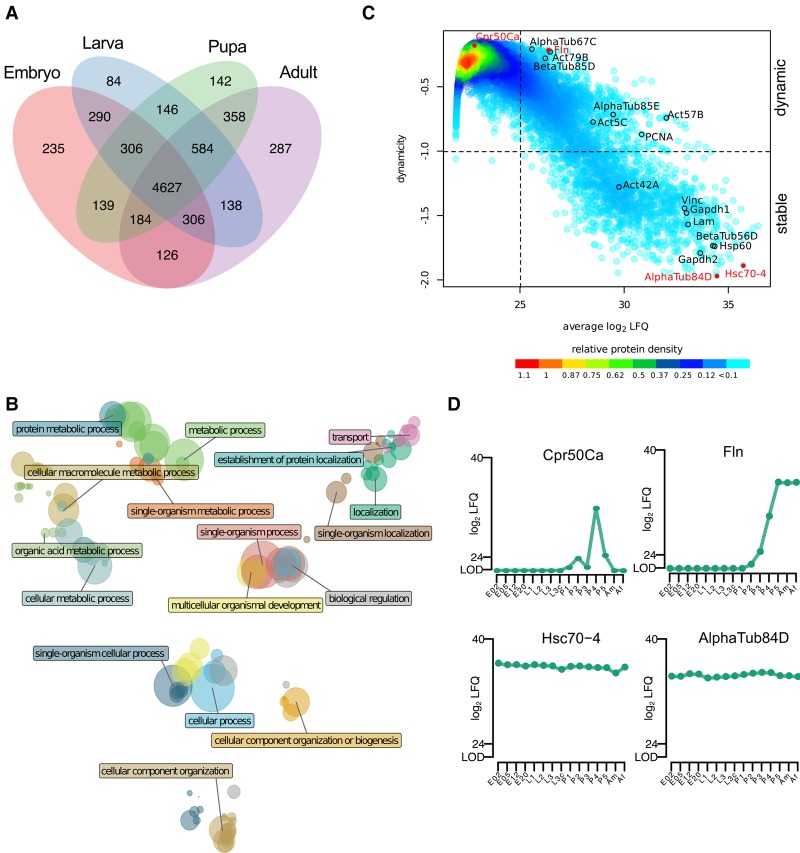
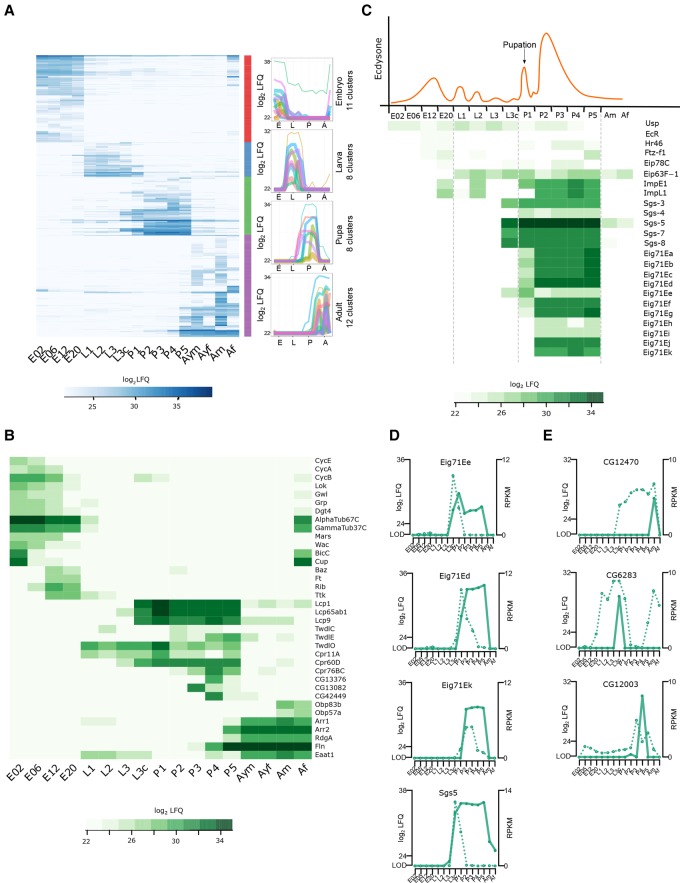
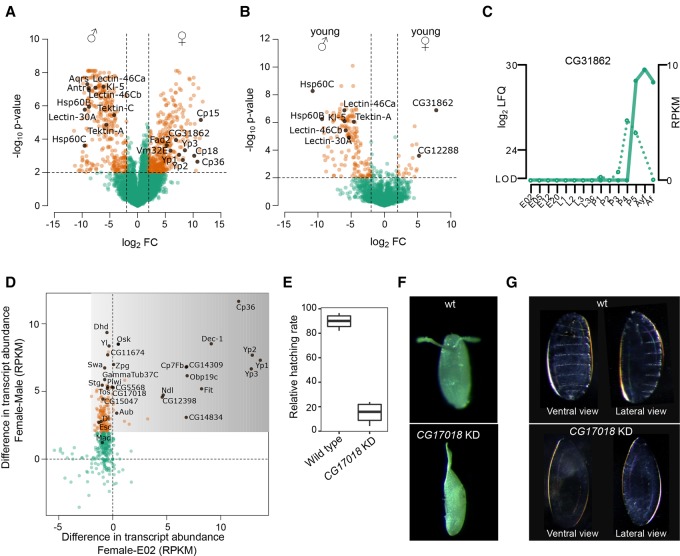
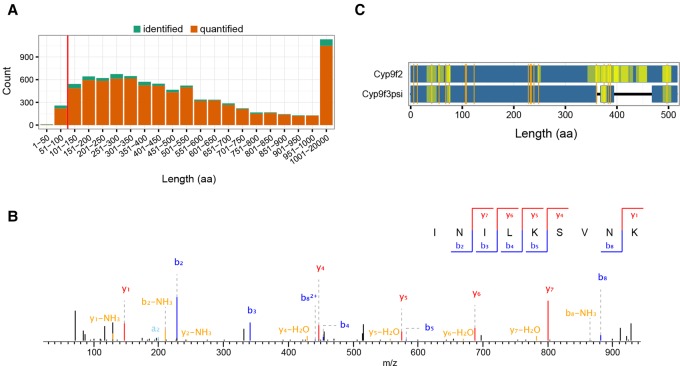
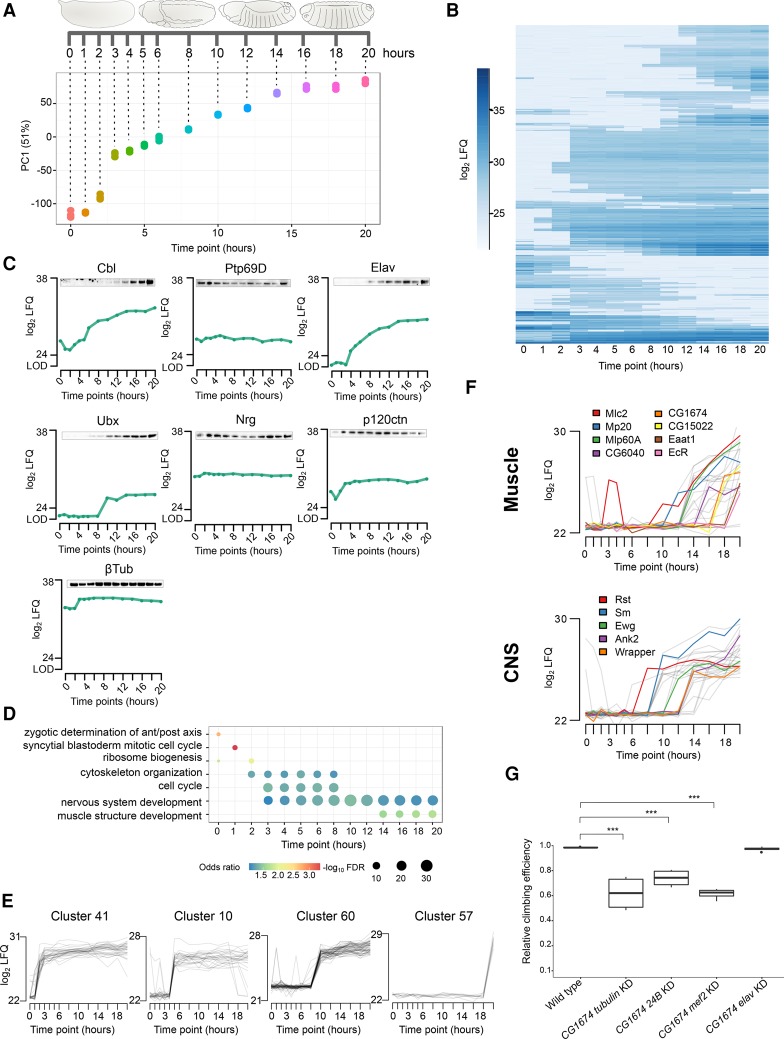
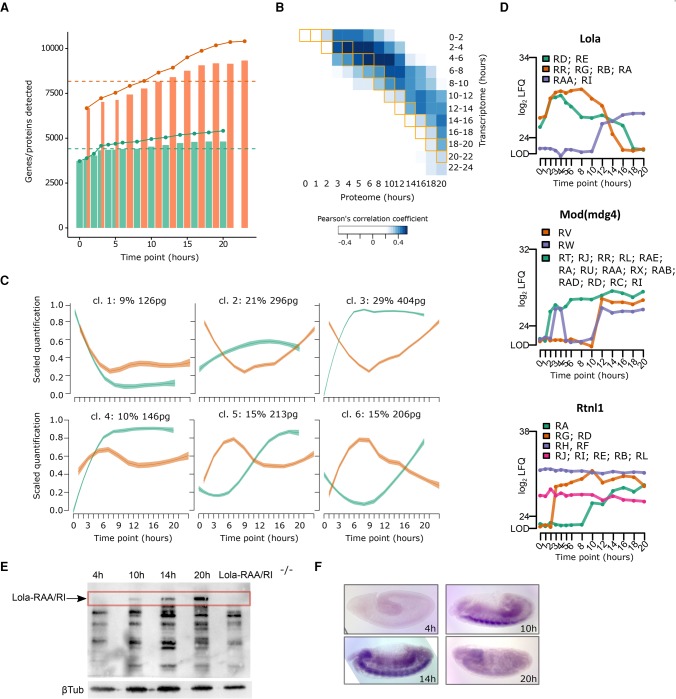
Drosophila melanogaster is a widely used genetic model organism in developmental biology. While this model organism has been intensively studied at the RNA level, a comprehensive proteomic study covering the complete life cycle is still missing. Here, we apply label-free quantitative proteomics to explore proteome remodeling across Drosophila's life cycle, resulting in 7952 proteins, and provide a high temporal-resolved embryogenesis proteome of 5458 proteins. Our proteome data enabled us to monitor isoform-specific expression of 34 genes during development, to identify the pseudogene Cyp9f3Ψ as a protein-coding gene, and to obtain evidence of 268 small proteins. Moreover, the comparison with available transcriptomic data uncovered examples of poor correlation between mRNA and protein, underscoring the importance of proteomics to study developmental progression. Data integration of our embryogenesis proteome with tissue-specific data revealed spatial and temporal information for further functional studies of yet uncharacterized proteins. Overall, our high resolution proteomes provide a powerful resource and can be explored in detail in our interactive web interface.


Figures

Figure 1.
Figure 1.
Drosophila developmental life cycle proteome. (A) Scheme depicting the collected time points throughout the four major metamorphic stages of Drosophila (embryo [red], larva [blue], pupa [green], and adult [violet]). (WP) White pupa, (L3c) crawling third instar larva. (B) Heat map of log2 LFQ values of the 7952 protein groups quantified during fly development. (C) Visualization of the first two principal components separating samples according to their developmental stage. The biological replicates are indicated in the same color, with elliptic areas representing the standard error of the two depicted components.
Figure 2.
Figure 2.
Characteristics of the developmental proteome. (A) Overlap of quantified protein groups between developmental stages results in a core proteome of 4627 proteins. (B) Clusters of enriched GO terms obtained from the core proteome are plotted in a coordinate system defined by the first two dimensions of a multidimensional scaling according to their similarity scores. The color of the circle represents the GO cluster with a representative term highlighted. The diameter of the circle is proportional to the size of the GO category. (C) The density plot relates protein abundance with a dynamicity score during developmental protein expression (log10 transformed Gini index). In the lower-right quadrant, highly stable proteins are represented, while the upper-right quadrant contains proteins with changing expression levels during development. (D) Expression profiles for two highly dynamic (upper panel) and two stably expressed (lower panel) proteins highlighted in red in the dynamicity plot.
Figure 3.
Figure 3.
Stage-specific proteins and ecdysone-induced developmental regulation. (A) Heat map showing 1535 protein groups found to be differentially (ANOVA, FDR < 0.01) regulated during the life cycle. These protein groups were clustered into up to 12 stage-specific profiles. Average profiles of the individual clusters for each developmental stage are shown. (B) Heat map showing log2 LFQ abundance of proteins with stage-specific expression profiles discussed in the text. (C) Schematic representation of ecdysone pulses during fly development (upper panel) and heat map of log2 LFQ expression levels of selected proteins of 20-hydroxyecdysone regulated genes (lower panel). (D) For the Eig71E and Sgs gene family, RNA expression profiles (dotted line) differ from protein levels (solid line) during the pupal phase, demonstrating prolonged protein stability. (E) Three examples showing single protein expression burst, but more broadly detectable RNA indicating more tightly controlled protein expression.
Figure 4.
Figure 4.
Sex-specific proteome and maternally loaded proteins. (A) Volcano plot comparing protein expression levels between 1-wk-old male and female flies. Candidates discussed in the text are highlighted (filled black circles). Dashed lines indicate a fourfold expression difference with P < 0.01. (B) Volcano plot comparing protein expression levels between young male and female flies (<4 h old after eclosure) shows very few female-specific proteins. Candidates discussed in the text are highlighted (filled black circles). Dashed lines indicate a fourfold expression difference with P < 0.01. (C) Developmental expression profile of the female-specific protein CG31862 shows detection of mRNA (dotted line) in late pupal stage, while the protein (solid line) is also found in female flies. (D) Integration of mRNA levels with embryo-specific proteins allows identifying maternally loaded proteins. The mRNA levels of the adult female flies compared to embryos (x-axis) and males (y-axis) distinguishes cases in which either both the mRNA and protein (x = 0, y > 2), or only the protein (darker shaded area) is maternally loaded. (E) Relative embryonic hatching rate (four biological replicates) of CG17018 knockdown embryos compared to wild type. (F) Image of representative wild type and the CG17018 knockdown embryo with fused dorsal appendages. (G) Cuticle preparation of embryos revealed absence of denticle belts patterning in the CG17018 knockdown line.
Figure 5.
Figure 5.
Small proteins and peptides from noncoding regions of the genome. (A) Protein length distribution of identified (green, not enough quantitation values) and quantified (orange) protein groups of the life cycle proteome. Most proteins have quantitation values (>90%), and this fraction only marginally depends on protein length. The red line demarcates the fraction of 268 small proteins (<100 aa). (B) Representative MS/MS spectrum with annotated b- and y-ions of the peptide INILKSVNK(2+) from the putative noncoding gene CR43476. (C) Sequence comparison of Cyp9f2 and the “pseudogene” product Cyp9f3Ψ with amino acid substitution between both proteins marked in orange. Coverage of peptides for either protein is shown (yellow, more intense regions have overlapping peptides).
Figure 6.
Figure 6.
The embryogenesis proteome time course. (A) Scheme indicating the collected time points. PCA shows high reproducibility of replicates, and the first component shows high correlation with developmental progression (R = 0.93). (B) Heat map of log2 LFQ expression values for 1644 developmentally regulated protein groups in embryogenesis. (C) Western blots of seven selected proteins validate their temporal expression profile from the proteomics screen. (D) Dot plot connecting the selected enriched GO terms with developmental progression. The circle size indicates the odds ratio of each GO term category. (E) The regulated protein groups were assigned automatically to 70 clusters based on expression profiles, of which four representative clusters with an up-regulation at 2–3 h (cluster 41), 5 h (cluster 10), 10 h (cluster 60), and 20 h (cluster 57) are shown. (F) Profiles of tissue-specific protein expression created by integrating RNA fluorescence in situ hybridization data. Muscle and central nervous system (CNS) clusters were chosen as examples. (G) Ubiquitous (tubulin-GAL4) and mesodermal (24B- and mef2-GAL4) but not neuronal (elav-GAL4) knockdown of CG1674 results in reduced locomotion activity (Dunnett's test; [***] P-value < 0.001).
Figure 7.
Figure 7.
Temporal transcriptome/proteome dynamics and isoform quantitation. (A) Plot showing the number (bars) of detected transcripts (orange) and proteins (green) at each time point. The solid line depicts the cumulative sum of unique transcripts (orange) and proteins (green). The dashed line represents the median across all time points. (B) Heat map displaying the Pearson correlation between transcript and protein expression levels. Matching time points between the two data sets are indicated by orange boxes. (C) Median scaled quantification plotted after clustering of the first PCA component of RNA (orange) and protein (green) expression into six different categories. Shaded regions display the standard error of the fitted line. (D) Expression profiles with isoform-specific information of three proteins: Lola, Mod(mdg4), and Rtnl1. Isoforms are colored according to the legend. (E) Validation of Lola-RAA/Lola-RI isoform quantitation by immunoblotting against Lola at four selected time points. Protein lysate of lola-RAA/lola-RI mutant embryos at 20 h were used to identify the isoform-specific band (arrow) corresponding to Lola-RAA/Lola-RI. Beta-tubulin was used as a loading control. (F) RNA levels were determined by in situ hybridization at the selected time points with a specific probe for lola-RAA/lola-RI.

References

    1. Adams MD, Celniker SE, Holt RA, Evans CA, Gocayne JD, Amanatides PG, Scherer SE, Li PW, Hoskins RA, Galle RF, et al. 2000. The genome sequence of Drosophila melanogaster. Science 287: 2185–2195. - PubMed
    1. Amos LA. 2008. The tektin family of microtubule-stabilizing proteins. Genome Biol 9: 229. - PMC - PubMed
    1. Aspden JL, Eyre-Walker YC, Phillips RJ, Amin U, Mumtaz MAS, Brocard M, Couso J-P. 2014. Extensive translation of small Open Reading Frames revealed by Poly-Ribo-Seq. eLife 3: e03528. - PMC - PubMed
    1. Beckstead RB, Lam G, Thummel CS. 2005. The genomic response to 20-hydroxyecdysone at the onset of Drosophila metamorphosis. Genome Biol 6: R99. - PMC - PubMed
    1. Bonaldi T, Straub T, Cox J, Kumar C, Becker PB, Mann M. 2008. Combined use of RNAi and quantitative proteomics to study gene function in Drosophila. Mol Cell 31: 762–772. - PubMed

Publication types

MeSH terms