. 2017 May 15;198(10):3978-3988.
doi: 10.4049/jimmunol.1602054. Epub 2017 Apr 5.

Early B Cell Progenitors Deficient for GON4L Fail To Differentiate Due to a Block in Mitotic Cell Division

Affiliations

Early B Cell Progenitors Deficient for GON4L Fail To Differentiate Due to a Block in Mitotic Cell Division

Jennifer Y Barr et al. J Immunol. .

Abstract

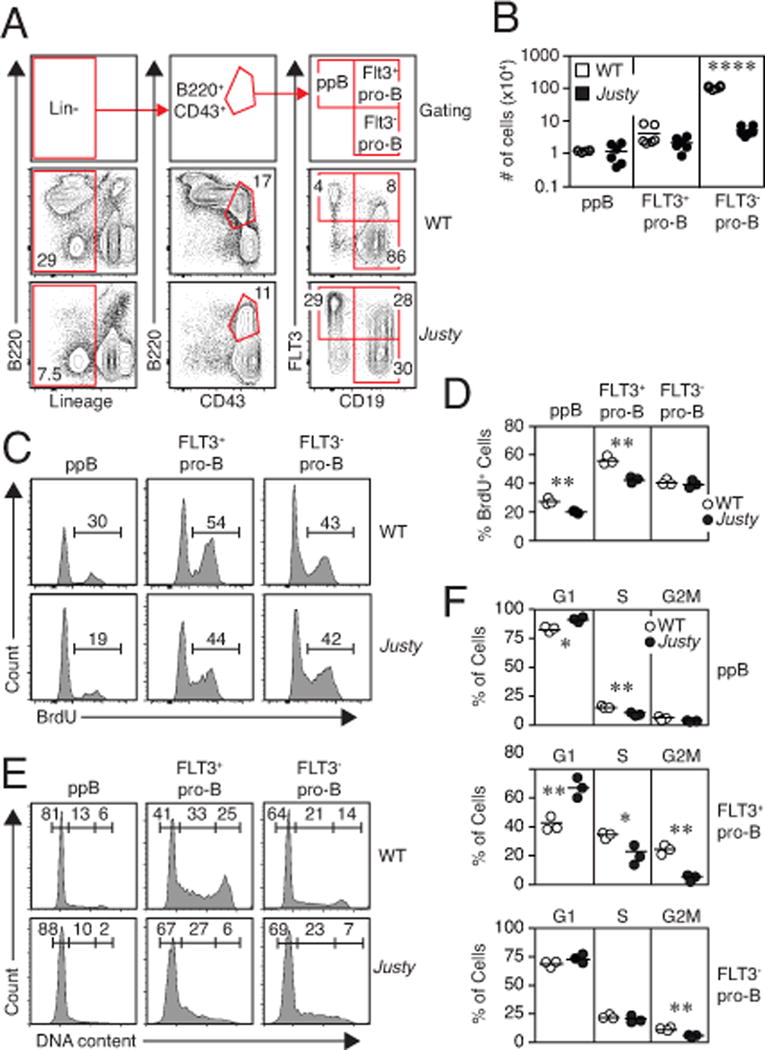
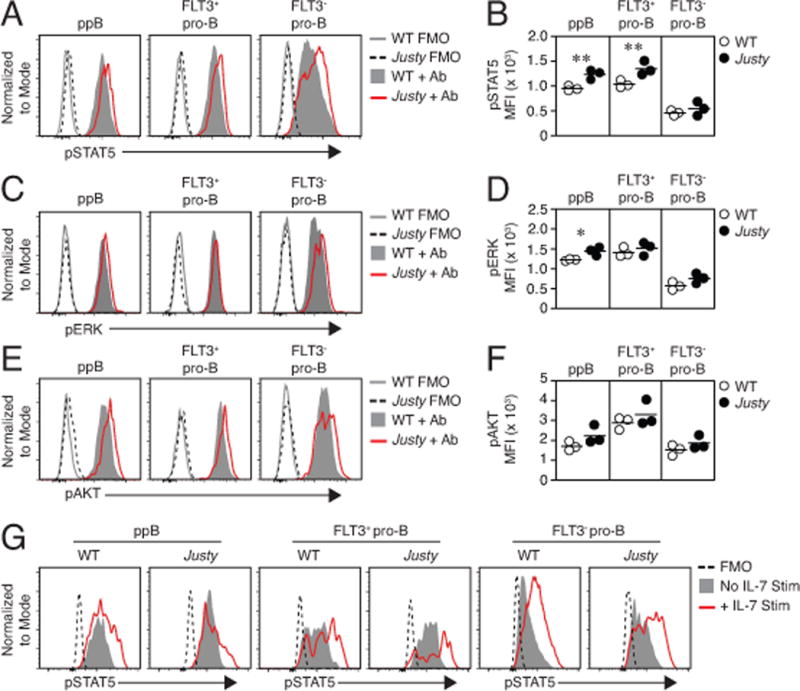
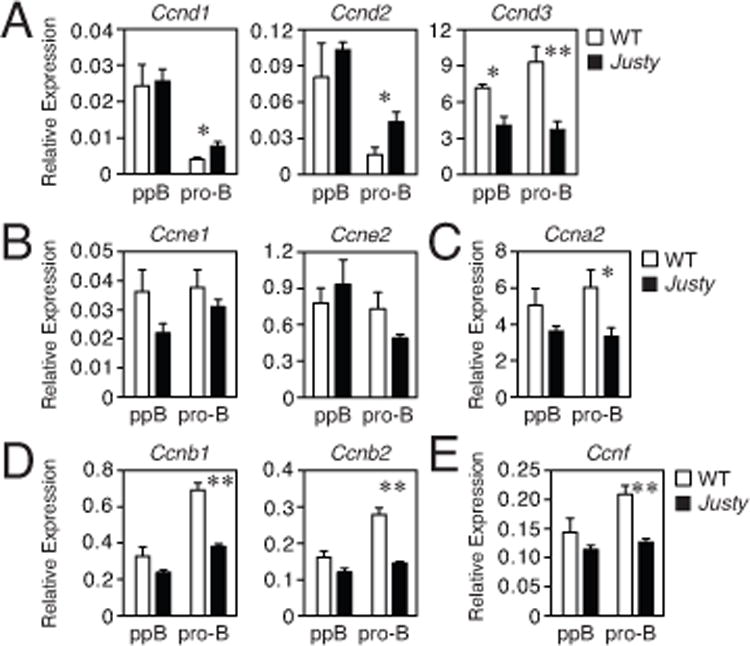
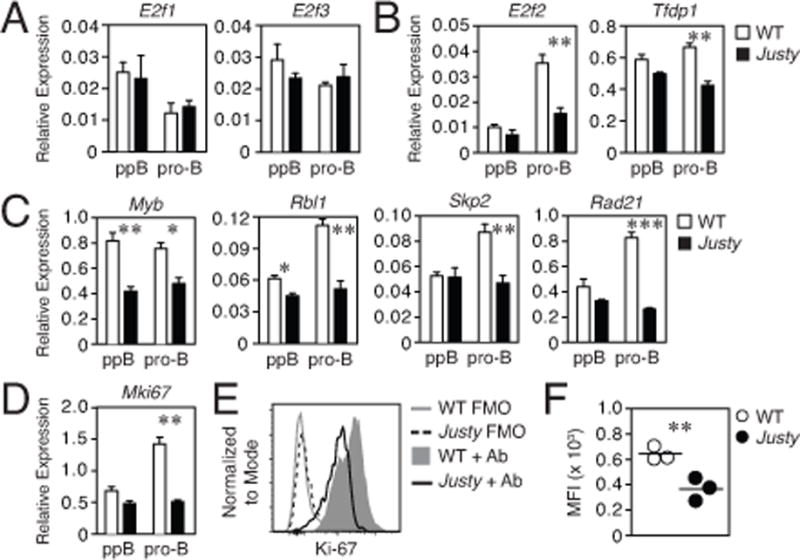
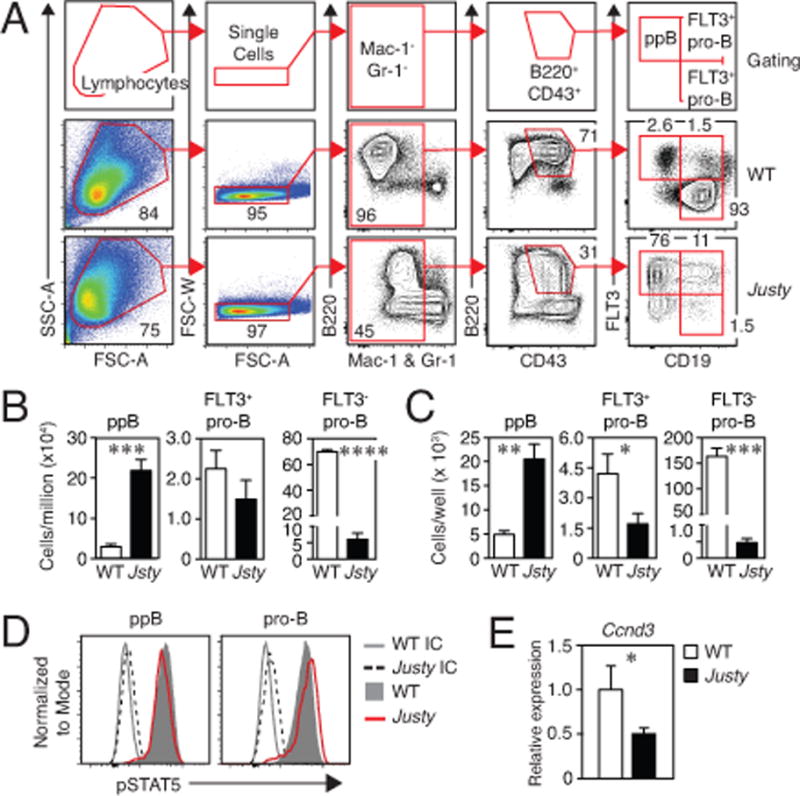
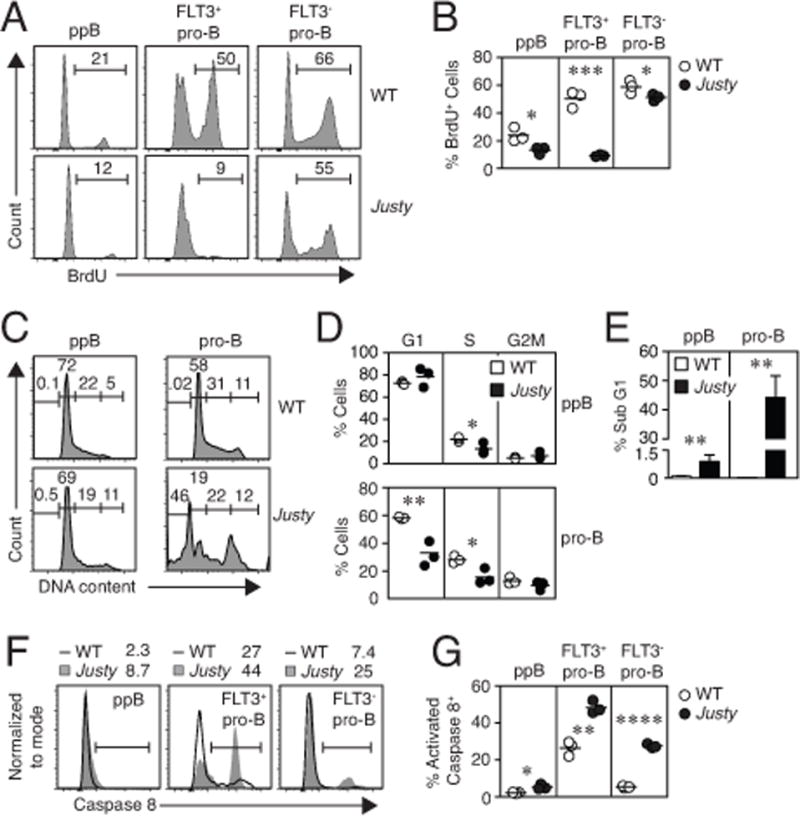
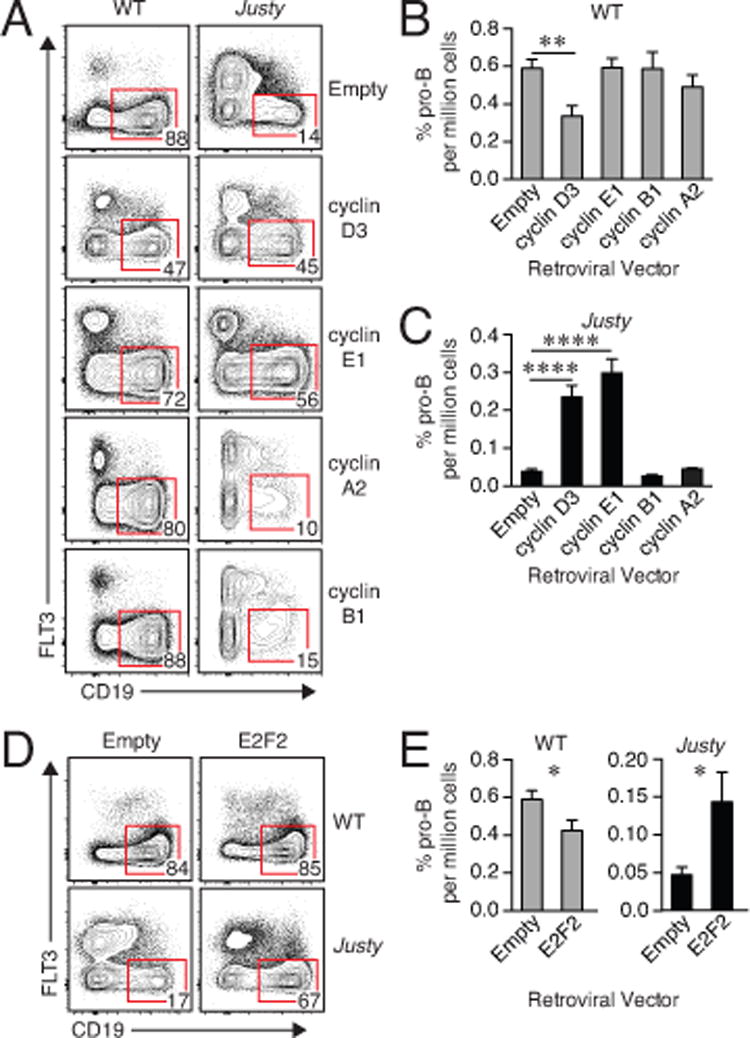
B cell development in Justy mutant mice is blocked due to a precursor mRNA splicing defect that depletes the protein GON4-like (GON4L) in B cell progenitors. Genetic and biochemical studies have suggested that GON4L is a transcriptional regulator that coordinates cell division with differentiation, but its role in B cell development is unknown. To understand the function of GON4L, we characterized B cell differentiation, cell cycle control, and mitotic gene expression in GON4L-deficient B cell progenitors from Justy mice. We found that these cells established key aspects of the transcription factor network that guides B cell development and proliferation and rearranged the IgH gene locus. However, despite intact IL-7 signaling, GON4L-deficient pro-B cell stage precursors failed to undergo a characteristic IL-7-dependent proliferative burst. These cells also failed to upregulate genes required for mitotic division, including those encoding the G1/S cyclin D3 and E2F transcription factors and their targets. Additionally, GON4L-deficient B cell progenitors displayed defects in DNA synthesis and passage through the G1/S transition, contained fragmented DNA, and underwent apoptosis. These phenotypes were not suppressed by transgenic expression of prosurvival factors. However, transgenic expression of cyclin D3 or other regulators of the G1/S transition restored pro-B cell development from Justy progenitor cells, suggesting that GON4L acts at the beginning of the cell cycle. Together, our findings indicate that GON4L is essential for cell cycle progression and division during the early stages of B cell development.


Figures

Figure 1
Figure 1. Justy B cell progenitors display impaired DNA synthesis and alterations in cell cycle distribution
(A) Analysis of early B cell progenitors in bone marrow. Lineage-marker negative, B220+CD43+ cells were subdivided into pre-pro-B (ppB) cells, FLT3+ pro-B cells and FLT3 pro-B cells based on CD19 and FLT3 expression as shown at the top of the panel. (B) Yields of the indicated B cell progenitors from WT and Justy bone marrow. Circles represent values from 6 independent experiments in which a WT and a Justy mouse were analyzed; lines represent mean values. (C) DNA synthesis by WT and Justy B cell progenitors as measured by BrdU incorporation. Mice were injected with BrdU and bone marrow harvested 6 hours later for analysis. Cells were identified as represented in panel A. The percentages of BrdU+ cells are shown. (D) Frequencies of BrdU+ cells within the indicated cell populations. (E) DNA profiles for the indicated cell populations. The percentages of cells in the G0/G1, S or G2M phases of the cell cycle are shown. (F) Frequencies of cells in the indicated stages of the cell cycle as determined from DNA content profiles. For panel D and F, circles represent values from 3 independent experiments in which a WT and a Justy mouse were analyzed; lines represent mean values. * P < .05; ** P < .01; **** P < .0001.
Figure 2
Figure 2. The IL-7 signaling pathway functions normally in Justy mutant B cell progenitors
Bone marrow cells were stained for surface markers and analyzed as shown in Figure 1A to identify pre-pro-B (ppB) cells, FLT3+ pro-B cells and FLT3 pro-B cells. Cells were also stained and analyzed for intracellular levels of phosphorylated STAT5 (pSTAT5; panels A and B), phosphorylated ERK (pERK; panels C and D) and phosphorylated AKT (pAKT; panels E and F). (G) Bone marrow cells were stained for surface markers, rested on ice and then incubated at 37°C in the absence or presence of IL-7. Intracellular levels of pSTAT5 in Flt3 pro-B cells were then analyzed. Histograms in panels A, C, E and G represent data obtained from at least 3 independent experiments. Circles in bar graphs (panels B, D and F) each represent median fluorescence intensity (MFI) values obtained from 3 independent experiments. * P < .05; ** P < .01.
Figure 3
Figure 3. Justy B cell progenitors display decreased expression of cyclin genes
(AE) Quantitative RT-PCR analysis measuring the levels of RNAs encoded by the indicated genes. RNA was isolated from sort-purified pre-pro-B (ppB) and pro-B cells. Values are relative to that for Hprt RNA, which was analyzed as an internal standard. Bars represent the mean and standard error of values from at least 3 independent experiments. * P < .05; ** P < .01.
Figure 4
Figure 4. Decreased expression of genes encoding E2F transcription factors and their target genes in Justy B cell progenitors
(AD) Quantitative RT-PCR analysis measuring the levels of RNAs encoded by the indicated genes. RNA was isolated from sort-purified pre-pro-B (ppB) and pro-B cells, which were isolated as shown in supplemental figure 2. Values are relative to that for Hprt RNA, which was analyzed as an internal standard. Bars represent the mean and standard error of values from at least 3 independent experiments. (E) Analysis of Ki-67 protein expression in pro-B cells (pool of FLT3+ and FLT3 cells). Pro-B cells were identified as shown in Figure 1A. FMO samples represent pro-B cells that were not stained with anti-Ki-67 antibody. Data shown are representative of results from 3 independent experiments. (F) Median fluorescence intensities (MFI) for Ki-67 staining. Circles represent values from 3 independent experiments in which a WT and a Justy mouse were analyzed; lines represent mean values. * P < .05; ** P < .01; *** P < .001.
Figure 5
Figure 5. The ability of Justy multipotent progenitors to generate pro-B cells in vitro is greatly impaired
(A) Analysis of B cell progenitors generated from WT and Justy MPPs after culturing for 7 days on OP9 stromal cells in the presence of IL-7, SCF, and FLT3L. Pre-pro-B (ppB) cells, FLT3+ pro-B cells, and FLT3 pro-B cells were identified as shown at the top of the panel. (B, C) Frequencies (B) and numbers (C) of the indicated of B cell progenitors generated in the cultures. (D) Analysis of phosphorylated STAT5 (pSTAT5) levels in pre-pro-B and pro-B cells (pool of FLT3+ and FLT3 cells). Data are representative of results from 3 independent experiments. (E) quantitative RT-PCR analysis of cyclin D3 RNA levels in sort-purified pro-B cells (pool of FLT3+ and FLT3 cells). For panels B, C, and E, bars represent the mean and standard error of values from at least 3 independent experiments. * P < .05; ** P < .01; *** P < .001; **** P < .0001.
Figure 6
Figure 6. Cultured Justy B cell progenitors show cell-cycle defects and increased levels of apoptosis
MPPs from WT and Justy mice were cultured for 7 days on OP9 stromal cells in the presence of IL-7, SCF and FLT3L. B cell progenitors were identified as shown in Figure 5A. (A) DNA synthesis by WT and Justy B cell progenitors as measured by BrdU incorporation. BrdU was added to cultures, which were harvested 2 hours later and stained for surface markers and BrdU. The percentages of BrdU+ cells are shown. (B) Frequencies of BrdU+ cells within the indicated cell populations. (C) DNA content profiles for the indicated cell populations. The percentages of cells in the G0/G1, S and G2M phases of the cell cycle or in the sub G1 fraction are shown. (D) Frequencies of cells in the indicated stages of the cell cycle as determined from DNA content profiles. (E) Frequencies of pre-pro-B and pro-B cells in the sub G1 fraction based on DNA content profiles. Bars represent the mean and standard error of values from 3 independent experiments. (F) Analysis of activated caspase 8 in the indicated cell populations. The frequencies of activated caspase 8+ cells are shown. (G) Frequencies of activated caspase 8+ cells in the indicated cell populations. For panel B, D and G, circles represent values from 3 independent experiments in which a WT and a Justy culture were analyzed; lines represent mean values. * P < .05; ** P < .01; *** P < .001; **** P < .0001.
Figure 7
Figure 7. Enforced expression of cyclin D3, cyclin E or E2F2 promotes pro-B cell development from Justy multipotent progenitors
MPPs from WT and Justy mice were transduced with a GFP-expressing control retrovirus lacking a cDNA insert (Empty) or that expressing both GFP and the indicated protein. Cells were cultured on OP9 stromal cells in the presence of IL-7, SCF, and FLT3L for 11 days and analyzed as shown in supplemental figure 3C. (A, D) Analysis of Gr-1Mac-1B220+CD43+ cells that were GFP+ following transduction with the indicated retroviral vectors. Gates in the flow plots identify pro-B cells; numbers represent the percentage of cells in the gates. Data are representative of results from at least 6 independent experiments. (B, C and E) Frequencies of GFP+ pro-B cells per million GFP+ cells generated by WT or Justy MPPs following transduction with the indicated retroviral vectors. Bars represent the mean and standard error of values from at least 6 independent experiments. * P < .05; ** P < .01; **** P < .0001.

Similar articles

Cited by

References

    1. Nutt SL, Kee BL. The transcriptional regulation of B cell lineage commitment. Immunity. 2007;26:715–725. - PubMed
    1. Mandel EM, Grosschedl R. Transcription control of early B cell differentiation. Curr Opin Immunol. 2010;22:161–167. - PubMed
    1. Clark MR, Mandal M, Ochiai K, Singh H. Orchestrating B cell lymphopoiesis through interplay of IL-7 receptor and pre-B cell receptor signalling. Nat Rev Immunol. 2014;14:69–80. - PMC - PubMed
    1. Reth M, Nielsen P. Signaling circuits in early B-cell development. Adv Immunol. 2014;122:129–175. - PubMed
    1. Bain G, Maandag EC, Izon DJ, Amsen D, Kruisbeek AM, Weintraub BC, Krop I, Schlissel MS, Feeney AJ, van Roon M, van der Valk M, Riele HPJ, Berns A, Murre C. E2A proteins are required for proper B cell development and initiation of immunoglobulin gene rearrangements. Cell. 1994;79:885–892. - PubMed

MeSH terms

LinkOut - more resources