. 2017 Mar 22:8:320.
doi: 10.3389/fimmu.2017.00320. eCollection 2017.

1810011o10 Rik Inhibits the Antitumor Effect of Intratumoral CD8+ T Cells through Suppression of Notch2 Pathway in a Murine Hepatocellular Carcinoma Model

Affiliations

1810011o10 Rik Inhibits the Antitumor Effect of Intratumoral CD8+ T Cells through Suppression of Notch2 Pathway in a Murine Hepatocellular Carcinoma Model

Kai Dai et al. Front Immunol. .

Abstract

The mechanisms by which tumor-responsive CD8+ T cells are regulated are important for understanding the tumor immunity and for developing new therapeutic strategies. In current study, we identified the expression of 1810011o10 Rik, which is the homolog of human thyroid cancer 1, in intratumoral activated CD8+ T cells in a murine hepatocellular carcinoma (HCC) implantation model. To investigate the role of 1810011o10 Rik in the regulation of antitumor activity of CD8+ T cells, normal CD8+ T cells were transduced with 1810011o10 Rik-expressing lentiviruses. Although 1810011o10 Rik overexpression did not influence agonistic antibody-induced CD8+ T cell activation in vitro, it inhibited the cytotoxic efficacy of CD8+ T cells on HCC cells in vivo. 1810011o10 Rik overexpression impeded CD8+ T cell-mediated HCC cell apoptosis and favored tumor cell growth in vivo. Further investigation revealed that 1810011o10 Rik blocked the nuclear translocation of Notch2 intracellular domain, which is crucial for CD8+ T cell activity. Furthermore, a brief in vitro experiment suggested that both antigen-presenting cells and TGF-β might be necessary for the upregulation of Rik expression in activated CD8+ T cells. In general, our study disclosed a novel mechanism underlying the negative regulation of antitumor CD8+ T cells during HCC progression.

Keywords: 1810011o10 Rik; CD8+ T cells; Notch2; hepatocellular carcinoma; immunity.


Figures

Figure 1
Figure 1
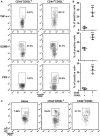
Intratumoral CD8+CD44+CD62L T cells express Rik. (A) Flow cytometry gating strategy of splenic and intratumoral CD4+ and CD8+ T cells. Total T cells were gated based on TCR staining and were subsequently discriminated by CD4 and CD8 staining. Numbers in the plots are proportions of gated cell populations. (B) Representative dot plots showing expression of CD44 and CD62L on splenic and intratumoral CD4+ and CD8+ T cells. Numbers in the plots are proportions of gated cell populations. (C) Rik mRNA level in splenic and intratumoral CD4+ and CD8+ T cells. N = 5 per group. (D) Rik protein expression in splenic and intratumoral CD4+ and CD8+ T cells. This is a representative image of two independent experiments. ***p < 0.001 compared with splenic CD4+CD44CD62L+ cells.
Figure 2
Figure 2
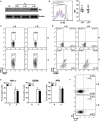
Cytotoxic activity of intratumoral CD8+CD44+CD62L and CD8+CD44CD62L+ T cells. (A,B) Expression of TNF-α, granzyme B, and perforin in intratumoral CD8+ T cell subpopulations was analyzed by intracellular staining. Representative dot plots were shown in panel (A), and statistical analysis was demonstrated in panel (B). N = 3 per group. (C) Hepa-1c1c7 cell apoptosis after 24-h coculture with intratumoral CD8+ T cell subpopulations. The whole cells were stained with APC anti-CD45 antibody and FITC Annexin V. Only CD45-negative tumor cells were shown in the dot plots. This is a representative image of three independent experiments. Numbers in the plots are proportions of gated cell populations. Alone: tumor cells cultured alone. CD44CD62L+: tumor cells cocultured with CD8+CD44CD62L+ T cells. CD44+CD62L: tumor cells cocultured with CD8+CD44+CD62L T cells. A-V, Annexin V (***p < 0.001).
Figure 3
Figure 3
Overexpression of Rik does not influence CD8+ T cell activation in vitro. (A) Expression of Rik after lentiviral transduction. N: naïve CD8+ T cells. A: agonistic antibody-stimulated CD8+ T cells. Ctrl: no transduction. L-S: transduction with lentiviruses containing scramble sequence. L-R: transduction with lentiviruses containing Rik sequence. This is a representative image of two independent experiments. (B) CFSE dilution in lentivirus-transduced CD8+ T cells. Left panel: representative histograms. Right panel: statistics of mean fluorescent intensity. (C,D) Intracellular staining of TNF-α (C), granzyme B and perforin (D) in lentivirus-transduced CD8+ T cells. Numbers in the plots are proportions of gated cell populations. N: naïve CD8+ T cells. A: agonistic antibody-stimulated CD8+ T cells. L-S: transduction with lentiviruses containing scramble sequence. L-R: transduction with lentiviruses containing Rik sequence. (E) Statistical analysis of the proportions of CD8+ T cells expressing TNF-α, granzyme B, and perforin. N = 5 per group. (F) CD8+ T cell apoptosis after stimulation and lentiviral transduction. A-V, Annexin V; PI, propidium iodide. This is a representative image of two independent experiments.
Figure 4
Figure 4
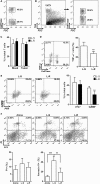
Rik inhibits cytotoxic activity of activated CD8+ T cells in vivo. (A) CD8+ T cell mixture before adoptive transfer. CD8+ T cells transduced with Rik-expressing lentiviruses were labeled with CellTrace Far Red and were then mixed with equivalent number of unlabeled CD8+ T cells transduced with lentiviruses containing scramble sequence. Proportion of each CD8+ T cell subpopulation was shown in the dot plot. (B,C) Proportions of labeled and unlabeled CD8+ T cells in tumor implants. Intratumoral T cells were distinguished by TCR staining and CellTrace Far Red signal. Representative dot plots were shown in panel (B), and statistical analysis was shown in panel (C). L-S: CD8+ T cells transduced with lentiviruses containing scramble sequence. L-R: CD8+ T cells transduced with lentiviruses containing Rik sequence. Numbers in the plots are proportions of gated cell populations. N = 3 per group. (D,E) Expression of TNF-α (D), granzyme B and perforin (E) in transferred CD8+ T cells isolated from tumor implants. Note that these cells were not stimulated in vitro with phorbol ester. Left panels: representative dot plots. Right panels: statistics. Numbers in the plots are proportions of gated cell populations. N = 6 per group. (F) Hepa-1c1c7 cell apoptosis after 24-h coculture with transferred CD8+ T cells isolated from tumor implants. Alone: tumor cells cultured alone. L-S: tumor cells cocultured with control CD8+ T cells. L-R: tumor cells cocultured with Rik-overexpressing CD8+ T cells. Upper panel: representative dot plots. Lower panel: statistics of PI+ or Annexin V+ tumor cells. N = 4 per group (**p < 0.01; ***p < 0.001).
Figure 5
Figure 5
Rik expression in CD8+ T cells favors tumor survival. (A) Tumor size. C: control mice receiving phosphate-buffered saline. L-S: mice receiving CD8+ T cells transduced with scramble lentiviruses. L-R: mice receiving CD8+ T cells transduced with Rik-expressing lentiviruses. Each circle represents an individual mouse. (B) mRNA levels of TNF-α and granzyme B in tumor tissues. N = 4 per group. (C) Tumor cell apoptosis is indicated by terminal deoxynucleotidyl transferase dUTP nick end labeling. This is a representative of three independent experiments. (D) Activation of caspase-3 in tumor tissues. Left panel: representative Immunoblot image. Right panel: statistics of caspase-3. N = 5 per group. (E,F) Tumor cell proliferation is demonstrated by Ki67 staining. Tumor implants were digested as described in Section “Materials and Methods.” Then the whole tissue was pressed through a 70-μm nylon mesh to prepare a single cell suspension, followed by staining with APC anti-CD45 and APC anti-CD31 antibodies. Cells were then stained for Ki67 as described in Section “Materials and Methods.” CD45CD31 tumor cells were shown here. Representative histograms are shown in panel (E), and statistical analysis for Ki67+ cells were shown in panel (F). N = 7 per group (*p < 0.05; **p < 0.01; ***p < 0.001).
Figure 6
Figure 6
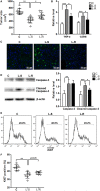
Rik inhibits nuclear translocation of Notch2 intracellular domain (NICD2). (A) mRNA levels of HES1, HES6, and HEY1 in CD8+ T cells. Lentivirus-transduced CD8+ T cells were stimulated in vitro with immobilized delta-like 1 (DLL1) for 4 h before quantitative polymerase chain reaction. L-S: CD8+ T cells transduced with scramble lentiviruses. L-R: CD8+ T cells transduced with Rik-expressing lentiviruses. V: vehicle. D: DLL1. N = 3 per group. (B) Expression of Notch1, Notch2, NICD1, and NICD2 in the whole cell lysates after 1-h stimulation with DLL1. This is a representative of two independent experiments. (C,D) Cell surface expression of Notch1 and Notch2 after 4-h stimulation with DLL1. Representative histograms are shown in panel (C), and statistics of mean fluorescent intensity is shown in panel (D). N = 3 per group. (E,F) Expression of NICD1 and NICD2 in the cytosol and nucleus of CD8+ T cells after 1-h stimulation with DLL1. Representative Immunoblot images are shown in panel (E), and statistical analysis is shown in panel (F). N = 4 per group. (G) Fluorescent microscopy of Notch2. The polyclonal anti-Notch2 antibody recognized both intact Notch2 and NICD2. N: naïve CD8+ T cells. D: DLL1-stimulated CD8+ T cells. (H) Immunoprecipitation of Rik and detection of NICD2. This is a representative of two independent experiments. (I) Nuclear NICD2 levels in isolated intratumoral CD8+ T cells from 3 individual mouse of each group. Left panel: representative Immunoblot image. Right panel: statistics of nuclear NICD2 levels. L-S: mice receiving control CD8+ T cells. L-R: mice receiving Rik-overexpressing CD8+ T cells (**p < 0.01; ***p < 0.001).
Figure 7
Figure 7
Antigen-presenting cells and TGF-β are necessary for upregulation of Rik expression. (A) Rik expression in CD8+ T cells after treatment. Left panel: representative Immunoblot image. Right panel: statistics. Fresh: freshly isolated CD8+ T cells. N: no activation. A: activation with BALB/c splenocytes depleted of T cells. V: phosphate-buffered saline (PBS). N = 3 per group. (B) Rik expression in CD8+ T cells after treatment with agonistic antibodies or BALB/c splenocytes. Left panel: representative Immunoblot image. Right panel: statistics. Abs: agonistic antibodies. Cells: BALB/c splenocytes. V: PBS. N = 3 per group (*p < 0.05; ***p < 0.001).

Similar articles

Cited by

References

    1. Sachdeva M, Chawla YK, Arora SK. Immunology of hepatocellular carcinoma. World J Hepatol (2015) 7:2080–90.10.4254/wjh.v7.i17.2080 - DOI - PMC - PubMed
    1. Shuai Z, Leung MW, He X, Zhang W, Yang G, Leung PS, et al. Adaptive immunity in the liver. Cell Mol Immunol (2016) 13:354–68.10.1038/cmi.2016.4 - DOI - PMC - PubMed
    1. Li KK, Adams DH. Antitumor CD8+ T cells in hepatocellular carcinoma: present but exhausted. Hepatology (2014) 59:1232–4.10.1002/hep.26779 - DOI - PubMed
    1. Fu J, Xu D, Liu Z, Shi M, Zhao P, Fu B, et al. Increased regulatory T cells correlate with CD8 T-cell impairment and poor survival in hepatocellular carcinoma patients. Gastroenterology (2007) 132:2328–39.10.1053/j.gastro.2007.03.102 - DOI - PubMed
    1. Zhang HH, Mei MH, Fei R, Liao WJ, Wang XY, Qin LL, et al. Regulatory T cell depletion enhances tumor specific CD8 T-cell responses, elicited by tumor antigen NY-ESO-1b in hepatocellular carcinoma patients, in vitro. Int J Oncol (2010) 36:841–8.10.3892/ijo_00000561 - DOI - PubMed