

Solid-phase enrichment and analysis of electrophilic natural products
- PMID: 28382178
- PMCID: PMC5355884
- DOI: 10.3762/bjoc.13.43
Solid-phase enrichment and analysis of electrophilic natural products
Abstract
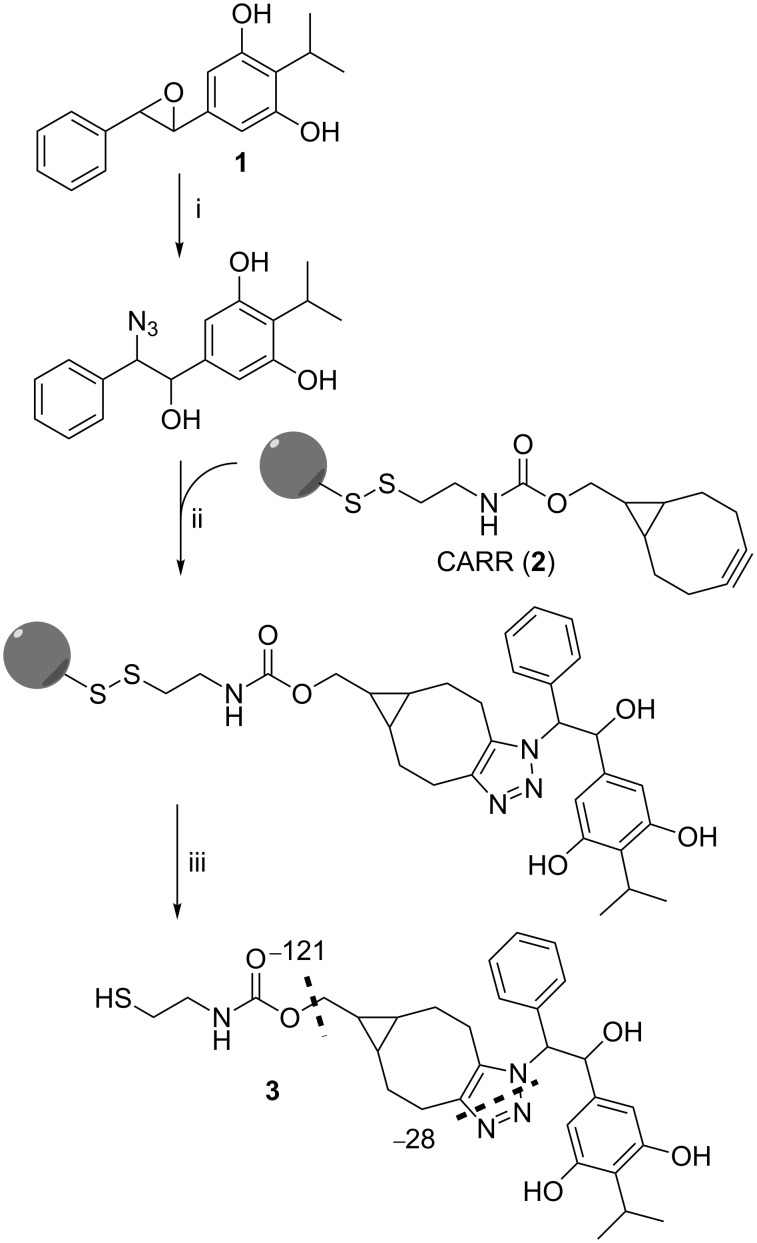
In search for new natural products, which may lead to the development of new drugs for all kind of applications, novel methods are needed. Here we describe the identification of electrophilic natural products in crude extracts via their reactivity against azide as a nucleophile followed by their subsequent enrichment using a cleavable azide-reactive resin (CARR). Using this approach, natural products carrying epoxides and α,β-unsaturated enones as well as several unknown compounds were identified in crude extracts from entomopathogenic Photorhabdus bacteria.
Keywords: Photorhabdus; azides; click chemistry; electrophilic natural products; enrichment; epoxides; glidobactin; stilbenes.
Figures


Similar articles
-
Solid-Phase Enrichment and Analysis of Azide-Labeled Natural Products: Fishing Downstream of Biochemical Pathways.Chemistry. 2016 Jan 11;22(2):639-45. doi: 10.1002/chem.201503781. Epub 2015 Dec 2. Chemistry. 2016. PMID: 26626278
-
A cleavable azide resin for direct click chemistry mediated enrichment of alkyne-labeled proteins.Chem Commun (Camb). 2014 Oct 18;50(81):12098-100. doi: 10.1039/c4cc05246c. Chem Commun (Camb). 2014. PMID: 25168178
-
Thiol Probes To Detect Electrophilic Natural Products Based on Their Mechanism of Action.ACS Chem Biol. 2016 Aug 19;11(8):2328-36. doi: 10.1021/acschembio.5b00924. Epub 2016 Jun 28. ACS Chem Biol. 2016. PMID: 27294329 Free PMC article.
-
CuAAC: An Efficient Click Chemistry Reaction on Solid Phase.ACS Comb Sci. 2016 Jan 11;18(1):1-14. doi: 10.1021/acscombsci.5b00087. Epub 2015 Dec 21. ACS Comb Sci. 2016. PMID: 26652044 Review.
-
Refining the Natural Product Repertoire in Entomopathogenic Bacteria.Trends Microbiol. 2018 Oct;26(10):833-840. doi: 10.1016/j.tim.2018.04.007. Epub 2018 May 22. Trends Microbiol. 2018. PMID: 29801772 Review.
Cited by
-
Mollugin reacts with phenol thiol but not produce modification on cysteine discovered by a phenol thiol probe.Front Cell Dev Biol. 2025 Aug 20;13:1629762. doi: 10.3389/fcell.2025.1629762. eCollection 2025. Front Cell Dev Biol. 2025. PMID: 40909170 Free PMC article.
References
LinkOut - more resources
Full Text Sources
Other Literature Sources