

Multicenter observational prehospital resuscitation on helicopter study
- PMID: 28383476
- PMCID: PMC5562146
- DOI: 10.1097/TA.0000000000001484
Multicenter observational prehospital resuscitation on helicopter study
Abstract
Background: Earlier use of in-hospital plasma, platelets, and red blood cells (RBCs) has improved survival in trauma patients with severe hemorrhage. Retrospective studies have associated improved early survival with prehospital blood product transfusion (PHT). We hypothesized that PHT of plasma and/or RBCs would result in improved survival after injury in patients transported by helicopter.
Methods: Adult trauma patients transported by helicopter from the scene to nine Level 1 trauma centers were prospectively observed from January to November 2015. Five helicopter systems had plasma and/or RBCs, whereas the other four helicopter systems used only crystalloid resuscitation. All patients meeting predetermined high-risk criteria were analyzed. Patients receiving PHT were compared with patients not receiving PHT. Our primary analysis compared mortality at 3 hours, 24 hours, and 30 days, using logistic regression to adjust for confounders and site heterogeneity to model patients who were matched on propensity scores.
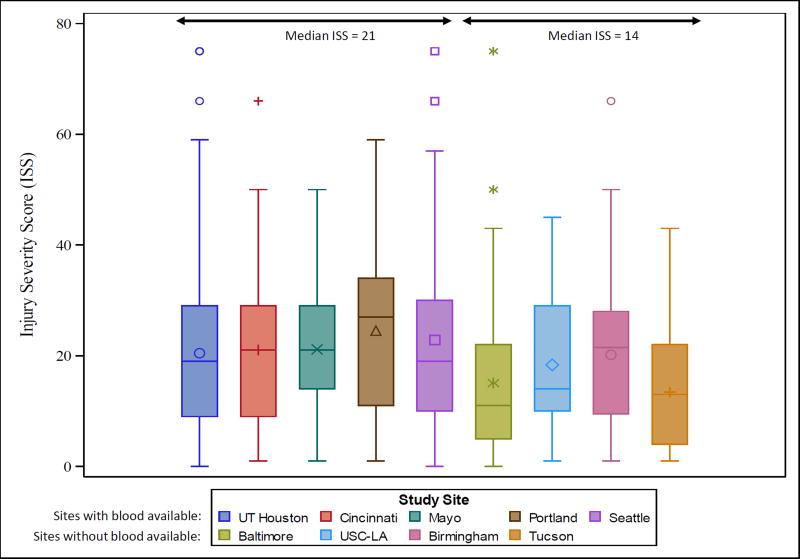
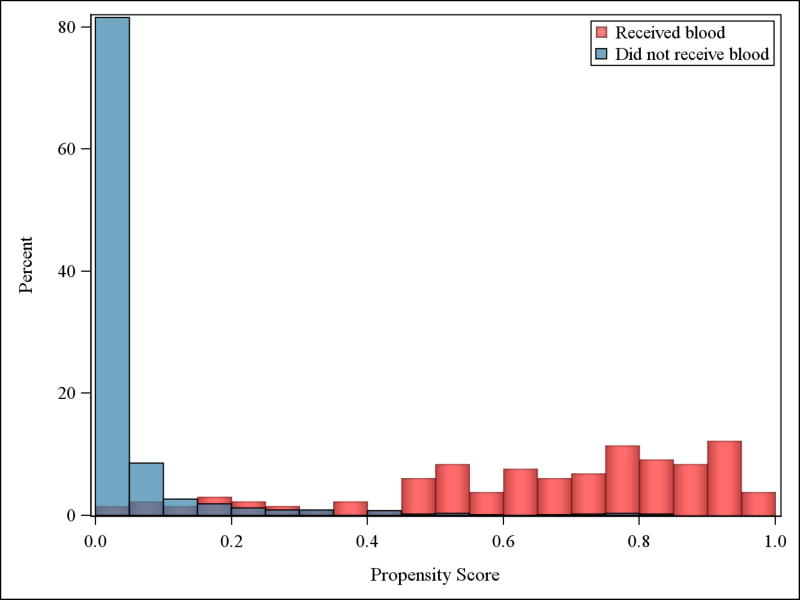
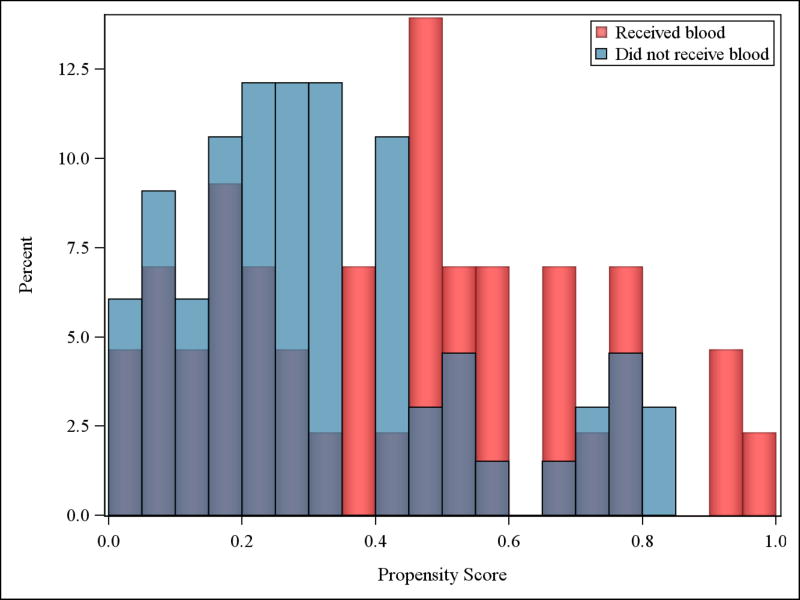
Results: Twenty-five thousand one hundred eighteen trauma patients were admitted, 2,341 (9%) were transported by helicopter, of which 1,058 (45%) met the highest-risk criteria. Five hundred eighty-five of 1,058 patients were flown on helicopters carrying blood products. In the systems with blood available, prehospital median systolic blood pressure (125 vs 128) and Glasgow Coma Scale (7 vs 14) was significantly lower, whereas median Injury Severity Score was significantly higher (21 vs 14). Unadjusted mortality was significantly higher in the systems with blood products available, at 3 hours (8.4% vs 3.6%), 24 hours (12.6% vs 8.9%), and 30 days (19.3% vs 13.3%). Twenty-four percent of eligible patients received a PHT. A median of 1 unit of RBCs and plasma were transfused prehospital. Of patients receiving PHT, 24% received only plasma, 7% received only RBCs, and 69% received both. In the propensity score matching analysis (n = 109), PHT was not significantly associated with mortality at any time point, although only 10% of the high-risk sample were able to be matched.
Conclusion: Because of the unexpected imbalance in systolic blood pressure, Glasgow Coma Scale, and Injury Severity Score between systems with and without blood products on helicopters, matching was limited, and the results of this study are inconclusive. With few units transfused to each patient and small outcome differences between groups, it is likely large, multicenter, randomized studies will be required to detect survival differences in this important population.
Level of evidence: Level II.
Conflict of interest statement
Figures
References
-
- Centers for Disease Control and Prevention, National Center for Injury Prevention and Control. Web-based Injury Statistics Query and Reporting System (WISQARS) Fatal Injury Data. 2016
-
- A National Trauma Care System: Integrating Military and Civilian Trauma Systems to Achieve Zero Preventable Deaths After Injury. [Accessed November 22, 2016]; http://www.nationalacademies.org/hmd/Reports/2016/A-National-Trauma-Care.... - PubMed
-
- Tisherman SA, Schmicker RH, Brasel KJ, Bulger EM, Kerby JD, Minei JP, Powell JL, Reiff DA, Rizoli SB, Schreiber MA. Detailed description of all deaths in both the shock and traumatic brain injury hypertonic saline trials of the Resuscitation Outcomes Consortium. Ann Surg. 2015 Mar;261(3):586–90. - PMC - PubMed
-
- Rhee P, Joseph B, Pandit V, Aziz H, Vercruysse G, Kulvatunyou N, et al. Increasing trauma deaths in the united states. Ann Surg. 2014;260(1):13–21. - PubMed
Publication types
MeSH terms
Grants and funding
LinkOut - more resources
Full Text Sources
Other Literature Sources
Medical
Molecular Biology Databases
Research Materials
Miscellaneous
