. 2017 Jun 20;45(11):6793-6804.
doi: 10.1093/nar/gkx239.

Essential role for non-canonical poly(A) polymerase GLD4 in cytoplasmic polyadenylation and carbohydrate metabolism

Affiliations

Essential role for non-canonical poly(A) polymerase GLD4 in cytoplasmic polyadenylation and carbohydrate metabolism

Jihae Shin et al. Nucleic Acids Res. .

Abstract

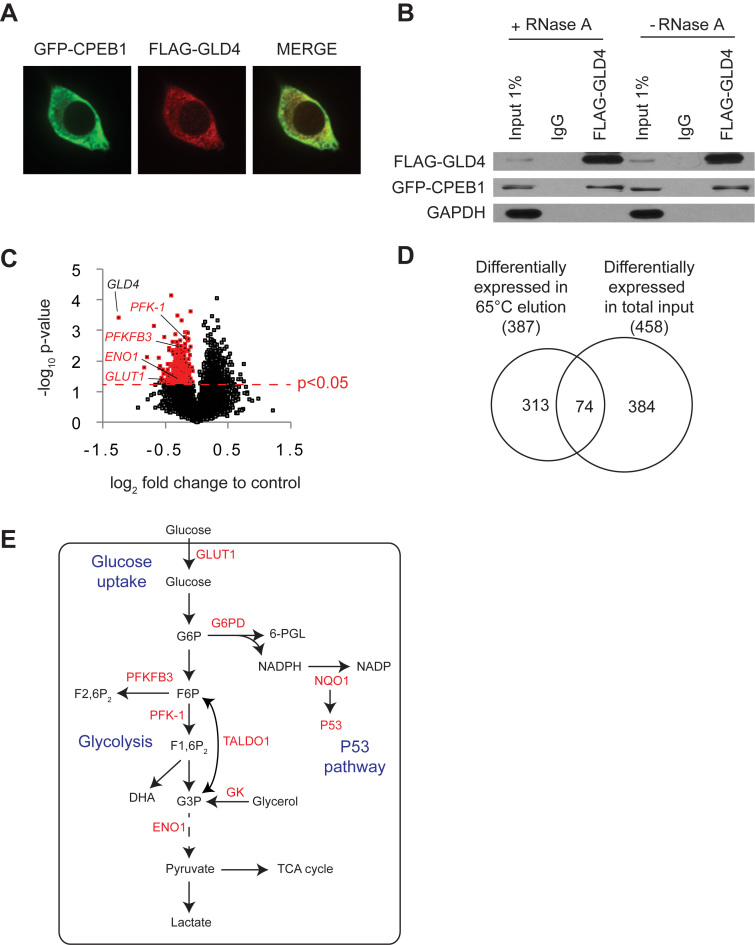
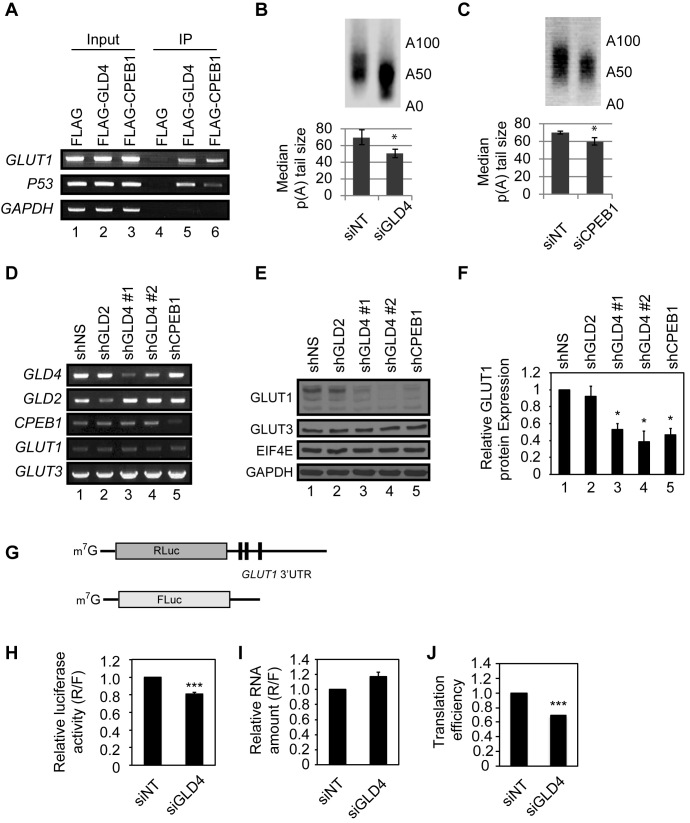
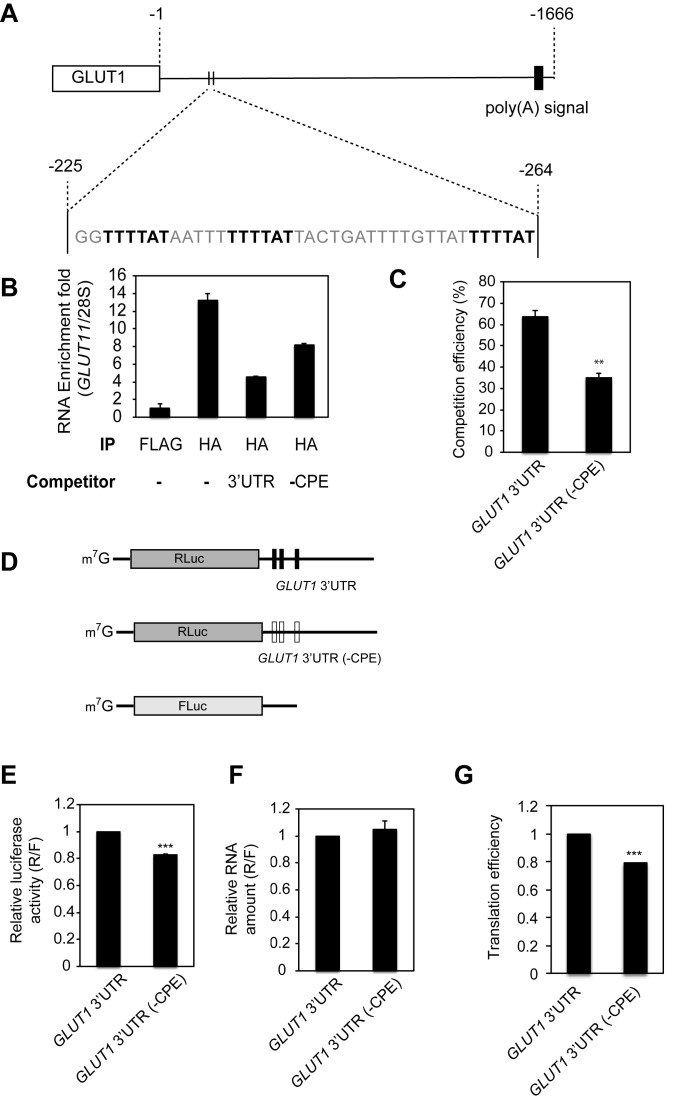
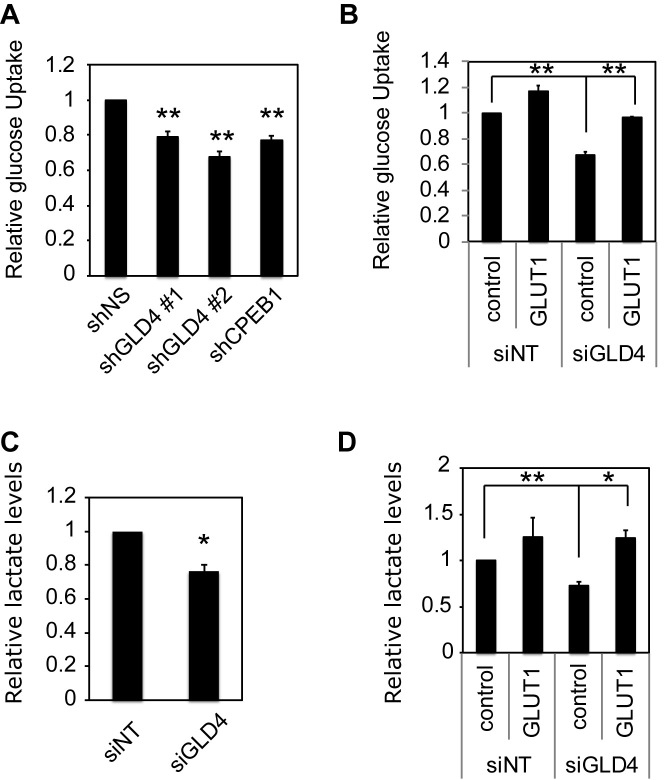
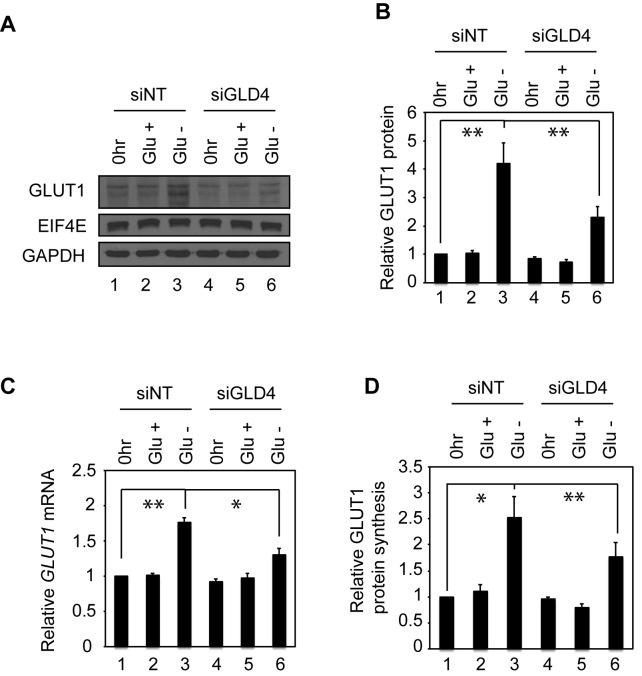
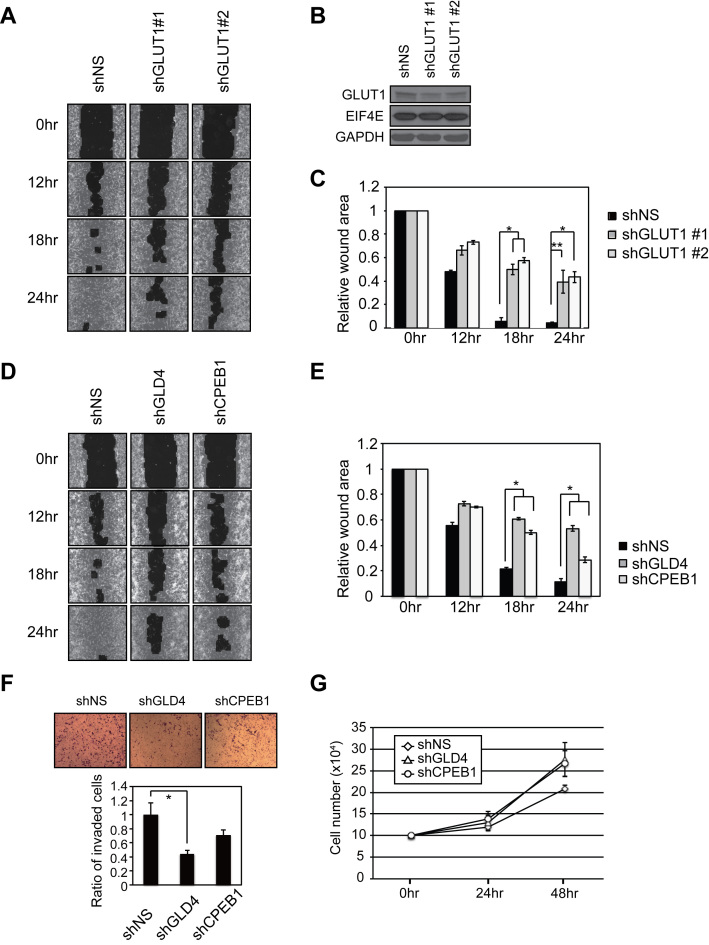
Regulation of gene expression at the level of cytoplasmic polyadenylation is important for many biological phenomena including cell cycle progression, mitochondrial respiration, and learning and memory. GLD4 is one of the non-canonical poly(A) polymerases that regulates cytoplasmic polyadenylation-induced translation, but its target mRNAs and role in cellular physiology is not well known. To assess the full panoply of mRNAs whose polyadenylation is controlled by GLD4, we performed an unbiased whole genome-wide screen using poy(U) chromatography and thermal elution. We identified hundreds of mRNAs regulated by GLD4, several of which are involved in carbohydrate metabolism including GLUT1, a major glucose transporter. Depletion of GLD4 not only reduced GLUT1 poly(A) tail length, but also GLUT1 protein. GLD4-mediated translational control of GLUT1 mRNA is dependent of an RNA binding protein, CPEB1, and its binding elements in the 3΄ UTR. Through regulating GLUT1 level, GLD4 affects glucose uptake into cells and lactate levels. Moreover, GLD4 depletion impairs glucose deprivation-induced GLUT1 up-regulation. In addition, we found that GLD4 affects glucose-dependent cellular phenotypes such as migration and invasion in glioblastoma cells. Our observations delineate a novel post-transcriptional regulatory network involving carbohydrate metabolism and glucose homeostasis mediated by GLD4.


Figures

Figure 1.
Figure 1.
Unbiased genome-wide screen identifies GLD4-regulated mRNAs. (A) Analysis of GLD4 protein localization. HEK 293T cells were transfected with GFP-CPEB1 and FLAG-GLD4, and immunostained with GFP (green) and FLAG (red) antibodies. (B) The same cells as in (A) were used for co-immunoprecipitation. FLAG-GLD4 was immunoprecipitated with IgG or FLAG antibody in the presence or absence of RNase A, and immunoblotted for FLAG, GFP and GAPDH. (C) Venn-diagram showing overlap of 74 mRNAs between the 387 that were differentially expressed in 65°C thermal elution fraction and the 458 that were differentially expressed in the total input fraction. (D) RNA from siNT or siGLD4-treated human primary foreskin fibroblasts was fractionated on poly(U) agarose, thermally eluted at 65°C and then subjected to microarray analysis. All 14666 detected RNAs were plotted as log2 fold change (abscissa) versus –log10P-value (ordinate) in GLD4 knockdown cells compared to control cells. 387 down-regulated RNAs in the 65°C fraction with P-value <0.05 are highlighted in red (see Supplementary Table S2). Four GLD4 target mRNAs (GLUT1, PFKFB3, PFK-1 and ENO1) are also labeled. (E) A schematic diagram showing glucose uptake, glycolysis and P53 pathways and GLD4 regulated RNAs (labeled in red; see main text for full name of the enzymes). G6P, glucose-6-phosphate; 6-PGL, 6-phosphoglconolactone; NADP, nicotinamide adenine dinucleotide phosphate; F6P, fructose-6-phosphate; F2,6P2, fructose-2,6-biphosphate; F1,6P2, fructose-1,6-biphosphate; G3P, glyceraldehyde-3-phosphate.
Figure 2.
Figure 2.
GLD4 regulates GLUT1 poly(A) tail length and protein levels. (A) U87MG cells were transfected with plasmids carrying FLAG epitope only, FLAG-GLD4, or FLAG-CPEB1. After immunoprecipitation with FLAG antibody, extracted RNAs were subjected to RT-PCR for GLUT1 and P53 transcripts. GAPDH is a negative control. (B) U87MG cells were transfected with siNT and siGLD4 for 24 h, and they were subjected to RL-PAT assay to measure poly(A) tail size of GLUT1 mRNA. Relative signal intensity was quantified to estimate median poly(A) tail size (median ± SEM) (n = 3). (C) U87MG cells were transfected with siNT and siCPEB1 for 24 h, and were subjected to RL-PAT assay (median ± SEM) (n = 3). (D) U87MG cells were transduced with shNS, or shRNAs targeting GLD2, GLD4 and CPEB1. GLD4#1 and #2 indicate two separate shRNAs targeting different regions of GLD4. After 72 h after transduction, these cells were subjected to RT-PCR to measure knockdown efficiency of each shRNA and GLUT1 mRNA. GLUT3 mRNA was not changed and served as a control. (E) The same set of cells as in (D) was used for immunoblot analysis for GLUT1 and GLUT3 protein. eIF4E and GAPDH served as loading controls. (F) Quantification of relative GLUT1 protein with knockdown of GLD2, GLD4 and CPEB1 (mean ± SEM) (n = 3). (G) RNA reporter constructs used to measure translation efficiency. m7G denotes 7-methyl-guanosine cap structure. Solid line and black columns represents untranslated region (UTR) and CPE, respectively. (H) siNT and siGLD4 treated U87MG cells were transfected with Renilla luciferase RNA harboring GLUT1 3΄UTR and firefly luciferase as a transfection control. After 6 h, cells were harvested and measured for luciferase activity (R/F) (mean ± SEM) (n = 6). (I) The same set of cells as in (H) was used to assess the relative amount of RNA (R/F) (mean ± SEM) (n = 3) by real-time PCR. (J) Translation efficiency is calculated by dividing numbers from (H) with those from (I).* indicates P < 0.05, ** indicates P < 0.01 and *** indicates P < 0.001 by two-tailed Student's t-test.
Figure 3.
Figure 3.
CPEB1 regulates GLUT1 translation. (A) Schematic diagram for the 3΄ UTR of the GLUT1 mRNA. The rectangle indicates the open reading frame and the solid line indicates the 1.67 kb-long 3΄ UTR. Three CPEs within a 40nt window between positions 225 and 264 are bold highlighted. (B) U87MG cells were transduced with HA-CPEB1 expressing lentivirus. GLUT1 3΄ UTR RNA containing or lacking three CPEs were added to the lysate as competitors of RNA-IP reactions. After immnoprecipitation with HA antibody, RNAs were subjected to real-time PCR for the levels of GLUT1 RNA and normalized to 28S rRNA to quantify fold enrichment in each condition. The experiments were performed three times and one representative result is shown here. (C) The relative competition efficiency was calculated compared to the reaction without any competitor (mean ± SEM) (n = 3). (D) Schematic diagram of RNA reporter constructs. Three vertical black bars in GLUT1 3΄UTR denote CPEs, and white bars indicate lack of CPEs. (E) U87MG cells were transfected with a luciferase reporter harboring GLUT1 3΄ UTR containing or lacking three CPEs. After 6 h, relative Renilla luciferase (R) to firefly (F) activity was measured (R/F) (mean ± SEM) (n = 5). (F) The same set of cells as in (E) was used to assess the relative amount of RNA (R/F) (mean ± SEM) (n = 4) by real-time PCR. (G) Translation efficiency is calculated by dividing numbers from (E) with those from (F).* indicates P < 0.05, ** indicates P < 0.01 and *** indicates P < 0.001 by two-tailed Student's t-test.
Figure 4.
Figure 4.
GLD4 regulates glucose metabolism. (A) U87MG cells were transduced with shNS, or shRNAs targeting GLD4 or CPEB1 and measured for glucose uptake (mean ± SEM) (n = 4) after 72 h. (B) U87MG cells were transduced with lentivirus expressing empty vector (control) or a GLUT1 expressing vector and 24 h later the same cells were transfected with siNT or siGLD4. After 48 h, cells were measured for glucose uptake (mean ± SEM) (n = 3). (C) U87MG cells were transfected with siNT or siGLD4 and measured for lactate levels (mean ± SEM) (n = 4). (D) U87MG cells were transduced with lentivirus expressing empty vector (control) or a GLUT1 expressing vector and 24 h later the same cells were treated with siNT or GLD4. After 48 h, cells were measured for lactate levels (mean ± SEM) (n = 4). * indicates P < 0.05, ** indicates P < 0.01 and *** indicates P < 0.001 by two-tailed Student's t-test.
Figure 5.
Figure 5.
GLD4 regulates glucose deprivation-induced GLUT1 expression. (A) GLUT1 protein levels upon glucose deprivation (Glu–) in control (siNT) or GLD4 knockdown U87MG cells (siGLD4). 0 h rindicates pre-deprivation and Glu+ indicates a non-deprivation control. Glu– indicates glucose deprivation for 24 h. EIF4E and GAPDH were used as loading controls. (B) Relative GLUT1 protein levels were quantified compared to 0 h of the control cells (mean ± SEM) (n = 6). (C) The same set of cells as (B) was subjected to RT-qPCR to test GLUT1 mRNA levels. (D) Relative GLUT1 protein synthesis is calculated by dividing numbers from (B) with those from (C). * indicates P < 0.05, ** indicates P < 0.01 and *** indicates P < 0.001 by two-tailed Student's t-test.
Figure 6.
Figure 6.
GLD4 and GLUT1 regulate cell migration. (A) U87MG cells were infected with shNS or lentivirus expressing two different GLUT1 shRNAs. After 72 h, cells were subjected to wound healing assays. Images were captured 12, 18 and 24 h after the initial wound. Images from each time point are shown for graphical representations of wound healing ability. (B) Knockdown efficiency of two different shRNAs targeting GLUT1 was analyzed by western blot. eIF4E and GAPDH were negative controls. (C) Quantification of the relative wound area after 0, 12, 18 and 24 h after initial wound (mean ± SEM) (n = 6). (D) Wound healing assay as described in (A) was performed for shNS, shGLD4 or shCPEB1 infected cells. (E) Quantification of the relative wound area (mean ± SEM) (n = 6). (F) Matrigel invasion assays with U87MG cells infected with lentivirus expressing the indicated shRNAs (mean ± SEM) (n = 3). (G) Proliferation rate of the shRNA knockdown cells 24 and 48 h post-infection (mean ± SEM) (n = 4). * indicates P < 0.05, ** indicates P < 0.01 and *** indicates P < 0.001 by two-tailed Student's t-test.

References

    1. Schmidt M.J., Norbury C.J.. Polyadenylation and beyond: emerging roles for noncanonical poly(A) polymerases. Wiley Interdiscipl. Rev. RNA. 2010; 1:142–151. - PubMed
    1. Tomecki R., Dmochowska A., Gewartowski K., Dziembowski A., Stepien P.P.. Identification of a novel human nuclear-encoded mitochondrial poly(A) polymerase. Nucleic Acids Res. 2004; 32:6001–6014. - PMC - PubMed
    1. Mellman D.L., Gonzales M.L., Song C., Barlow C.A., Wang P., Kendziorski C., Anderson R.A.. A PtdIns4,5P2-regulated nuclear poly(A) polymerase controls expression of select mRNAs. Nature. 2008; 451:1013–1017. - PubMed
    1. Lim J., Ha M., Chang H., Kwon S.C., Simanshu D.K., Patel D.J., Kim V.N.. Uridylation by TUT4 and TUT7 marks mRNA for degradation. Cell. 2014; 159:1365–1376. - PMC - PubMed
    1. Barnard D.C., Ryan K., Manley J.L., Richter J.D.. Symplekin and xGLD-2 are required for CPEB-mediated cytoplasmic polyadenylation. Cell. 2004; 119:641–651. - PubMed