Review
. 2017 Mar 20:38:351-370.
doi: 10.1146/annurev-publhealth-031816-044208.

Evaluating the Health Impact of Large-Scale Public Policy Changes: Classical and Novel Approaches

Affiliations
Review

Evaluating the Health Impact of Large-Scale Public Policy Changes: Classical and Novel Approaches

Sanjay Basu et al. Annu Rev Public Health. .

Abstract

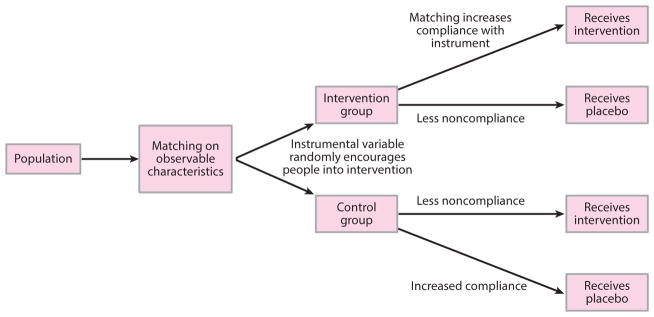
Large-scale public policy changes are often recommended to improve public health. Despite varying widely-from tobacco taxes to poverty-relief programs-such policies present a common dilemma to public health researchers: how to evaluate their health effects when randomized controlled trials are not possible. Here, we review the state of knowledge and experience of public health researchers who rigorously evaluate the health consequences of large-scale public policy changes. We organize our discussion by detailing approaches to address three common challenges of conducting policy evaluations: distinguishing a policy effect from time trends in health outcomes or preexisting differences between policy-affected and -unaffected communities (using difference-in-differences approaches); constructing a comparison population when a policy affects a population for whom a well-matched comparator is not immediately available (using propensity score or synthetic control approaches); and addressing unobserved confounders by utilizing quasi-random variations in policy exposure (using regression discontinuity, instrumental variables, or near-far matching approaches).

Keywords: difference-in-differences; instrumental variables; near-far matching; propensity score; regression discontinuity; synthetic controls.


Figures

Figure 1
Figure 1
California’s cigarette sales per capita. Proposition 99, which brought forth new tobacco taxes and clean air laws, was implemented in 1988. A problem with simple pre-post analysis is that cigarette sales were already declining prior to implementation of the proposition. One asks, then, did implementation of the proposition accelerate this decline?
Figure 2
Figure 2
Illustration of difference-in-differences analysis. Two groups are followed over time, where the difference between the groups before the intervention affects one group is assumed to be the likely difference that would have been observed afterward between the groups if the intervention had not occurred (hence, the intervention group would have the purple dashed line trajectory without the intervention). The difference between the dashed intervention group point after the policy and the observed intervention group result is estimated to be the policy effect.
Figure 3
Figure 3
Synthetic control analysis. (a) Intuition behind synthetic control analysis. The control group populations are reweighted to match predictors of the health outcome in the intervention group, creating a synthetic intervention group. (b) Example of synthetic control analysis applied to tobacco smoking control policy in California. Independent reproduction of results from Reference . California, under the tobacco control regulation Proposition 99 (enacted in 1988, gray dashed line), is seen to deviate significantly from the synthetic California constructed as a weighted average of trajectories of other states, where the weights are determined by matching the predictors of tobacco smoking among the control states with the values of predictors of tobacco smoking in California. (c) Example of a placebo analysis. In this placebo test, states from the control pool are swapped out for California in the reweighting procedure, such that the weighting is reconducted as if one of the control states passed the new policy and the intervention state is now a control state. By doing all possible combinations of this swapping procedure, we can observe whether the observed trajectory of health outcomes in the intervention state is consistent or significantly inconsistent with all possible trajectories of health outcomes from all other states. Here, we see a comparison of Colorado’s smoking trajectory to a synthetic Colorado, which does not significantly differ from the observed trajectory.
Figure 4
Figure 4
Regression discontinuity designs. Suppose we are evaluating the impact of a nationally subsidized, school fruit and vegetable program in which children at schools just below the neighborhood-level income threshold are included in program, whereas children that exceed the threshold are ineligible. In a theoretical data set, we can see in panel a that a discontinuity in fruit and vegetable intake appears on either side of the 250% federal poverty level cut point; however, in panel b we see that counties may be misreporting income levels so that children may qualify for a program-participating school because there is a notch showing abnormally high densities just above the 250% federal poverty line, suggesting misreporting of income levels to qualify for the program.
Figure 5
Figure 5
Principles behind instrumental variables analysis. (a) Classical instrumental variables design. (b) Comparing an instrumental variable to a randomized controlled trial reveals the problem of weak instruments. Weak instruments are those that randomly encourage members of the population to enter into a program or not, but many people can be noncompliant and not abide by the random encouragement.
Figure 6
Figure 6
The intuition behind near-far matching. Compare with Figure 5b. As in a matched-pair randomized controlled trial, individuals are first matched on observable characteristics, which increases the probability that the influence of the instrumental variable will be to encourage persons into the policy of interest or not. As such, otherwise similar people (near to each other on observable characteristics) who receive different levels of encouragement into the program (far values on the instrumental variable) are likely to have different probabilities of enrolling into the program under study. A weak instrument is made stronger through this method.

Similar articles

Cited by

References

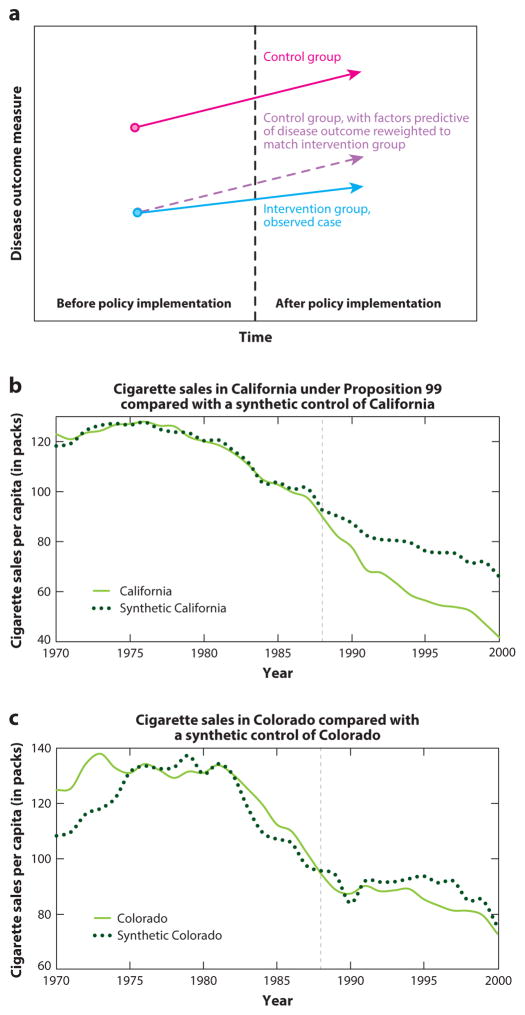
    1. Abadie A, Diamond A, Hainmueller J. Synthetic control methods for comparative case studies: estimating the effect of California’s tobacco control program. J Am Stat Assoc. 2010;105:493–505.
    1. Angell SY, Silver LD, Goldstein GP, Johnson CM, Deitcher DR, et al. Cholesterol control beyond the clinic: New York City’s trans fat restriction. Ann Intern Med. 2009;151(2):129–34. - PubMed
    1. Angrist JD, Pischke J-S. Mostly Harmless Econometrics: An Empiricist’s Companion. Princeton, NJ: Princeton Univ. Press; 2008.
    1. Austin PC. The relative ability of different propensity score methods to balance measured covariates between treated and untreated subjects in observational studies. Med Decis Making. 2009;29:661–77. - PubMed
    1. Austin PC. Type I error rates, coverage of confidence intervals, and variance estimation in propensity-score matched analyses. Int J Biostat. 2009;5(1):13. - PMC - PubMed

LinkOut - more resources