. 2017 Apr 6;12(4):e0175293.
doi: 10.1371/journal.pone.0175293. eCollection 2017.

Proton and non-proton activation of ASIC channels

Affiliations

Proton and non-proton activation of ASIC channels

Ivan Gautschi et al. PLoS One. .

Abstract

The Acid-Sensing Ion Channels (ASIC) exhibit a fast desensitizing current when activated by pH values below 7.0. By contrast, non-proton ligands are able to trigger sustained ASIC currents at physiological pHs. To analyze the functional basis of the ASIC desensitizing and sustained currents, we have used ASIC1a and ASIC2a mutants with a cysteine in the pore vestibule for covalent binding of different sulfhydryl reagents. We found that ASIC1a and ASIC2a exhibit two distinct currents, a proton-induced desensitizing current and a sustained current triggered by sulfhydryl reagents. These currents differ in their pH dependency, their sensitivity to the sulfhydryl reagents, their ionic selectivity and their relative magnitude. We propose a model for ASIC1 and ASIC2 activity where the channels can function in two distinct modes, a desensitizing mode and a sustained mode depending on the activating ligands. The pore vestibule of the channel represents a functional site for binding non-proton ligands to activate ASIC1 and ASIC2 at neutral pH and to prevent channel desensitization.


Conflict of interest statement

Competing Interests: The authors have no competing interest.

Figures

Fig 1
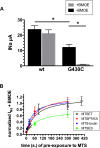
Fig 1. Accessibility of MTSET, MTSPTrEA, MTSEA-biotin and MTSES to the cysteine at position G430 of ASIC1a.
A. Current measurements elicited at pH 5.5 in oocytes expressing ASIC1a wt (n = 72) or ASIC1a-G430C (n = 70) before (-BMOE, n = 77) or after (+BMOE, n = 65) 5 min. of incubation with 2 mM BMOE. * denotes p< 0.01. B. Relation between the ASIC1a-G430C peak current measured in the presence of 2 mM BMOE, and the time of pre-exposure to 10 μM of either MTSET, MTSPTrEA, MTSEA-biotin or MTSES. Current values were normalized for the peak current measured after 10 min. exposure of MTSET, MTSPTrEA, MTSEA-biotin or MTSES (10 μM), in the absence of BMOE. Each point represents the mean (m±SE) of 7 to 11 measurements.
Fig 2
Fig 2. Representative tracings of ASIC1a-G430C currents elicited at different pH values after covalent modification with MTS-reagents.
Oocytes expressing ASIC1-G430C were perfused at pH7.8 (blue line) and ASIC1a currents were elicited by a pH change (red line) to 7.4, 7.0, 6.5, or 6.0; amiloride (300 μM, dashed line) was added to bath upon pH return to 7.8. In (A) the oocyte expressing ASIC1a-G430C was not pre-incubated with MTS, while in all the other conditions oocytes were pre-incubated at pH 7.8 for 10 min with 100 μM of one of the following compounds: MTSET (B), MTSPTrEA (C), MTSEA-biotin (D), or MTSES (E).
Fig 3
Fig 3. pH-dependence of activation of ASIC1a-G430C currents after channel modification by MTS-reagents.
Currents recorded in oocytes expressing ASIC1a-G430C and incubated beforehand with MTSET, MTSPTrEA, MTSPT, MTSBT, MTSEA-biotin, MTSEA, MTSES (100 μM) during 10 min. at pH 7.8. Currents are elicited by acidic pH changes ranging from 7.8 to 5.5. Black circles and black solid lines represent the total inward current, pink circles and lines represent the desensitizing current (Idesens), red circles and lines the sustained current (Isust). The lines represent the best non-linear fit for the pH-dependence of current activation. For comparison, the dashed line represents the pH dependence of activation of ASIC1-G430C without pre-incubation with MTS-reagents obtained from data shown in S2 Fig. Each current value was normalized for the maximal total inward current elicited at pH 5.5. Each symbol represents the mean ± SE of 10 to 53 measurements.
Fig 4
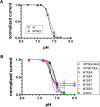
Fig 4. pH-dependence of steady-state desensitization (SSD).
ASIC1a currents elicited by acidic pH 5.5, were measured after a 40 s. incubation at a conditioning pH ranging from 7.8 to 6.5. All currents were normalized for the maximal inward current elicited by pH drop from 7.8 to 5.5 (see methods). A. Current values obtained for SSD of ASIC1a-wt before (n = 22, open circles) and after incubation with MTSET (n = 10, closed circles). B. Current values obtained for SSD of ASIC1a-G430C before after pre-incubation with MTS reagents. Each symbol represents the mean ± SE for ASIC1a_G430C, either non-treated (control, n = 26), or pre-incubated for 10 min with 100 μM of either MTSET (n = 16), MTSPTrEA (n = 12), MTSBT (n = 4), MTSPT (n = 4), MTSEA (n = 6), MTSEA-biotin (n = 15), or MTSES (n = 8).
Fig 5
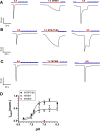
Fig 5. ASIC1a-G430C activation by MTS-reagents at neutral pH.
A-C. Oocytes expressing G430C were perfused at pH 7.8 (blue line); current was first elicited at pH 5.5 (red line) before returning the extracellular pH 7.8 with amiloride (dashed line). Then, the extracellular pH was set at 7.4 or 7.0, and the oocytes perfused for 40 s. with solutions containing 100 μM (crosshatching red line) of either MTSET (A), MTSPTrEA (B), or MTSES (C); removal of MTS and addition of amiloride were done at pH7.8. A second acidic pulse at pH 5.5 (red line) was performed that included, sequentially, the removal of amiloride, the acidification at pH 5.5 and the re-addition of amiloride (300 μM) at pH 7.8. D. pH-dependence of ASIC1-G430C activation by MTSET (open circles) and MTSPTrEA (filled circles). Values obtained 30s. after addition of the MTS were normalized for the maximal current obtained during the second acidic pulse at pH 5.5. Values on the graph are mean ±SE from 15 to 53 measurements. Dashed lines represent the best fits for the pH dependency.
Fig 6
Fig 6. State-dependent stimulation of ASIC1a-G430C by MTS reagents.
ASIC1a-G430C sustained current (Isust) was elicited by MTSET, MTSPTrEA, MTSEA-biotin in oocytes pre-incubated beforehand during 10 min. with 100 μM MTSET (n = 17), MTSPTrEA (n = 21), or MTSEA-biotin (n = 9). A. Representative current tracing of an oocyte expressing ASIC1a-G430C and pre-incubated with MTSET (100 μM). A first transient acidic pulse was performed from pH 7.8 (blue line) to pH 5.5 (red line); a second acidic pulse was repeated at pH 5.5, followed by the addition of MTSET (100 μM, crosshatching red line) at pH 7.0, before returning to baseline at pH7.8 in the presence of amiloride (300 μM, dashed line). B. Isust elicited by MTSET (n = 22), MTSPTrEA (n = 19) or MTSEA-biotin (n = 6) (x-axis) during the second acidic pulse (see tracing in A.); Isust elicited by the MTS-reagents were normalized for the Isust values obtained before addition of the reagent. *denotes significance at p<0.01 using one-way ANOVA test using values obtained in oocytes pre-incubated and stimulated by MTSEA-biotin.
Fig 7
Fig 7. pH-dependence of the ASIC1a-G430C open state.
A-B. ASIC1a currents were elicited by MTSET (A) or MTSPTrEA (B) at pH 6.8 (blue line), and measured at different pHs ranging from 7.2 to 7.8. Between each pH change ASIC1a current returned to baseline in the presence of amiloride at pH 7.8 (dotted line). At the end, ASIC1 currents were measured at pH 5.5 to assess Imax for current normalization C. pH-dependence between 6.5 and 7.8 of the ASIC1a-G430C Isust after activation by MTSET (pH0.5 = 7.31, 95%CI:7.27–7.35, n = 33) or MTSPTrEA (pH0.5 = 7.57, 95%CI:7.54–7.60, n = 26). Isust(norm.) denotes Isust normalized for maximal peak current elicited at pH 5.5. Symbols represent mean ± SE.
Fig 8
Fig 8. Current-voltage relations of ASIC1a wt and G430C.
Peak desensitizing currents (Idesens) triggered at pH 5.5 were measured for ASIC1a wt and ASIC1a-G430C at holding potentials ranging from -80 mV and + 40 mV. Isust for ASIC1a-G430C was measured at pH 7.0 following 10 min pre-incubation at pH 7.8 with 100 μM MTSPTrEA. Reversal potentials, determined by linear regression analysis, were 23.42 ± 1.33 mV (n = 6), 26.15 ± 1.44 mV (n = 18) and -1.38 ± 0.92 mV (n = 12 p<0.001), respectively for the Ipeak of ASIC1a-wt and ASIC1a-G430C, for the Isust of the MTSPTrEA-modified ASIC1a-G430C.
Fig 9
Fig 9. Representative recordings of ASIC2a-wt and ASIC2a-A427C.
Oocytes expressing ASIC2a-wt or ASIC2a-A427C were perfused at pH7.8 (blue line); ASIC2a currents were elicited by a pH change to 7.4, 7.0, 6.5, 6.0 and 4.0 (red line) and currents subsequently blocked by perfusion with 300 μM amiloride (dashed line) at pH 7.8. Vertical alignment of the tracings from left to right show ASIC2a-wt (A), and ASIC2a-A427C (B) control currents, and ASIC2a-A427C currents after 10 min. pre-incubation with 100μM MTSES (C), MTSET (D), or MTSPTrEA (E).
Fig 10
Fig 10. Sustained and desensitizing current of the ASIC2a-A427C mutant.
A. pH-dependence of the maximal inward current (black), of the desensitizing current (purple) and the sustained current (red) of the ASIC2a-A427C. Each point represents the mean ± SE of 3 to 5 independent measurements. Curve fit of Imax represents the sum of the individual fits obtained for Idesens and Isust. B. pH-dependence of the Isust recorded from oocytes expressing ASIC2a-A427C after pre-incubation with 100 μM of MTSET (red circles, MTSPTrEA (purple squares), MTSBT (blue triangles), or MTSES (black diamonds). Symbols represent means ± SE of 3 to 15 independent measurements. Isust values were normalized for the maximal inward current elicited at pH 4.0; dashed lines represent best fit to current data. C. SSD determined for ASIC2a wt, A427C, and A427C incubated with MTSET; currents elicited by acidic pH 4.0, and measured after incubation at a conditioning pH ranging from 7.8 to 4.0. Symbols represent means ± SEM of 7 to 8 independent measurements. D. Current-voltage relations obtained for Imax, Isust, and Idesens currents of ASIC2a-A427C unmodified by MTS-reagents; reversal potentials were (mean ± SE) 0.3 ± 1.8 mV, -8.7 ± 2.4 mV and 5.8 ± 1.3 mV (p<0.01), respectively (n = 5). Similar values were obtained for ASIC2wt for these three currents, respectively 1.2 ± 4.5 mV, -7.1 ± 4.0 mV and 12.5 ± 4.5 mV (n = 5).
Fig 11
Fig 11. Activation of ASIC2a-A427C by MTS-reagents at neutral pH.
Oocytes expressing ASIC2a-A427C were subjected to a protocol similar as in Fig 5A. After an initial current pulse elicited at pH 4.0, ASIC2a-A427C was activated at pH 7.0 by 100 μM of MTSET (A), MTSES (B), or MTSPTrEA (C). The recording was terminated by a final pH pulse at pH 4.0. Blue line corresponds to pH 7.8, the red line to acidic pH 7.0 or 4.0, dashed line to the addition of 300 μM amiloride. D. pH-dependence of Isust normalized for the maximal current elicited at pH 4.0 elicited by MTSET (n = 4–13) or MTSPTrEA (n = 6–10).
Fig 12
Fig 12. Kinetics model for ASIC1a and ASIC2a activity underlying sustained and desensitizing currents.
The different channel conformation states represented in this model have been identified in our experiments. In black are the conformation states common to ASIC1a and ASIC2a, in blue conformation states observed only for ASIC1a, in red conformation states observed only for ASIC2a. Numbers denote the pKa values taken for our experiments of the equilibrium reaction between 2 states, in blue for ASIC1a, in red for ASIC2a. Non-conducting ASICs at pH 7.4 in a resting state (NCR) can undergo either desensitization (Idesens, grey area) or a sustained activity (Isust, pink area), depending on the external pH and/or binding of MTSPTrEA (MTS). The NCR is in equilibrium with the desensitized state HNCD and with the open state HOD, the latter being in a non-equilibrium with the HNCD state. The pKa values for these reactions (blue for ASIC1a, red for ASIC2a) were determined in our experiments. In ASIC2a, NCR state is in equilibrium with a desensitized state NCD and an open state HOS depending on the pH; by contrast to ASIC1a, this HOS is in equilibrium with a desensitized HNCD. Binding of MTSPTrEA to resting, desensitizing or open states (NCRMTS, HNCDMTS, HODMTS) promotes a channel open state in equilibrium with the desensitized states to trigger Isust.

Similar articles

Cited by

References

    1. Kellenberger S, Schild L. International Union of Basic and Clinical Pharmacology. XCI. structure, function, and pharmacology of acid-sensing ion channels and the epithelial Na+ channel. Pharmacol Rev. 2015;67(1):1–35. doi: 10.1124/pr.114.009225 - DOI - PubMed
    1. Wemmie JA, Taugher RJ, Kreple CJ. Acid-sensing ion channels in pain and disease. Nat Rev Neurosci. 2013;14(7):461–71. PubMed Central PMCID: PMCPMC4307015. doi: 10.1038/nrn3529 - DOI - PMC - PubMed
    1. Escoubas P, De Weille JR, Lecoq A, Diochot S, Waldmann R, Champigny G, et al. Isolation of a tarantula toxin specific for a class of proton-gated Na+ channels. J Biol Chem. 2000;275(33):25116–21. Epub 2000/06/01. doi: 10.1074/jbc.M003643200 - DOI - PubMed
    1. Diochot S, Baron A, Rash LD, Deval E, Escoubas P, Scarzello S, et al. A new sea anemone peptide, APETx2, inhibits ASIC3, a major acid-sensitive channel in sensory neurons. Embo J. 2004;23(7):1516–25. doi: 10.1038/sj.emboj.7600177 - DOI - PMC - PubMed
    1. Diochot S, Baron A, Salinas M, Douguet D, Scarzello S, Dabert-Gay AS, et al. Black mamba venom peptides target acid-sensing ion channels to abolish pain. Nature. 2012;490(7421):552–5. Epub 2012/10/05. doi: 10.1038/nature11494 - DOI - PubMed

MeSH terms

LinkOut - more resources