. 2017 Apr 5;94(1):138-152.e5.
doi: 10.1016/j.neuron.2017.03.017.

Genetically Distinct Parallel Pathways in the Entopeduncular Nucleus for Limbic and Sensorimotor Output of the Basal Ganglia

Affiliations

Genetically Distinct Parallel Pathways in the Entopeduncular Nucleus for Limbic and Sensorimotor Output of the Basal Ganglia

Michael L Wallace et al. Neuron. .

Abstract

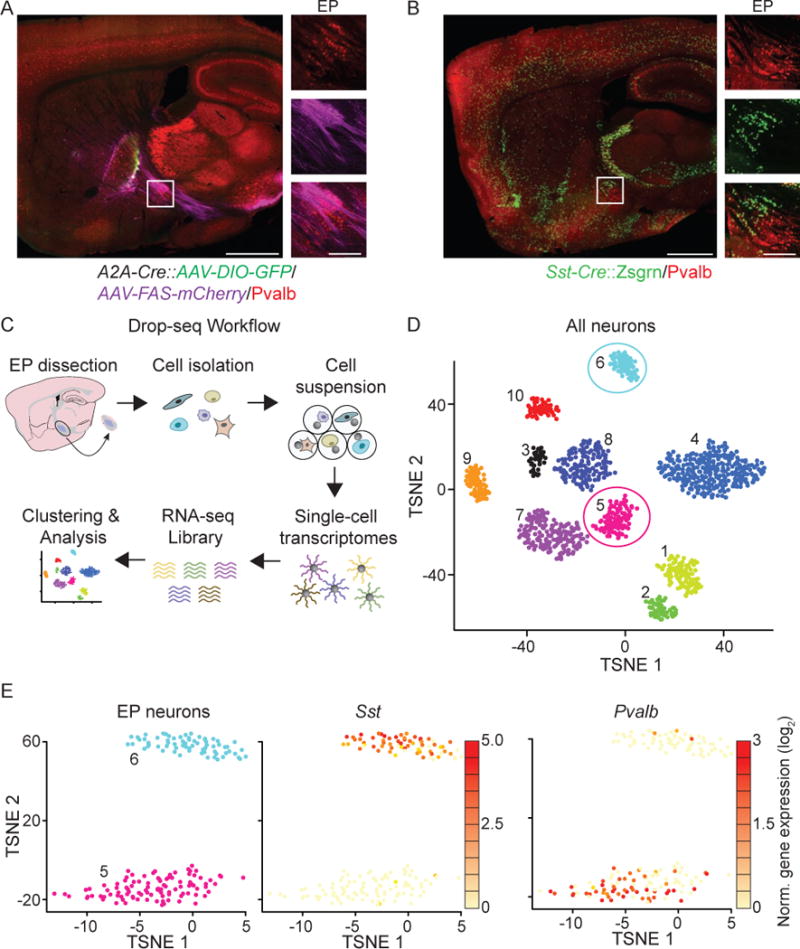
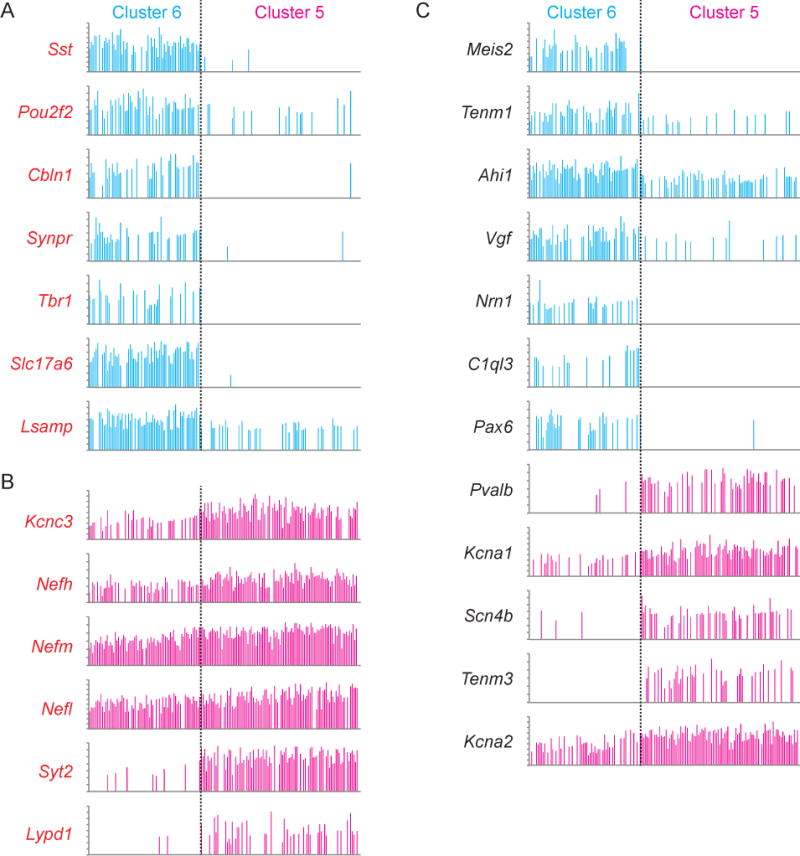
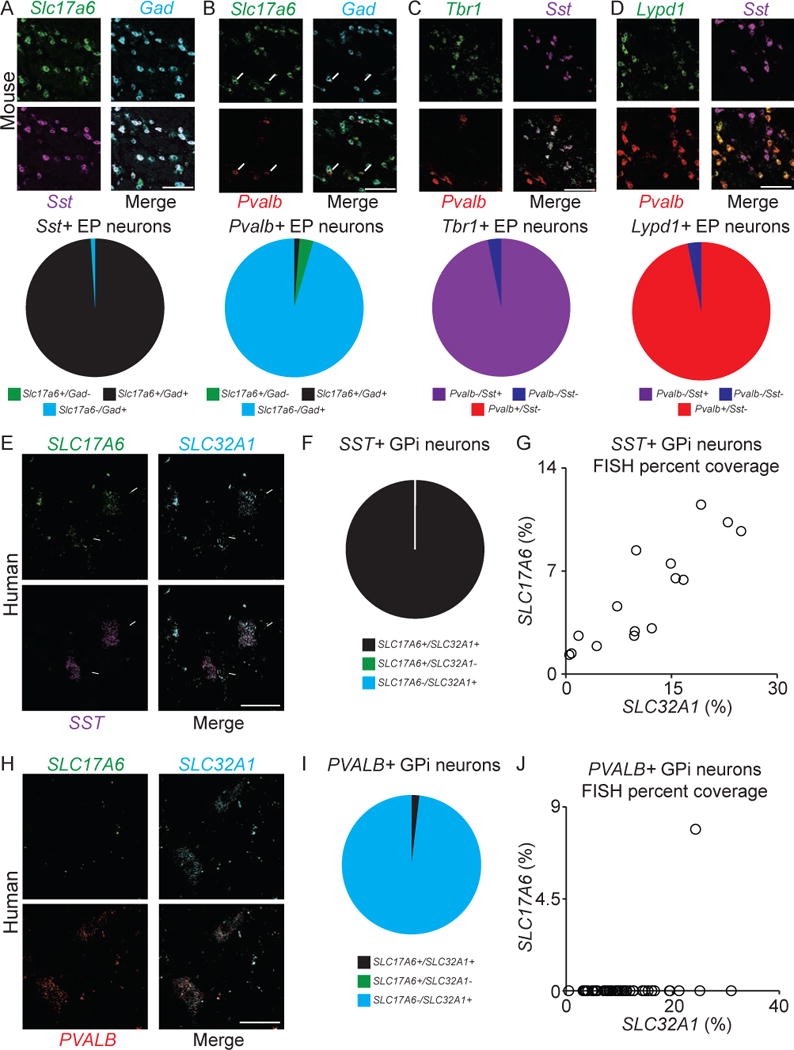
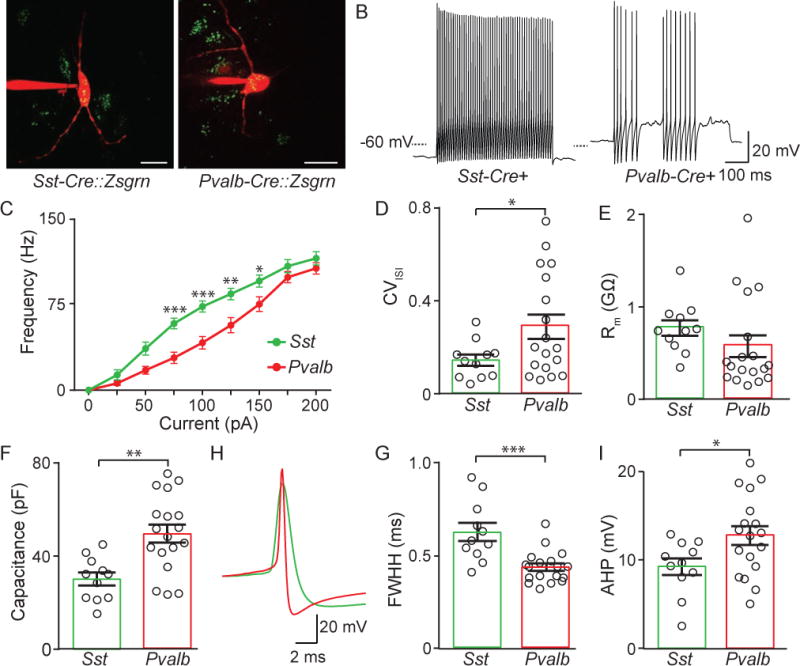
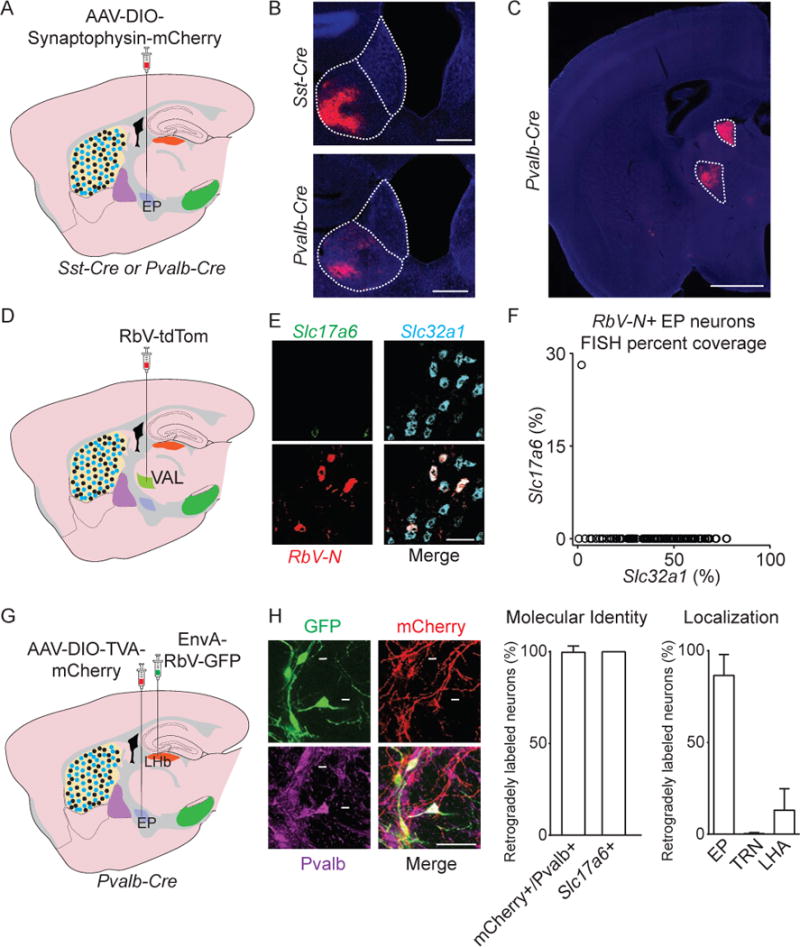
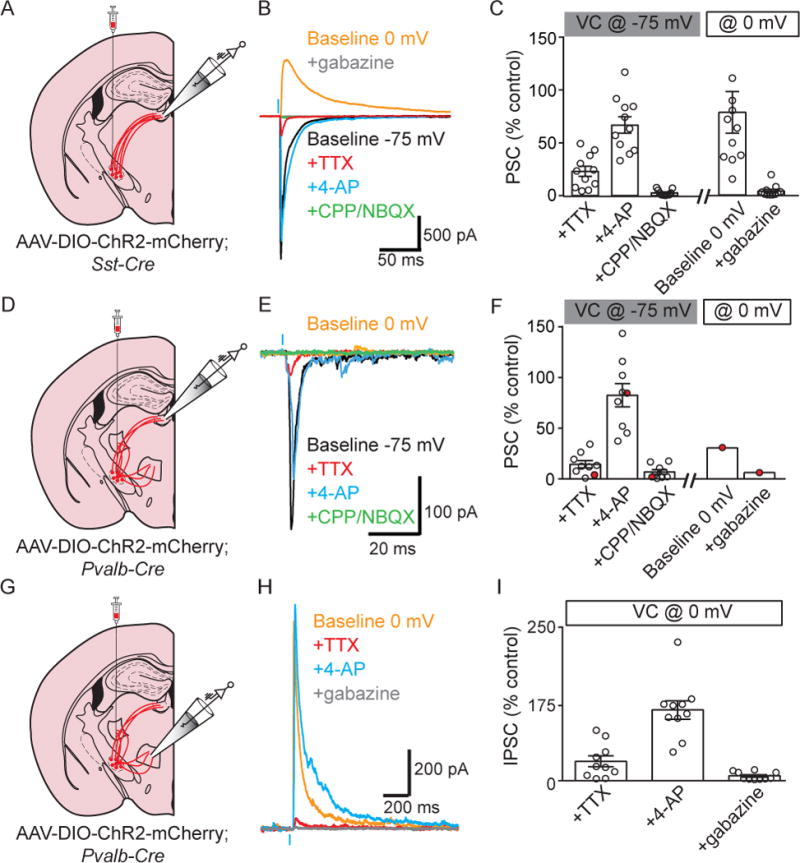
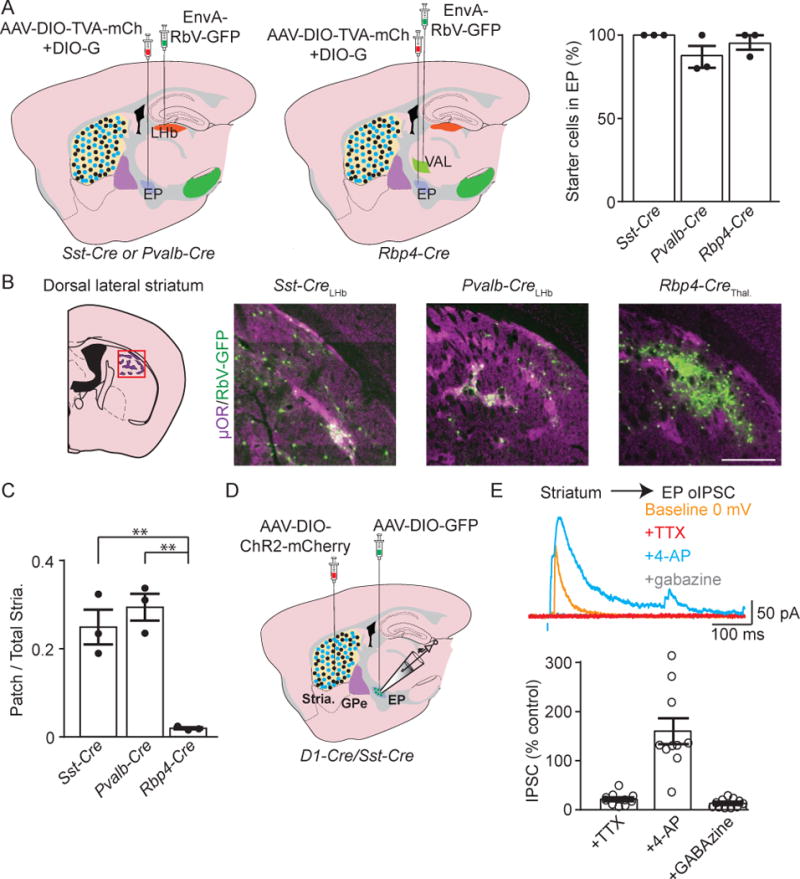
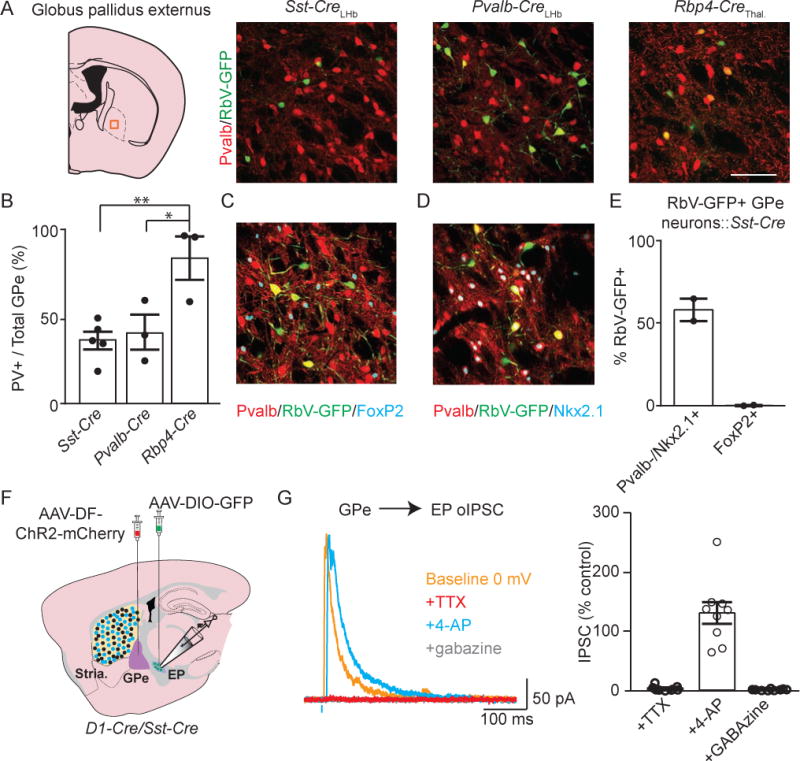
The basal ganglia (BG) integrate inputs from diverse sensorimotor, limbic, and associative regions to guide action-selection and goal-directed behaviors. The entopeduncular nucleus (EP) is a major BG output nucleus and has been suggested to channel signals from distinct BG nuclei to target regions involved in diverse functions. Here we use single-cell transcriptional and molecular analyses to demonstrate that the EP contains at least three classes of projection neurons-glutamate/GABA co-releasing somatostatin neurons, glutamatergic parvalbumin neurons, and GABAergic parvalbumin neurons. These classes comprise functionally and anatomically distinct output pathways that differentially affect EP target regions, such as the lateral habenula (LHb) and thalamus. Furthermore, LHb- and thalamic-projecting EP neurons are differentially innervated by subclasses of striatal and pallidal neurons. Therefore, we identify previously unknown subdivisions within the EP and reveal the existence of cascading, molecularly distinct projections through striatum and globus pallidus to EP targets within epithalamus and thalamus.

Keywords: basal ganglia; co-release; entopeduncular nucleus; lateral habenula; single cell sequencing.


Figures

Figure 1
Figure 1. Single cell RNA sequencing defines two neuronal populations in EP
A. A sagittal section of an Adora2A-Cre (A2A-Cre) mouse (which expresses Cre in striatopallidal neurons) injected in striatum with AAV-DIO-GFP (Cre-ON) (green) and AAV-FAS-tdTom (Cre-OFF) (magenta) and immunostained for Pvalb (red). Inset shows zoom of EP. B. A sagittal section of a Sst-cre::Zsgrn (green) mouse immunostained for Pvalb (red) depicting the Sst/Pvalb subdivisions of the EP (inset). C. Drop-seq workflow (modified from (Macosko et al., 2015)). Cells isolated from acute slices of EP and surrounding areas are encapsulated in droplets for bead-based mRNA capture and barcoding. Thousands of single cell transcriptomes are then sequenced and analyzed. D. TSNE plot displaying the results of clustering of the 1,615 neurons dissociated from acute microdissections. Each point represents 1 neuron and clusters are color-coded. Clusters intrinsic to EP (5 and 6) are circled in pink and blue. E. Of the 10 clusters of neurons, clusters 6 and 5 were confirmed to be from the EP (left) and show differential expression of Sst (middle) and Pvalb (right), red/yellow denotes high and low expression, respectively. See also Figure S1, S2 and S3.
Figure 2
Figure 2. Genes differentially expressed across EP clusters highlight novel markers and potential functional differences
A, B. Genes enriched in cluster 6 (A, blue) or cluster 5 (B, magenta) as compared to the whole population of neurons. Each bar represents the expression level of the indicated gene for a single EP neuron (total number of cells n = 166). The y-axis is log2 normalized expression level for each gene (maxima range from 2.5–5.34). Genes in red indicate genes that are also significantly different across clusters 5 vs 6. C. Genes not listed in panels A and B that are differentially expressed across clusters 5 and 6. Blue bars represent genes that are enriched in cluster 6 and magenta bars represent genes that are enriched in cluster 5. See also Figure S2.
Figure 3
Figure 3. Three neuronal classes in both mouse EP and human GPi
A. (Top) Sample image of a coronal section of EP probed for Sst (magenta), Slc17a6 (green), and Gad (mixed probes for Gad1 and Gad2; cyan). (Bottom) Quantification of colabeling of Sst with Slc17a6 and Gad in EP (n=959 cells, 3 mice). B. (Top) Sample image of a coronal section of EP probed for Pvalb (red), Slc17a6 (green), and Gad (cyan). Arrows indicate Pvalb+/Slc17a6+ cells, and arrowhead indicates a Pvalb+/Gad+ cell. (Bottom) Quantification of colabeling of Pvalb with Slc17a6 and Gad in EP (n=714 cells, 3 mice). C. (Top) Sample image of a coronal section of EP probed for Sst (magenta), Tbr1 (green), and Pvalb (red). (Bottom) Quantification of colabeling of Tbr1 with Sst and Pvalb in EP (n=223 cells, 3 mice). D. (Top) Sample image of a coronal section of EP probed for Sst (magenta), Lypd1 (green), and Pvalb (red). (Bottom) Quantification of colabeling of Lypd1 with Sst and Pvalb in EP (n=188 cells, 3 mice). E. Sample image of a coronal section of human GPi probed for SST (magenta), SLC17A6 (green), and SLC32A1 (cyan). Arrows indicate SST+/SLC17A6+/SLC32A1+ cells. F. Quantification of colabeling of SST with SLC17A6 and SLC32A1 in GPi (n=14 cells). G. Quantification of fluorescence coverage of SLC17A6 and SLC32A1 in SST+ GPi neurons. H. Sample image of a coronal section of human GPi probed for PVALB (red), SLC17A6 (green), and SLC32A1 (cyan). I. Quantification of colabeling of PVALB with SLC17A6 and SLC32A1 in GPi (n=56 cells). J. Quantification of fluorescence coverage of SLC17A6 and SLC32A1 in PVALB+ GPi neurons. See also Figure S3.
Figure 4
Figure 4. Differential electrophysiological properties of Sst+ and Pvalb+ expressing EP neurons
A. Images of Alexa Fluor-594 filled Zsgrn+ EP neurons in Sst-Cre and Pvalb-Cre mice crossed to Ai6 mouse. B. Sample current-clamp recordings of action potential firing to +100 pA square wave current injection in Sst-Cre and Pvalb-Cre mice. C. Action potential firing frequency vs current injection for neurons from Sst-Cre (green) (n=11 cells) and Pvalb-Cre (red) mice (n=18 cells). D. The coefficient of variation of the interspike interval (CVISI) (averaged from ISIs across all current injections). E, F. Membrane resistance (Rm) and capacitance across cell types. G, H, I. Sample current-clamp recording of an action potential (G) and full width at half height (FWHH) (G) and after-hyperpolarization (AHP) (I) measurements from Sst-Cre (green) and Pvalb-Cre (red) neurons. All data are represented as mean ± SEM, *=p<0.05, **=p<0.01, ***=p<0.001. See also Figure S4 and S5.
Figure 5
Figure 5. Sst+ EP neurons target LHb, and Pvalb+ neurons target LHb and motor thalamus
A. Illustration of a sagittal slice depicting AAV-DIO-Syn.-mCh. viral injection in EP in Sst-Cre or Pvalb-Cre mice. B, C. Sample coronal image of axonal labeling (red) in the LHb (B) or VAL and AD thalamus (C) following viral injection into EP in Sst-Cre or Pvalb-Cre mice (DAPI in blue). D. Illustration of a sagittal slice depicting RbV-tdTom viral injection in VAL. E. Sample image of a coronal section of EP probed for RbV-N (red), Slc17a6 (green), and Slc32a1 (cyan). F. Quantification of fluorescence coverage of Slc17a6 and Slc32a1 in RbV-N+ EP neurons (122 cells, n=3 animals). G. Illustration of a sagittal slice depicting AAV-DIO-TVA-mCh. viral injection in EP, and EnvA-RbV-GFP injection in LHb in a Pvalb-Cre mouse. H. (left) A sample image of a coronal section of EP showing RabV-GFP (green), mCh. (red), and Pvalb (magenta). (middle) Percentage of retrogradely labeled (GFP+) neurons that were also labeled for mCh. and Pvalb (169 cells, n=3 animals) or in separate FISH experiments Slc17a6 (25 cells, n=3 animals). (right) Quantification of soma location of GFP+ neurons following EnvA-RbV-GFP injection into LHb (186 cells, n=2 animals) (VAL=Ventral anterior lateral thalamus, AD=Anterior dorsal thalamus, LHA=Lateral hypothalamus, PF=Parafascicular nucleus of the thalamus, TRN=Thalamic reticular nucleus, MHb=medial habenula, V3=3rd ventricle). All data are represented as mean ± SEM. See also Figure S6.
Figure 6
Figure 6. Sst+ and Pvalb+ EP neurons that target the LHb release GABA/glutamate or glutamate, respectively, and a distinct Pvalb+ population targets VM/VAL and releases GABA
A. Illustration of a coronal slice depicting AAV-DIO-ChR2-mCh. viral injection into EP and recording location in LHb of a Sst-Cre mouse. B. Sample voltage-clamp recordings in LHb during optogenetic activation of Sst-Cre+ EP axons. The cell was clamped at −75mV to record glutamatergic currents (black) and 0 mV to record GABAergic currents (orange). C. Quantification of optogenetically-evoked PSC amplitude. TTX, 4-AP, CPP/NBQX and 0 mV baseline measurements are all normalized to the −75 mV pre-drug EPSC amplitude but the amplitude in “gabazine” is normalized to the 0 mV baseline IPSC (n=11). D. Illustration of a coronal slice depicting AAV-DIO-ChR2-mCh. viral injection into EP and recording location in LHb of a Pvalb-Cre mouse. E. Sample voltage-clamp recordings in LHb during optogenetic activation of Pvalb-Cre+ EP axons. The cell was clamped at −75mV to record glutamatergic currents (black) and 0 mV to record GABAergic currents (orange). F. Quantification of optogenetically-evoked PSC amplitude analyzed as in panel C (n=9, red point represents a neuron that displayed glutamatergic and GABAergic currents). G. Illustration of a coronal slice depicting AAV-DIO-ChR2-mCh. viral injection into EP and recording location in VM thalamus from a Pvalb-Cre mouse. H. Sample voltage-clamp recordings in VM thalamus during optogenetic activation of Pvalb- Cre+ EP axons. The cell was clamped at 0mV to record GABAergic currents (orange). I. Quantification of optogenetically-evoked IPSC amplitude. All measurements are all normalized to the 0 mV baseline IPSC amplitude (n=10). All data are represented as mean ± SEM. See also Figure S7.
Figure 7
Figure 7. LHb projecting EP neurons have patch biased striatal input
A. Illustration of sagittal slices depicting AAV-DIO-TVA-mCh. and AAV-DIO-G viral coinjection into EP. EnvA-RbV-GFP was injected into LHb of Sst-Cre or Pvalb-Cre mice (left), or into VAL thalamus in Rbp4-Cre mice (middle). Quantification of starter cell (mCh.+/GFP+) location (right) (Sst-Cre n=3, Pvalb-Cre n=3, Rbp4-Cre n=3 mice). B. Illustration of a coronal section of striatum. The red box indicates region shown in sample images to right. In sample images, GFP+ cells are presynaptic to the indicated EP subpopulation and μOR immunostain (magenta) marks the patch (striosome) compartment. C. Quantification of the proportion of retrogradely labeled striatal neurons that were within patches (Sst-Cre n=3, Pvalb-Cre n=3, Rbp4-Cre n=3 mice). D. Illustration of a sagittal slice depicting viral injection targets and location of whole-cell recording. An AAV-DIO-ChR2-mCh. (Cre-ON) viral injection in striatum and an AAV-DIO-GFP injection in EP was made in a D1-Cre/Sst-Cre mouse. E. top, Sample voltage-clamp recordings in an EP neuron during optogenetic activation of Drd1a-Cre+ striatal axons. The cell was clamped at 0 mV to record GABAergic IPSCs. bottom, Quantification of optogenetically-evoked IPSC amplitude. All measurements are normalized to the 0 mV baseline IPSC amplitude (n=10 cells). All data are represented as mean ± SEM *=p<0.05, **=p<0.01. See also Figure S6 and S8.
Figure 8
Figure 8. Pvalb negative GPe neurons innervate the LHb projecting EP
A. Illustration of a coronal section of GPe. The orange box indicates region shown in sample images to right. In sample images, GFP+ cells are presynaptic to different subpopulations of EP neurons and the Pvalb (red) marks the “prototypic” GPe neurons. B. Quantification of the proportion of retrogradely labeled GPe neurons that were Pvalb+ (Sst-Cre n=5, Pvalb-Cre n=3, Rbp4-Cre n=3 animals). C. Sample image of immunostaining in GPe for Pvalb (red) and FoxP2 (cyan), markers for prototypic and arkypallidal GPe neurons, respectively. GFP+ (green) are presynaptic to Sst+ EP neurons. D. Sample image of immunostaining in GPe for Pvalb (red) and Nkx2.1 (cyan). GFP+ (green) are presynaptic to Sst+ EP neurons. E. Proportions of retrogradely labeled GPe neurons that immunostained for each of the three markers shown in C and D (FoxP2+ (1/253 cells, n=2 animals), Pvalb-/Nkx2.1+ (117/218 cells, n=2 animals)). F. Illustration of a sagittal slice depicting viral injection targets and location of whole-cell recording. An AAV-DF-ChR2-mCh. (Cre-OFF) viral injection into GPe, and AAV-DIO-GFP injection in EP was made in a D1-Cre/Sst-Cre mouse. G. left, Sample voltage-clamp recordings in an EP neuron during optogenetic activation of GPe axons. The cell was clamped at 0 mV to record GABAergic currents. right, Quantification of optogenetically-evoked IPSC amplitude. All measurements are normalized to the 0 mV baseline IPSC amplitude (n=9 cells). All data are represented as mean ± SEM *=p<0.05, **=p<0.01. See also Figure S6 and S8.

Comment in

  • Seq-ing the Circuit Logic of the Basal Ganglia.
    Hernandez-Martinez R, Calakos N. Hernandez-Martinez R, et al. Trends Neurosci. 2017 Jun;40(6):325-327. doi: 10.1016/j.tins.2017.04.006. Epub 2017 May 10. Trends Neurosci. 2017. PMID: 28501393 Free PMC article.

References

    1. Abdi A, Mallet N, Mohamed FY, Sharott A, Dodson PD, Nakamura KC, Suri S, Avery SV, Larvin JT, Garas FN, et al. Prototypic and arkypallidal neurons in the dopamine-intact external globus pallidus. J Neurosci. 2015;35:6667–6688. - PMC - PubMed
    1. Ade KK, Wan Y, Chen M, Gloss B, Calakos N. An Improved BAC Transgenic Fluorescent Reporter Line for Sensitive and Specific Identification of Striatonigral Medium Spiny Neurons. Front Syst Neurosci. 2011;5:32. - PMC - PubMed
    1. Alexander GE, Crutcher MD. Functional architecture of basal ganglia circuits: neural substrates of parallel processing. Trends Neurosci. 1990;13:266–271. - PubMed
    1. Atasoy D, Aponte Y, Su HH, Sternson SM. A FLEX Switch Targets Channelrhodopsin-2 to Multiple Cell Types for Imaging and Long-Range Circuit Mapping. J Neurosci. 2008;28:7025–7030. - PMC - PubMed
    1. Barroso-Chinea P, Rico AJ, Pérez-Manso M, Roda E, López IP, Luis-Ravelo D, Lanciego JL. Glutamatergic pallidothalamic projections and their implications in the pathophysiology of Parkinson’s disease. Neurobiol Dis. 2008;31:422–432. - PubMed

MeSH terms