. 2017 Apr 5;94(1):93-107.e6.
doi: 10.1016/j.neuron.2017.03.023.

Mutant Huntingtin Disrupts the Nuclear Pore Complex

Affiliations

Mutant Huntingtin Disrupts the Nuclear Pore Complex

Jonathan C Grima et al. Neuron. .

Abstract

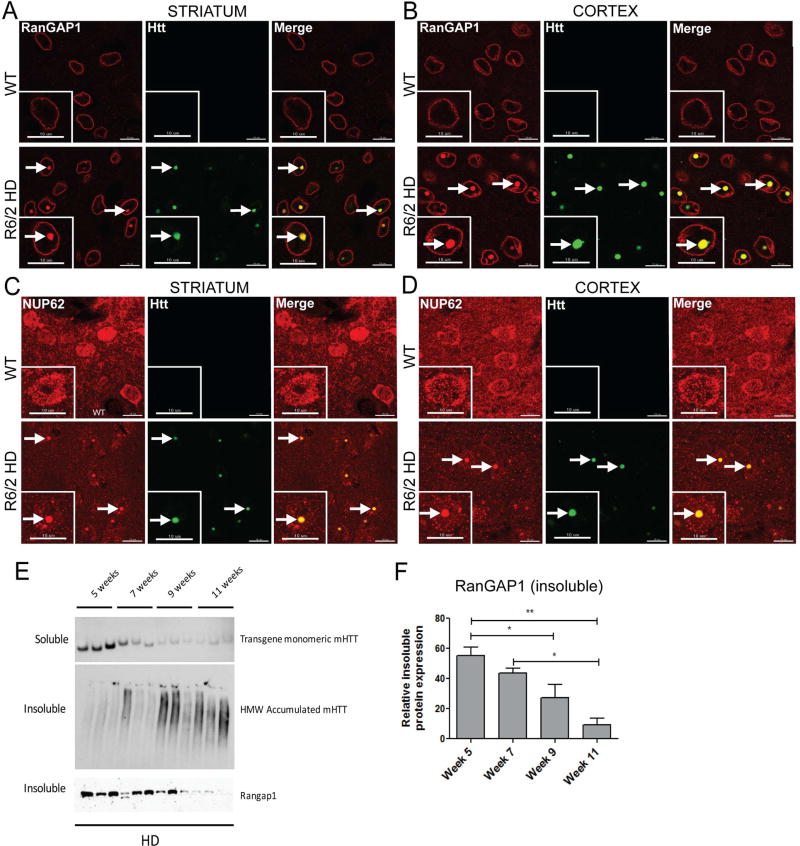
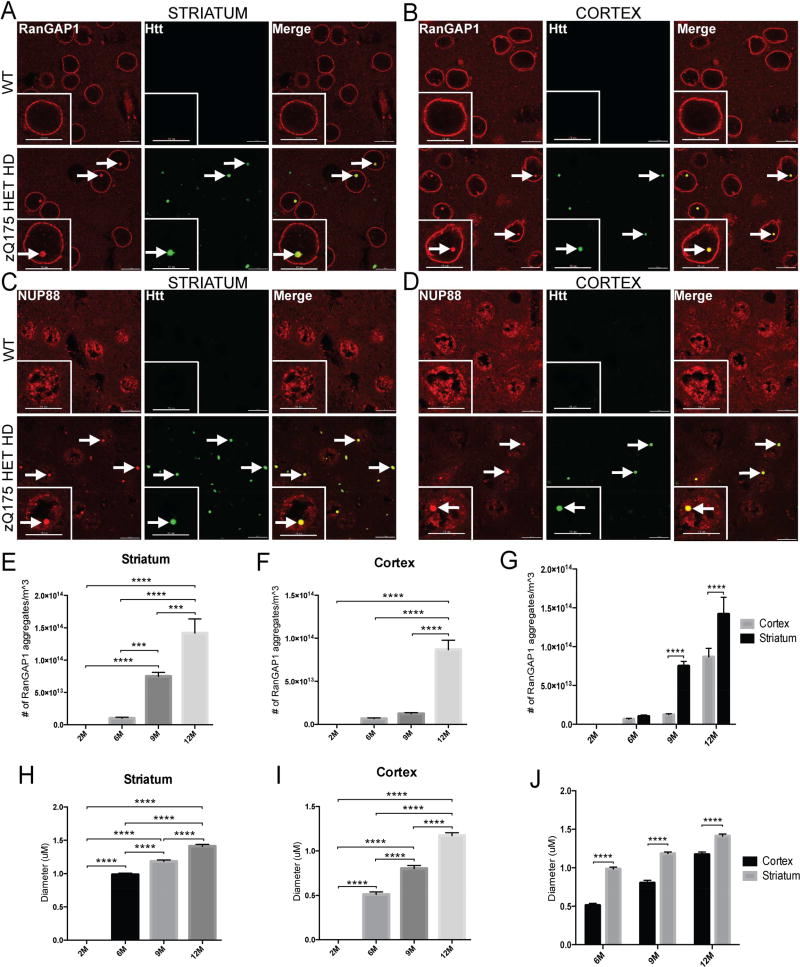
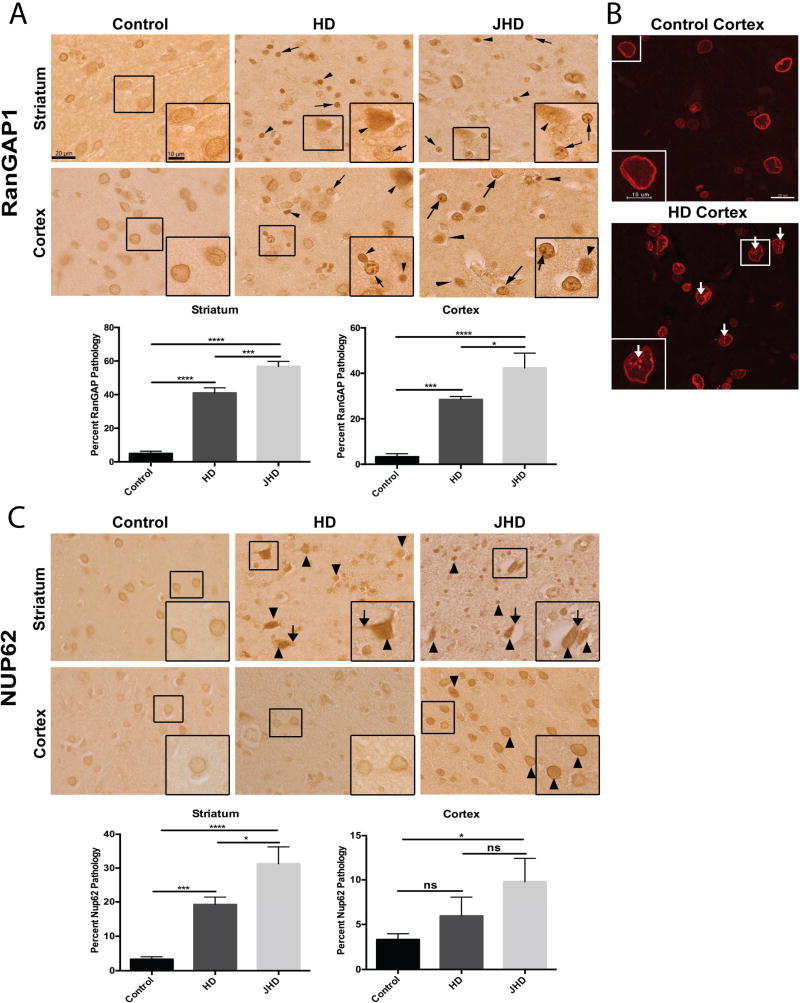
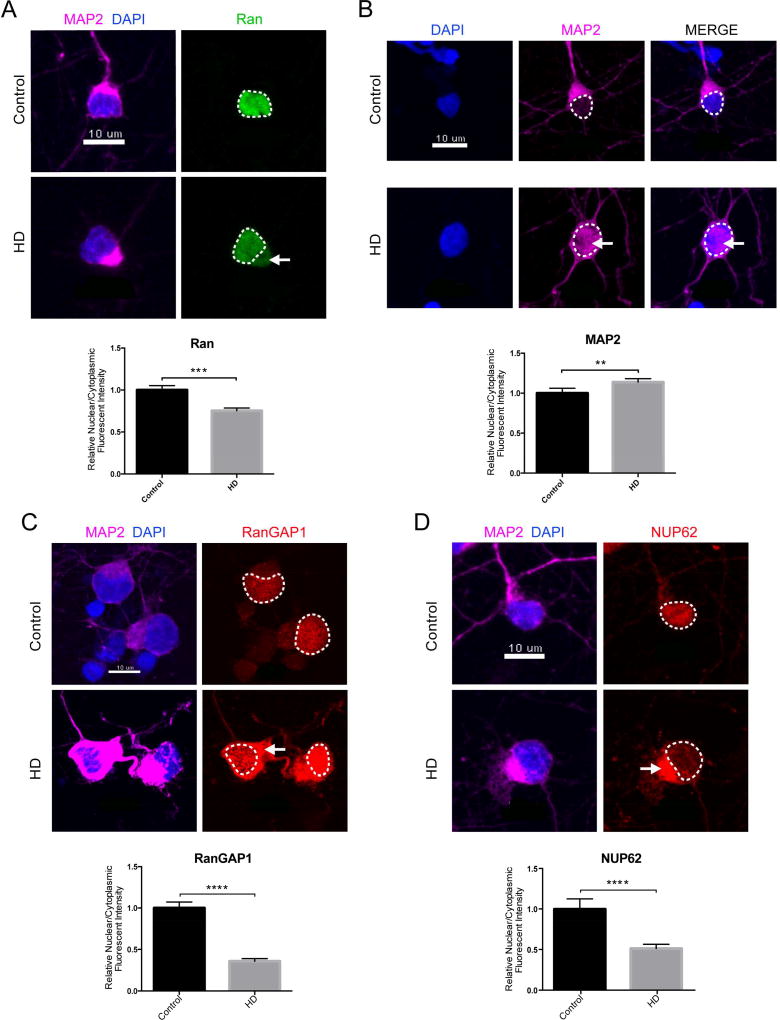
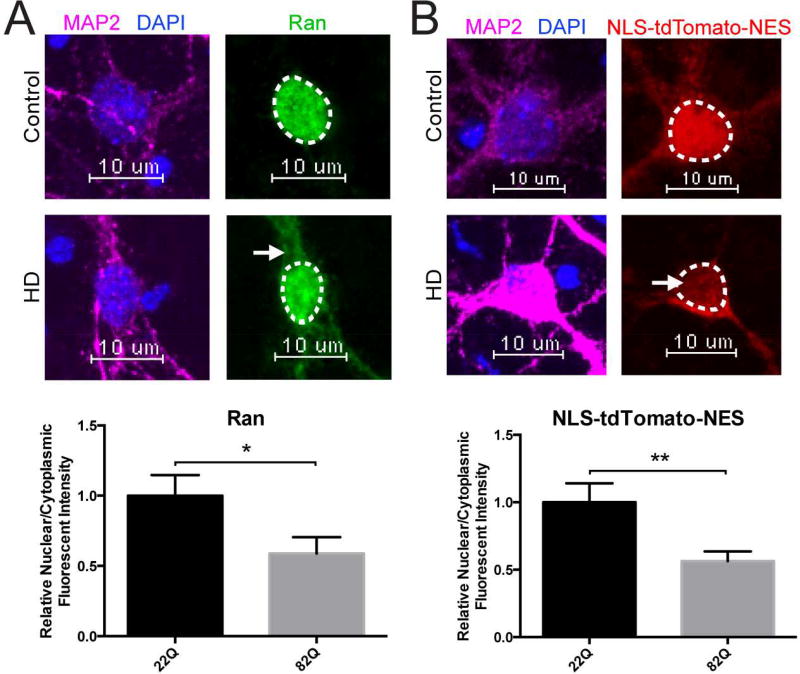
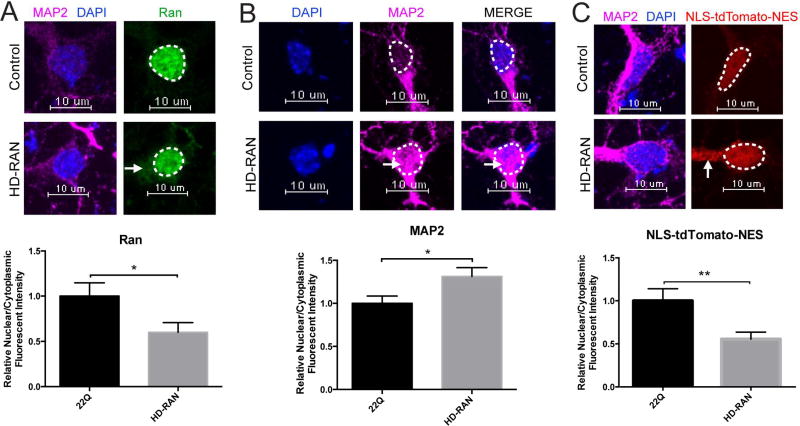
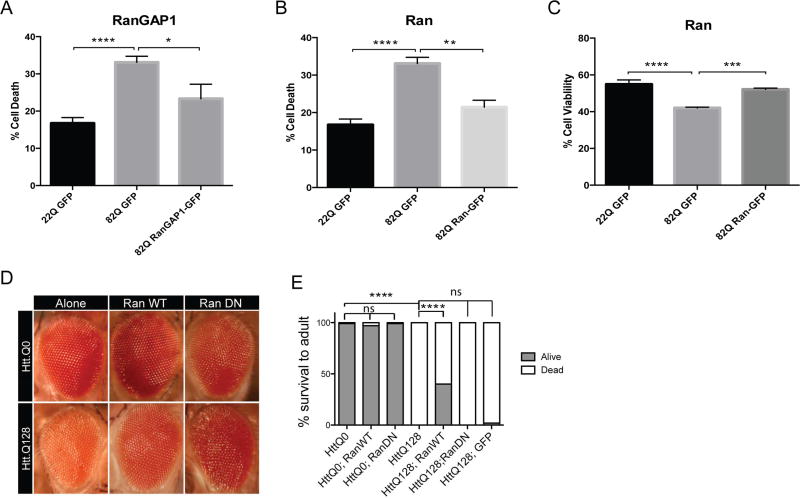
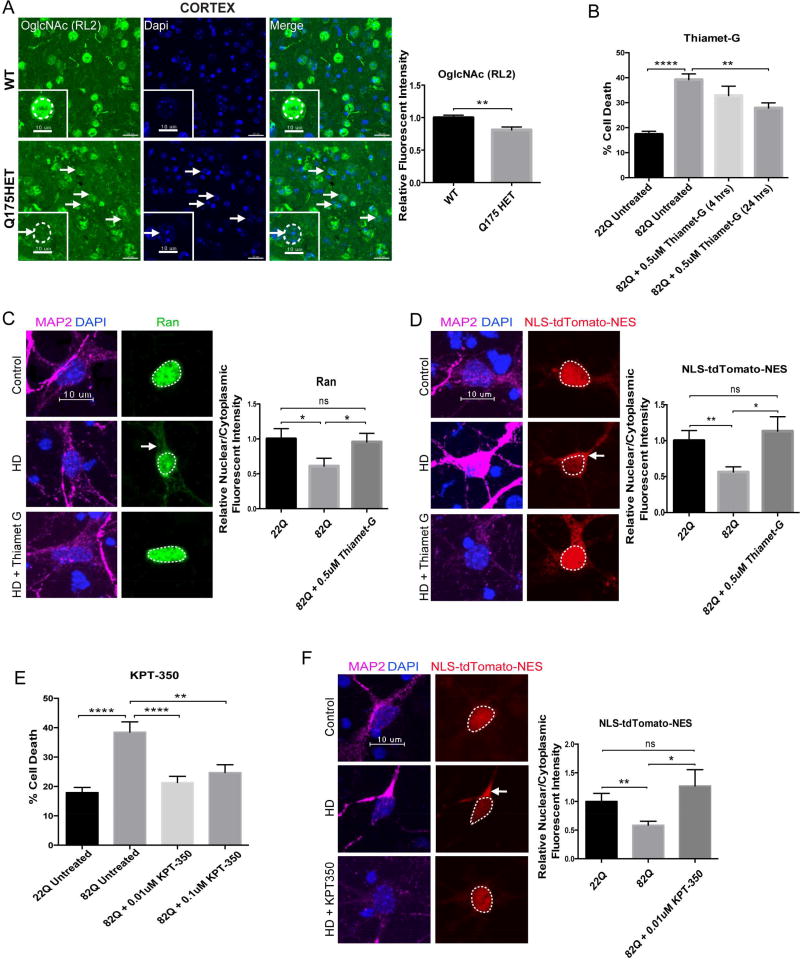
Huntington's disease (HD) is caused by an expanded CAG repeat in the Huntingtin (HTT) gene. The mechanism(s) by which mutant HTT (mHTT) causes disease is unclear. Nucleocytoplasmic transport, the trafficking of macromolecules between the nucleus and cytoplasm, is tightly regulated by nuclear pore complexes (NPCs) made up of nucleoporins (NUPs). Previous studies offered clues that mHTT may disrupt nucleocytoplasmic transport and a mutation of an NUP can cause HD-like pathology. Therefore, we evaluated the NPC and nucleocytoplasmic transport in multiple models of HD, including mouse and fly models, neurons transfected with mHTT, HD iPSC-derived neurons, and human HD brain regions. These studies revealed severe mislocalization and aggregation of NUPs and defective nucleocytoplasmic transport. HD repeat-associated non-ATG (RAN) translation proteins also disrupted nucleocytoplasmic transport. Additionally, overexpression of NUPs and treatment with drugs that prevent aberrant NUP biology also mitigated this transport defect and neurotoxicity, providing future novel therapy targets.

Keywords: C9ORF72; Huntington’s disease; KPT-350; O-GlcNAc; RAN translation; Thiamet-G; induced pluripotent stem cell; neurodegeneration; nuclear pore complex; nucleocytoplasmic transport.


Conflict of interest statement

None of the authors have competing financial interests.

Figures

Figure 1
Figure 1. Nucleoporins Aggregate and Colocalize with mHtt in the R6/2 Mouse Model of HD
(A,B) Coronal brain sections from 10 week old WT and TG R6/2 mice showing aggregates of RanGAP1 (red) that colocalize with EM48+ mHtt aggregates (green) in the striatum and cortex of TG R6/2 mice. n=5/group. (C,D) Coronal brain sections from WT and TG R6/2 mice showing aggregates of NUP62 (red) that colocalize with EM48+ mHtt aggregates (green) in the striatum and cortex of TG R6/2 mice. n=5/group. (E,F) Insoluble RanGAP1 levels decrease with disease progression in striatum of R6/2 mice. Insoluble RanGAP1 and soluble mHtt transgene levels are significantly reduced and insoluble HMW accumulated mHtt is increased in R6/2 mice from weeks 5 to 11. All data are expressed as western densitometry quantitation. Protein expression was validated for protein loading prior to antibody incubation using reversible protein stain and each samples’ corresponding soluble α-tubulin expression. Data represent mean ± SEM. *p < 0.05, **p < 0.01; One-way ANOVA followed by Bonferroni post-testing testing was applied. n = 3/time point. Scale bars, 10µm (A–D). See also Table S1, Figures S1 and S2.
Figure 2
Figure 2. Nucleoporins Aggregate and Colocalize with mHtt in the zQ175 Mouse Model of HD
(A,B) Coronal brain sections from 12 month old WT and HET zQ175 mice showing aggregates of RanGAP1 (red) that colocalize with EM48+ mHtt aggregates (green) in the striatum and cortex of HET zQ175 mice. (C,D) Coronal brain sections from 12 month old WT and HET zQ175 mice showing aggregates of NUP88 (red) that colocalize with EM48+ mHtt aggregates (green) in the striatum and cortex of HET zQ175 mice. (E,F,G) Quantification of number of RanGAP1 aggregates in the striatum and cortex of HET zQ175 mice at 2, 6, 9 and 12 months. (H,I,J) Quantification of diameter of RanGAP1 aggregates in the striatum and cortex of HET zQ175 mice at 2, 6, 9 and 12 months. Data (E–J) are presented as mean ± SEM. ***P<0.001 and ****P<0.0001 as analyzed by one-way ANOVA followed by Tukey’s post-hoc analysis. N = 3/age group. Scale bars, 10µm (A–D). See also Table S1, Figure S3.
Figure 3
Figure 3. Nucleoporin Pathology in Human HD and JHD Brain Tissue
(A) Immunohistochemical RanGAP1 staining in non-neurological disease control (n=10), HD (n=5) and JHD (n=5) striatum and frontal cortex showing aberrant nuclear aggregates (arrows) and intense nuclear mislocalization (arrowheads). Quantitation of percent of RanGAP1-positive cells with RanGAP1 pathology (nuclear aggregates or intense nuclear mislocalization) for each brain region shown on the right of the representative images. (B) Immunofluorescence RanGAP1 staining in non-neurological disease control and HD frontal cortex showing aberrant nuclear aggregates (arrows). (C) Immunohistochemical NUP62 staining in non-neurological disease control (n=10), HD (n=5), and JHD (n=5) striatum and frontal cortex showing intense cytoplasmic (arrows) and nuclear (arrowheads) mislocalization. Quantitation of percent of NUP62-positive cells with NUP62 pathology (intense nuclear and cytoplasmic mislocalization) for each brain region shown on the right of the representative images. Data are presented as mean ± SEM. *p < 0.05, ***P<0.001, and ****P<0.0001 as analyzed by one-way ANOVA followed by Tukey’s post-hoc analysis. Scale bars, 20µm (A–C); 10µm (A–C zoom inset). See also Table S2, Figure S4.
Figure 4
Figure 4. Nucleocytoplasmic Transport Defects in Human HD iPSC-Derived Neurons
(A) iPSC-derived neurons (iPSNs) from control and HD patients showing mislocalization of Ran (green) to the cytoplasm in HD iPSNs. Quantification of N/C Ran gradient in neurons from 1 control (110 neurons) and 2 HD (144 neurons) iPSN lines when normalized to control shown below representative image. N/C Ran ratio is reduced in HD neurons. Bar indicates mean N/C Ran. (B) iPSNs from control and HD patients showing leakage of MAP2 (magenta) to the nucleus in HD iPSNs. Quantification of N/C MAP2 gradient in neurons from 1 control (110 neurons) and 2 HD (296 neurons) iPSN lines when normalized to control shown below representative image. Bar indicates mean N/C MAP2. (C) iPSNs from control and HD patients showing mislocalization of RanGAP1 (red) to the cytoplasm in HD iPSNs. Quantification of N/C RanGAP1 gradient in neurons from 1 control (30 neurons) and 2 HD (110 neurons) iPSN lines when normalized to control shown below representative image. Bar indicates mean N/C RanGAP1. (D) iPSNs from control and HD patients showing mislocalization of NUP62 (red) to the cytoplasm in HD iPSNs. Quantification of N/C NUP62 gradient in neurons from 1 control (100 neurons) and 2 HD (186 neurons) iPSN lines when normalized to control shown below representative image. Bar indicates mean N/C NUP62. Data are presented as mean ± SEM. Each independent experiment represents the average of 6 wells total per condition per line repeated over three separate differentiations. **P<0.01, ***P<0.001, ****P<0.0001 as analyzed by unpaired Students t test with Welch’s correction. Scale bars, 10µm (A–D). See also Table S3.
Figure 5
Figure 5. Nucleocytoplasmic Transport Defects in Primary Neurons Transfected with Full-Length mHTT
(A) Primary cortical neurons transfected at DIV5 with HTT 22Q (control) or HTT 82Q showing mislocalization of Ran (green) to the cytoplasm in primary cortical neurons transfected with HTT 82Q. Quantification of N/C Ran gradient in neurons transfected with 22Q (25 neurons) and 82Q (23 neurons) when normalized to control shown below representative image. Bar indicates mean N/C Ran. Experiment represents the average of 3 wells. (B) Primary cortical neurons cotransfected at DIV5 with HTT 22Q (control) or HTT 82Q (HD) and NLS-tdTomato-NES showing mislocalization of NLS-tdTomato-NES (red) to the cytoplasm in primary cortical neurons transfected with HTT 82Q. Quantification of N/C NLS-tdTomato-NES gradient in neurons transfected with 22Q (48 neurons) and 82Q (54 neurons) when normalized to control shown below representative image. N/C NLS-tdTomato-NES is reduced in primary cortical neurons transfected with 82Q. Bar indicates mean N/C NLS-tdTomato-NES. Experiment represents average of 9 wells. Data (A–B) are presented as mean ± SEM. *p < 0.05 and **P<0.01 as analyzed by unpaired Students t test with Welch’s correction. Scale bars, 10µm (A–B).
Figure 6
Figure 6. HD-RAN Proteins Disrupt Nucleocytoplasmic Transport
(A) Primary cortical neurons transfected at DIV5 with HTT 22Q (control) or 6×Stop-(CAG)80 (HD-RAN) showing mislocalization of Ran (green) to the cytoplasm in primary cortical neurons transfected with 6×Stop-(CAG)80. Quantification of N/C Ran gradient in neurons transfected with 22Q (25 neurons) and 6×Stop-(CAG)80 (27 neurons) when normalized to control shown below representative image. Bar indicates mean N/C Ran. Experiment represents average of 2 wells. (B) Primary cortical neurons transfected at DIV5 with HTT 22Q (control) or 6×Stop-(CAG)80 (HD-RAN) showing leakage of MAP2 (magenta) to the nucleus in primary cortical neurons transfected with 6×Stop-(CAG)80. Quantification of N/C MAP2 gradient in neurons transfected with 22Q (50 neurons) and 6×Stop-(CAG)80 (54 neurons) when normalized to control shown below representative image. Bar indicates mean N/C MAP2. Experiment represents average of 6 wells. (C) Primary cortical neurons cotransfected at DIV5 with HTT 22Q (control) or 6×Stop-(CAG)80 (HD-RAN) and NLS-tdTomato-NES showing mislocalization of NLS-tdTomato- NES (red) to the cytoplasm in primary cortical neurons transfected with 6×Stop-(CAG)80. Quantification of N/C NLS-tdTomato-NES gradient in neurons transfected with 22Q (48 neurons) and 6×Stop-(CAG)80 (51 neurons) when normalized to control shown below representative image. Bar indicates mean N/C NLS-tdTomato-NES. Experiment represents average of 6 wells. Data (A–C) are presented as mean ± SEM. *p < 0.05 and **P<0.01 as analyzed by unpaired Student’s t test with Welch’s correction. Scale bars, 10µm (A–C). See also Figure S5.
Figure 7
Figure 7. Overexpression of Ran and RanGAP1 are Neuroprotective in HD
(A,B) Overexpression of HTT 82Q and eGFP in primary cortical neurons causes significant cell death compared to neurons transfected with HTT 23Q and eGFP, and cell death is significantly reduced when overexpressing RanGAP1-GFP or Ran-GFP. Experiment represents the average of 4 wells per condition. (C) Overexpression of HTT 82Q and eGFP in primary cortical neurons causes a significant reduction in cell viability compared to neurons transfected with HTT 23Q and eGFP, and is rescued when overexpressing Ran-GFP. Experiment represents the average of 4 wells total per condition over the course of two separate experiments. Data (A–C) are presented as mean ± SEM. *P<0.05, **P<0.01, ***P<0.001, and ****P<0.0001 as analyzed by One-way ANOVA followed by Tukey’s post-hoc analysis. (D) Overexpression in the Drosophila eye of HTT.Q0 or HTT.Q128 using GMR-Gal4. Co-expressing wildtype (WT) Ran rescues this disorganization, whereas co-expression of a dominant negative (DN) Ran allele enhances this disorganization phenotype. (E) Overexpression of HTT.Q128 in motor neurons using OK371-Gal4 causes lethality at the pupal stage (Fisher’s exact test, p <.0001), whereas overexpression of HTT.Q0 has no phenotype alone or with Ran alleles. Co-expression of RanWT is sufficient to partially rescue the lethality caused by HTT.Q128 expression (Fisher’s exact test, p <.0001), whereas co-expression of RanDN or GFP alone was not sufficient to rescue.
Figure 8
Figure 8. Pharmacological Rescue of Nucleocytoplasmic Transport Defects and Neurotoxicity in HD
(A) Coronal brain sections from WT and HET zQ175 mice showing decreased relative nuclear fluorescent intensity of O-GlcNAc (RL2) in the cortex of 12M HET zQ175 mice. Quantification of relative nuclear fluorescent intensity of O-GlcNAc (RL2) in cortical cells from 3 WT (150 neurons; 50 neurons each) and 3 zQ175 HET (150 neurons; 50 neurons each) when normalized to WT shown next to representative image. Bar indicates mean nuclear O-GlcNAc (RL2). Data is presented as mean ± SEM. **P<0.01 as analyzed by unpaired Student’s t test with Welch’s correction. (B) Overexpression of HTT 82Q and eGFP in primary cortical neurons causes significant cell death compared to neurons transfected with HTT 23Q and eGFP, and cell death is significantly reduced when treating cells with 0.5uM Thiamet-G for 24 hours beginning 24 hours after transfection. Experiment represents the average of 4 wells. (C) Overexpression of HTT 82Q and eGFP in primary cortical neurons causes significant mislocalization of Ran (green) to the cytoplasm, which is rescued back to control levels upon treatment with 0.5uM Thiamet-G for 4 hours beginning 44 hours after transfection. Quantification of N/C Ran gradient in neurons transfected with 22Q (25 neurons), 82Q (23 neurons), and 82Q + Thiamet G (30 neurons) when normalized to control shown next to representative image. Bar indicates mean N/C Ran. Experiment represents the average of 3 wells. (D) Overexpression of HTT 82Q and eGFP in primary cortical neurons causes significant mislocalization of exogenous NLS-tdTomato-NES (red) to the cytoplasm, which is rescued back to control levels upon treatment with 0.5uM Thiamet-G for 4 hours beginning 44 hours after transfection. Quantification of N/C NLS-tdTomato-NES gradient in neurons transfected with 22Q (48 neurons), 82Q (54 neurons), and 82Q + Thiamet G (32 neurons) when normalized to control shown next to representative image. Bar indicates mean N/C NLS-tdTomato-NES. Experiment represents average of 9 wells. (E) Overexpression of HTT 82Q and eGFP in primary cortical neurons causes significant cell death compared to neurons transfected with HTT 23Q and eGFP, and cell death is significantly reduced when treating cells with either 0.01uM or 0.1uM KPT-350 at the time of transfection for 48 hours. Experiment represents the average of 4 wells per condition. (F) Overexpression of HTT 82Q and eGFP in primary cortical neurons causes significant mislocalization of endogenous NLS-tdTomato-NES (red) to the cytoplasm, which is rescued back to control levels upon treatment with 0.01uM KPT-350 at the time of transfection for 48 hours. Quantification of N/C NLS-tdTomato-NES gradient in neurons transfected with 22Q (48 neurons), 82Q (54 neurons), and 82Q + KPT-350 (20 neurons) when normalized to control shown next to representative image. Bar indicates mean N/C NLS-tdTomato-NES. Experiment represents average of 3 wells. Data (B–F) are presented as mean ± SEM. *P<0.05, **P<0.01, and ****P<0.0001 as analyzed by one-way ANOVA followed by Tukey’s post-hoc analysis. Scale bars, 20µm (A); 10µm (A zoom inset, C, D, F). See also Figure S6.

References

    1. Bañez-Coronel M, Ayhan F, Tarabochia Alex D, Zu T, Perez Barbara A, Tusi Solaleh K, Pletnikova O, Borchelt David R, Ross Christopher A, Margolis Russell L, et al. RAN Translation in Huntington Disease. Neuron. 2015;88:667–677. - PMC - PubMed
    1. Basel-Vanagaite L, Muncher L, Straussberg R, Pasmanik-Chor M, Yahav M, Rainshtein L, Walsh CA, Magal N, Taub E, Drasinover V, et al. Mutated nup62 causes autosomal recessive infantile bilateral striatal necrosis. Ann Neurol. 2006;60:214–222. - PubMed
    1. Bond MR, Hanover JA. A little sugar goes a long way: the cell biology of O-GlcNAc 2015 - PMC - PubMed
    1. Borghgraef P, Menuet C, Theunis C, Louis JV, Devijver H, Maurin H, Smet-Nocca C, Lippens G, Hilaire G, Gijsen H, et al. Increasing brain protein O-GlcNAc-ylation mitigates breathing defects and mortality of Tau.P301L mice 2013 - PMC - PubMed
    1. Brettschneider J, Tredici KD, Lee VM-Y, Trojanowski JQ. Spreading of pathology in neurodegenerative diseases: a focus on human studies. Nature reviews Neuroscience. 2015;16:109–120. - PMC - PubMed