. 2017 Apr 1;22(4):45003.
doi: 10.1117/1.JBO.22.4.045003.

Mapping breast cancer blood flow index, composition, and metabolism in a human subject using combined diffuse optical spectroscopic imaging and diffuse correlation spectroscopy

Affiliations

Mapping breast cancer blood flow index, composition, and metabolism in a human subject using combined diffuse optical spectroscopic imaging and diffuse correlation spectroscopy

Hossein S Yazdi et al. J Biomed Opt. .

Abstract

Diffuse optical spectroscopic imaging (DOSI) and diffuse correlation spectroscopy (DCS) are model-based near-infrared (NIR) methods that measure tissue optical properties (broadband absorption, ? a , and reduced scattering, ? s ? ) and blood flow (blood flow index, BFI), respectively. DOSI-derived ? a values are used to determine composition by calculating the tissue concentration of oxy- and deoxyhemoglobin ( HbO 2 , HbR), water, and lipid. We developed and evaluated a combined, coregistered DOSI/DCS handheld probe for mapping and imaging these parameters. We show that uncertainties of 0.3 ?? mm ? 1 (37%) in ? s ? and 0.003 ?? mm ? 1 (33%) in ? a lead to ? 53 % and 9% errors in BFI, respectively. DOSI/DCS imaging of a solid tissue-simulating flow phantom and


Figures

Fig. 1
Fig. 1
(a) The semi-infinite measurement geometry for DCS including a positive isotropic light sources and a negative isotropic light (imaging) source for DCS theory; see Sec. 2.1 and Ref.  for details. (b) Block diagram of the DOSI/DCS instrument, red color represents the multimode source fibers. Collection fiber bundle is shown by black, which contains a DOSI spectrometer fiber and two DCS single mode fibers (shown with yellow), and orange is an RF cable. (c) Photograph of the entire system on a portable cart and (d) diagram and photograph of handheld probe.
Fig. 2
Fig. 2
DCS characterization. (a) Measured intensity autocorrelation functions g2, during liquid phantom depth/flow experiment for flow tube 5 mm below the surface. (b) The relative change of blood flow, rBF, versus pump flow rates, for various flow tube depths. Depth is the distance between the top of the flow tube and the handheld probe. Data are the average of 10 samples, and error bars indicate standard deviation. The DOS-measured optical properties of the liquid phantom were μs=0.75  mm1 and μa=0.005  mm1 at 785 nm.
Fig. 3
Fig. 3
Effect of absorption and scattering on BFI. BFI calculated with DOSI-corrected and constant optical properties are shown for (a) constant scattering and varied absorption and (b) constant absorption and varied scattering. The flow rate was constant during the measurements.
Fig. 4
Fig. 4
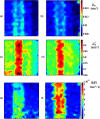
DOSI and DCS images of silicone phantom with an embedded flow channel. (a, b) Absorption coefficient μa, (c, d) reduced scattering coefficient μs, and (e, f) BFI. Images on left represent no flow (a, c, and e), where the images on the right represent, flow (b, d, and f). Tick mark separation equals 5 mm.
Fig. 5
Fig. 5
Integrated DOSI and DCS imaging during the clinical measurement of a breast cancer patient (a) μs and (b) μa mm1 at 785 nm, (c) BFI (mm2/s) reconstructed with μs and μa values measured by DOSI at 785 nm in each, (d) BFI (mm2/s) calculated with constant μs and μa values (0.8 and 0.005  mm1, respectively). Dashed lines (a and b) represent the region where the lesion was located and DOSI/DCS data were taken. The areola region is outlined with a semicircle. Tick marks represent 10 mm separations.
Fig. 6
Fig. 6
Integrated DOSI and DCS imaging during the clinical measurement of a breast cancer patient. (a) HbO2 (μM), (b) HbR (μM), (c) water (%), (d) lipid (%), (e) tissue optical index (TOI=[HbR]×[water]/[lipid]), (f) rMMRO2 (T/N), and (g) BFI (mm2/s). Dashed lines (a–e) represent the region where the lesion was located and DOSI/DCS data were taken. The areola region is outlined with a semicircle. (f and g) The region that DOSI/DCS data were collected. Tick marks represent 10 mm separations.

References

    1. Yodh A., Chance B., “Spectroscopy and imaging with diffusing light,” Phys. Today 48(3), 34–40 (1995).PHTOAD10.1063/1.881445 - DOI
    1. Leproux A., et al. , “Assessing tumor contrast in radiographically dense breast tissue using diffuse optical spectroscopic imaging (DOSI),” Breast Cancer Res. 15(5), R89 (2013).BCTRD610.1186/bcr3485 - DOI - PMC - PubMed
    1. Kukreti S., et al. , “Characterization of metabolic differences between benign and malignant tumors: high-spectral-resolution diffuse optical spectroscopy,” Radiology 254(1), 277–284 (2010).RADLAX10.1148/radiol.09082134 - DOI - PMC - PubMed
    1. Cerussi A. E., et al. , “Frequent optical imaging during breast cancer neoadjuvant chemotherapy reveals dynamic tumor physiology in an individual patient,” Acad. Radiol. 17(8), 1031–1039 (2010).10.1016/j.acra.2010.05.002 - DOI - PMC - PubMed
    1. Roblyer D., et al. , “Optical imaging of breast cancer oxyhemoglobin flare correlates with neoadjuvant chemotherapy response one day after starting treatment,” Proc. Natl. Acad. Sci. U. S. A. 108(35), 14626 (2011).10.1073/pnas.1013103108 - DOI - PMC - PubMed