Cardiometabolic Abnormalities Among Normal-Weight Persons From Five Racial/Ethnic Groups in the United States: A Cross-sectional Analysis of Two Cohort Studies
- PMID: 28384781
- PMCID: PMC5545925
- DOI: 10.7326/M16-1895
Cardiometabolic Abnormalities Among Normal-Weight Persons From Five Racial/Ethnic Groups in the United States: A Cross-sectional Analysis of Two Cohort Studies
Abstract
Background: The relationship between body weight and cardiometabolic disease may vary substantially by race/ethnicity.
Objective: To determine the prevalence and correlates of the phenotype of metabolic abnormality but normal weight (MAN) for 5 racial/ethnic groups.
Design: Cross-sectional analysis.
Setting: 2 community-based cohorts.
Participants: 2622 white, 803 Chinese American, 1893 African American, and 1496 Hispanic persons from MESA (Multi-Ethnic Study of Atherosclerosis) and 803 South Asian participants in the MASALA (Mediators of Atherosclerosis in South Asians Living in America) study.
Measurements: Prevalence of 2 or more cardiometabolic abnormalities (high fasting glucose, low high-density lipoprotein cholesterol, and high triglyceride levels and hypertension) among normal-weight participants was estimated. Correlates of MAN were assessed by using log-binomial models.
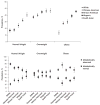
Results: Among normal-weight participants (n = 846 whites, 323 Chinese Americans, 334 African Americans, 252 Hispanics, and 195 South Asians), the prevalence of MAN was 21.0% (95% CI, 18.4% to 23.9%) in whites, 32.2% (CI, 27.3% to 37.4%) in Chinese Americans, 31.1% (CI, 26.3% to 36.3%) in African Americans, 38.5% (CI, 32.6% to 44.6%) in Hispanics, and 43.6% (CI, 36.8% to 50.6%) in South Asians. Adjustment for demographic, behavioral, and ectopic body fat measures did not explain racial/ethnic differences. After adjustment for age, sex, and race/ethnicity-body mass index (BMI) interaction, for the equivalent MAN prevalence at a BMI of 25.0 kg/m2 in whites, the corresponding BMI values were 22.9 kg/m2 (CI, 19.5 to 26.3 kg/m2) in African Americans, 21.5 kg/m2 (CI, 18.5 to 24.5 kg/m2) in Hispanics, 20.9 kg/m2 (CI, 19.7 to 22.1 kg/m2) in Chinese Americans, and 19.6 kg/m2 (CI, 17.2 to 22.0 kg/m2) in South Asians.
Limitation: Cross-sectional study design and lack of harmonized dietary data between studies.
Conclusion: Compared with whites, all racial/ethnic minority groups had a statistically significantly higher prevalence of MAN, which was not explained by demographic, behavioral, or ectopic fat measures. Using a BMI criterion for overweight to screen for cardiometabolic risk may result in a large proportion of racial/ethnic minority groups being overlooked.
Primary funding source: National Institutes of Health.
Figures


References
-
- Lastra G, Manrique C, Sowers JR. Obesity, cardiometabolic syndrome, and chronic kidney disease: the weight of the evidence. Adv Chronic Kidney Dis. 2006;13:365–73. - PubMed
-
- Wildman RP, Muntner P, Reynolds K, McGinn AP, Rajpathak S, Wylie-Rosett J, et al. The obese without cardiometabolic risk factor clustering and the normal weight with cardiometabolic risk factor clustering: prevalence and correlates of 2 phenotypes among the US population (NHANES 1999–2004) Arch Intern Med. 2008;168:1617–24. doi: 10.1001/archinte.168.15.1617. - DOI - PubMed
-
- St-Onge MP, Janssen I, Heymsfield SB. Metabolic syndrome in normal-weight Americans: new definition of the metabolically obese, normal-weight individual. Diabetes Care. 2004;27:2222–8. - PubMed
MeSH terms
Grants and funding
- HHSN268201500003C/HL/NHLBI NIH HHS/United States
- N01 HC095161/HL/NHLBI NIH HHS/United States
- N01 HC095167/HC/NHLBI NIH HHS/United States
- N01 HC095161/HC/NHLBI NIH HHS/United States
- N01 HC095164/HC/NHLBI NIH HHS/United States
- N01 HC095167/HL/NHLBI NIH HHS/United States
- N01 HC095159/HL/NHLBI NIH HHS/United States
- K24 HL112827/HL/NHLBI NIH HHS/United States
- P30 DK098722/DK/NIDDK NIH HHS/United States
- N01 HC095163/HL/NHLBI NIH HHS/United States
- N01 HC095168/HC/NHLBI NIH HHS/United States
- UL1 TR000040/TR/NCATS NIH HHS/United States
- N01 HC095162/HL/NHLBI NIH HHS/United States
- P30 DK111024/DK/NIDDK NIH HHS/United States
- N01 HC095168/HL/NHLBI NIH HHS/United States
- R01 HL093009/HL/NHLBI NIH HHS/United States
- UL1 TR001079/TR/NCATS NIH HHS/United States
- N01 HC095169/HL/NHLBI NIH HHS/United States
- UL1 RR024131/RR/NCRR NIH HHS/United States
- N01 HC095160/HC/NHLBI NIH HHS/United States
- P30 DK092924/DK/NIDDK NIH HHS/United States
- N01 HC095165/HC/NHLBI NIH HHS/United States
- HHSN268201500003I/HL/NHLBI NIH HHS/United States
- N01 HC095166/HL/NHLBI NIH HHS/United States
- N01 HC095163/HC/NHLBI NIH HHS/United States
- N01 HC095162/HC/NHLBI NIH HHS/United States
- N01 HC095165/HL/NHLBI NIH HHS/United States
- N01 HC095164/HL/NHLBI NIH HHS/United States
- N01 HC095159/HC/NHLBI NIH HHS/United States
- N01 HC095160/HL/NHLBI NIH HHS/United States
LinkOut - more resources
Full Text Sources
Other Literature Sources
Medical
