

Neuroligin 3 R451C mutation alters electroencephalography spectral activity in an animal model of autism spectrum disorders
- PMID: 28385162
- PMCID: PMC5384041
- DOI: 10.1186/s13041-017-0290-2
Neuroligin 3 R451C mutation alters electroencephalography spectral activity in an animal model of autism spectrum disorders
Abstract
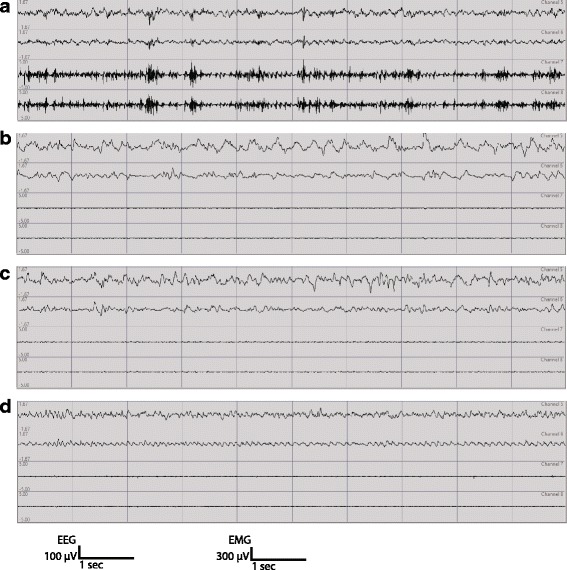
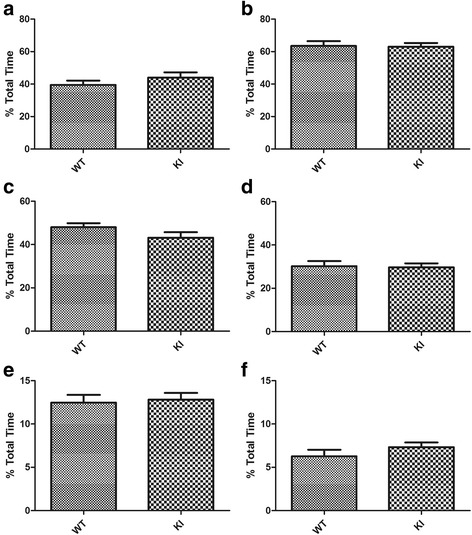
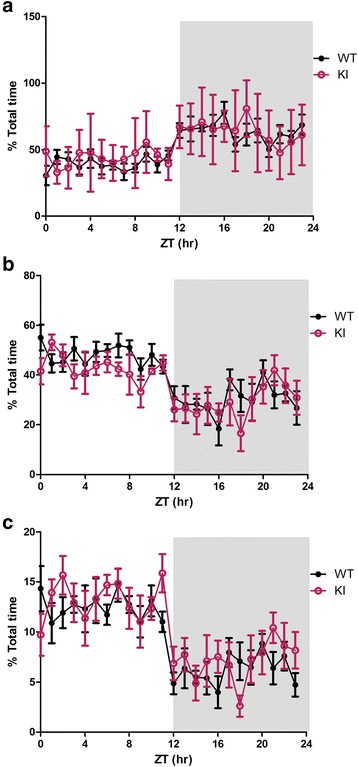
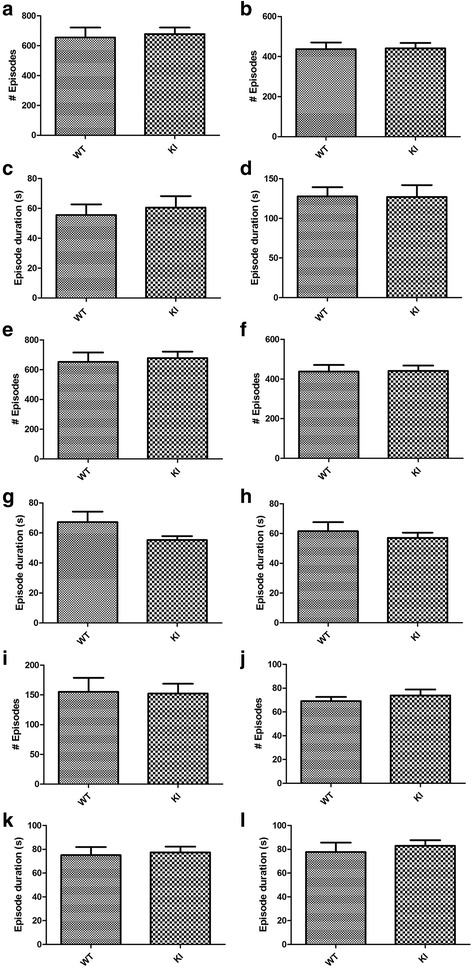
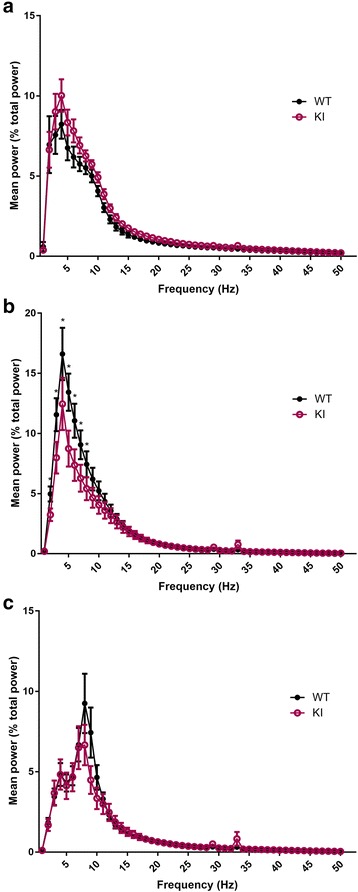
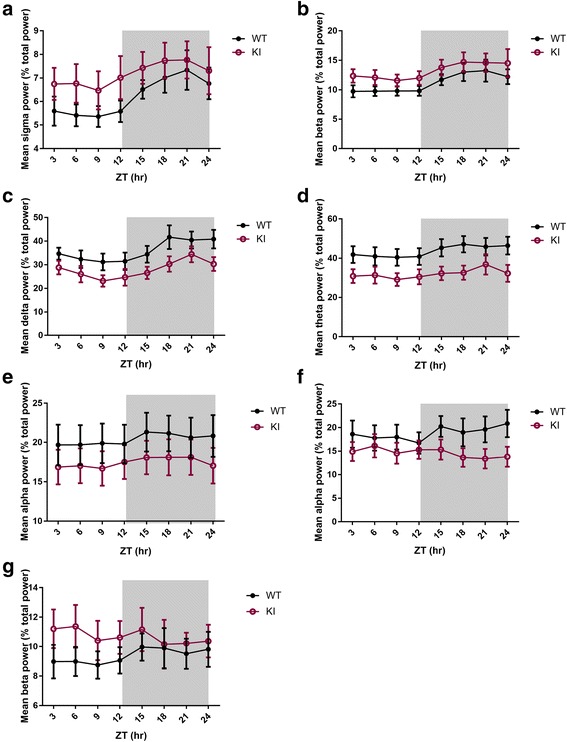
Human studies demonstrate that sleep impairment is a concurrent comorbidity of autism spectrum disorders (ASD), but its etiology remains largely uncertain. One of the prominent theories of ASD suggests that an imbalance in synaptic excitation/inhibition may contribute to various aspects of ASD, including sleep impairments. Following the identification of Nlgn3R451C mutation in patients with ASD, its effects on synaptic transmission and social behaviours have been examined extensively in the mouse model. However, the contributory role of this mutation to sleep impairments in ASD remains unknown. In this study, we showed that Nlgn3R451C knock-in mice, an established genetic model for ASD, exhibited normal duration and distribution of sleep/wake states but significantly altered electroencephalography (EEG) power spectral profiles for wake and sleep.
Keywords: Autism; EEG; NREM; Nlgn3 R451C mouse model; REM; Sleep deficit.
Figures
Similar articles
-
Sleep/Wake Physiology and Quantitative Electroencephalogram Analysis of the Neuroligin-3 Knockout Rat Model of Autism Spectrum Disorder.Sleep. 2017 Oct 1;40(10). doi: 10.1093/sleep/zsx138. Sleep. 2017. PMID: 28958035
-
The neurobiological bases of autism spectrum disorders: the R451C-neuroligin 3 mutation hampers the expression of long-term synaptic depression in the dorsal striatum.Eur J Neurosci. 2018 Mar;47(6):701-708. doi: 10.1111/ejn.13705. Epub 2017 Oct 4. Eur J Neurosci. 2018. PMID: 28921757
-
Analyses of the autism-associated neuroligin-3 R451C mutation in human neurons reveal a gain-of-function synaptic mechanism.Mol Psychiatry. 2024 Jun;29(6):1620-1635. doi: 10.1038/s41380-022-01834-x. Epub 2022 Oct 24. Mol Psychiatry. 2024. PMID: 36280753 Free PMC article.
-
Distortion of the normal function of synaptic cell adhesion molecules by genetic variants as a risk for autism spectrum disorders.Brain Res Bull. 2017 Mar;129:82-90. doi: 10.1016/j.brainresbull.2016.10.006. Epub 2016 Oct 12. Brain Res Bull. 2017. PMID: 27743928 Review.
-
[Synapse maturation and autism: learning from neuroligin model mice].Nihon Shinkei Seishin Yakurigaku Zasshi. 2014 Feb;34(1):1-4. Nihon Shinkei Seishin Yakurigaku Zasshi. 2014. PMID: 25069265 Review. Japanese.
Cited by
-
The absence of Neuroligin-1 shapes wake/sleep architecture, rhythmic and arrhythmic activities of the electrocorticogram in female mice.Mol Brain. 2025 Apr 23;18(1):38. doi: 10.1186/s13041-025-01186-x. Mol Brain. 2025. PMID: 40269933 Free PMC article.
-
Critical periods and Autism Spectrum Disorders, a role for sleep.Neurobiol Sleep Circadian Rhythms. 2022 Dec 20;14:100088. doi: 10.1016/j.nbscr.2022.100088. eCollection 2023 May. Neurobiol Sleep Circadian Rhythms. 2022. PMID: 36632570 Free PMC article.
-
Unraveling the Role of Neuroligin3 in Autism Spectrum Disorders: Pathophysiological Insights and Targeted Therapies.CNS Neurol Disord Drug Targets. 2024;23(7):801-811. doi: 10.2174/1871527323666230727102244. CNS Neurol Disord Drug Targets. 2024. PMID: 37497709 Review.
-
The effect of Neuroligin-2 absence on sleep architecture and electroencephalographic activity in mice.Mol Brain. 2018 Sep 19;11(1):52. doi: 10.1186/s13041-018-0394-3. Mol Brain. 2018. PMID: 30231918 Free PMC article.
-
Circadian rhythm and sleep-wake systems share the dynamic extracellular synaptic milieu.Neurobiol Sleep Circadian Rhythms. 2018 Apr 17;5:15-36. doi: 10.1016/j.nbscr.2018.04.001. eCollection 2018 Jun. Neurobiol Sleep Circadian Rhythms. 2018. PMID: 31236509 Free PMC article. Review.
References
Publication types
MeSH terms
Substances
Grants and funding
LinkOut - more resources
Full Text Sources
Other Literature Sources
Medical
