. 2017 Oct:283:117-123.
doi: 10.1016/j.jmr.2017.03.017. Epub 2017 Mar 27.

Beyond Fourier

Affiliations

Beyond Fourier

Jeffrey C Hoch. J Magn Reson. 2017 Oct.

Abstract

Non-Fourier methods of spectrum analysis are gaining traction in NMR spectroscopy, driven by their utility for processing nonuniformly sampled data. These methods afford new opportunities for optimizing experiment time, resolution, and sensitivity of multidimensional NMR experiments, but they also pose significant challenges not encountered with the discrete Fourier transform. A brief history of non-Fourier methods in NMR serves to place different approaches in context. Non-Fourier methods reflect broader trends in the growing importance of computation in NMR, and offer insights for future software development.

Keywords: Non-Fourier; Nonuniform sampling; Spectrum analysis.


Figures

Figure 1
Figure 1
Statisticians having unusually weighty impact on NMR signal processing. Left: Benjamin F. Logan (photo by John Byrne Cooke, with permission) Right: David Donoho, in front of the Russell H. Varian Laboratory of Physics on the Stanford University Campus.
Figure 2
Figure 2
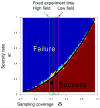
Donoho-Tanner “phase transitions” in compressed sensing, adapted from Monajemi [42]. The color corresponds to the probability of accurate recovery of the spectrum from sparse (nonuniformly sampled) data. Blue is low probability (failure), red is high probability (success). The horizontal axis reports sampling coverage, which is the number of sampled data values divided by the number of spectrum values to be recovered. The vertical axis reports the signal sparsity, the number of non-zero values in the spectrum divided by the total number elements in the spectrum. The vertical columns denoted by rectangular boxes depict a fixed number of samples at low (magenta) and high magnetic field, and fixed digital resolution. At higher field, the spectrum becomes more sparse as the “space” between signals grows, however additional samples are required due to the increased sampling rate necessitated by greater spectral dispersion. The effects are nearly compensatory if the linewidths of the signals are unchanged, so transitioning from an experiment that resides in the failure region at low field to higher field traverses a path (yellow arrow) that is nearly parallel to the Donoho-Tanner phase transition separating failure from success. If the linewidths become narrower at higher field, for example due to TROSY effects, the path becomes steeper (black arrow), and the potential for crossing the phase boundary into the success region becomes greater.
Figure 3
Figure 3
Polaroid (SX70) photographs from the 1990 NATO Advanced Research Workshop “Computational Aspects of the Study of Biological Macromolecules by NMR”, Barga, Italy. Top row, left: Tom James, Frank Delaglio and Ed Olejniczak are visible in the foreground. Center: Christina Redfield (foreground). Ruud Scheek and Christian Griesinger are visible in the background, facing the camera. Right: Werner Braun, Martin Billeter, (both bearded) Tad Holak, Ruud Scheek. Bottom row, left: Angela Gronenborn. Center: Martin Billeter, Dennis Hare*, Mogens Kjaer, Flemming Poulsen* standing at left. Frank Delaglio and Jim Prestegard sitting at right. Right: Frank Delaglio, Ed Olejniczak (facing the camera in the background), John Markley and Philip Bolton, foreground. [* Dennis Hare passed away in 2007. He was noted in his island community for ferrying cancer patients in his Cessna 182 for treatment. Flemming Poulsen died in 2011. He was the patriarch of bio-NMR in Denmark, having established two high-field facilities: first at the Carlsberg Lab, later at the University of Copenhagen. Both Dennis and Flemming made important contributions to NMR data processing and analysis.]
Figure 4
Figure 4
2D and 1D cross-sections through a plane of the 3D HNCACB spectra for the UBL3 domain of USP7. Top: Using data collected using conventional uniform sampling, DFT processing with linear prediction extrapolation and shifted sine-squared apodization in both indirect dimensions. The 1D cross-section is taken at the 15N frequency indicated by the dashed line. Bottom: Using data collected using nonuniform sampling exponentially biased to shorter evolution times and processed using MaxEnt reconstruction in both indirect dimensions. Each experiment required 48 hours of measurement time. The NUS coverage was 25% of the evolution times sampled in the US experiment; the factor of four was used to increase the number of transients acquired at each evolution time by a factor of four.

References

    1. The Human Dark Proteome Initiative. 2015 http://darkproteome.org/
    1. Wright PE, Dyson HJ. Intrinsically disordered proteins in cellular signalling and regulation. Nat Rev Mol Cell Biol. 2015;16:18–29. - PMC - PubMed
    1. Kaptein R, Dijkstra K, Nicolay K. Laser photo-CIDNP as a surface probe for proteins in solution. Nature. 1978;274:293–294. - PubMed
    1. Mueller RM, Buchal C, Folle HR, Kubota M, Powell F. A Double-stage Nuclear Demagnetization Refrigerator. Cryogenics. 1980;20:395–407.
    1. Kenyon B, Kleinberg R, Straley C, Gubelin G, Morriss C. Nuclear Magnetic Resonance Imaging — Technology for the 21st Century. Oilfield Review. 1995;7:19–33.

Publication types

LinkOut - more resources