. 2017 Jul;27(7):1238-1249.
doi: 10.1101/gr.211615.116. Epub 2017 Apr 6.

Genome-wide TOP2A DNA cleavage is biased toward translocated and highly transcribed loci

Affiliations

Genome-wide TOP2A DNA cleavage is biased toward translocated and highly transcribed loci

Xiang Yu et al. Genome Res. 2017 Jul.

Abstract

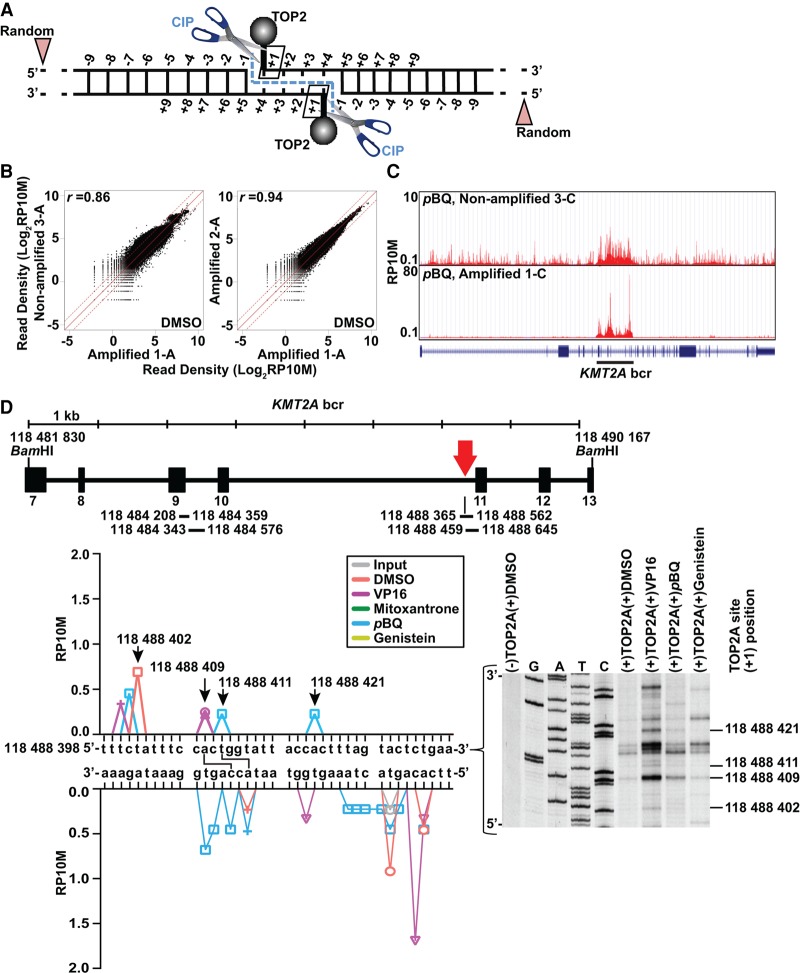
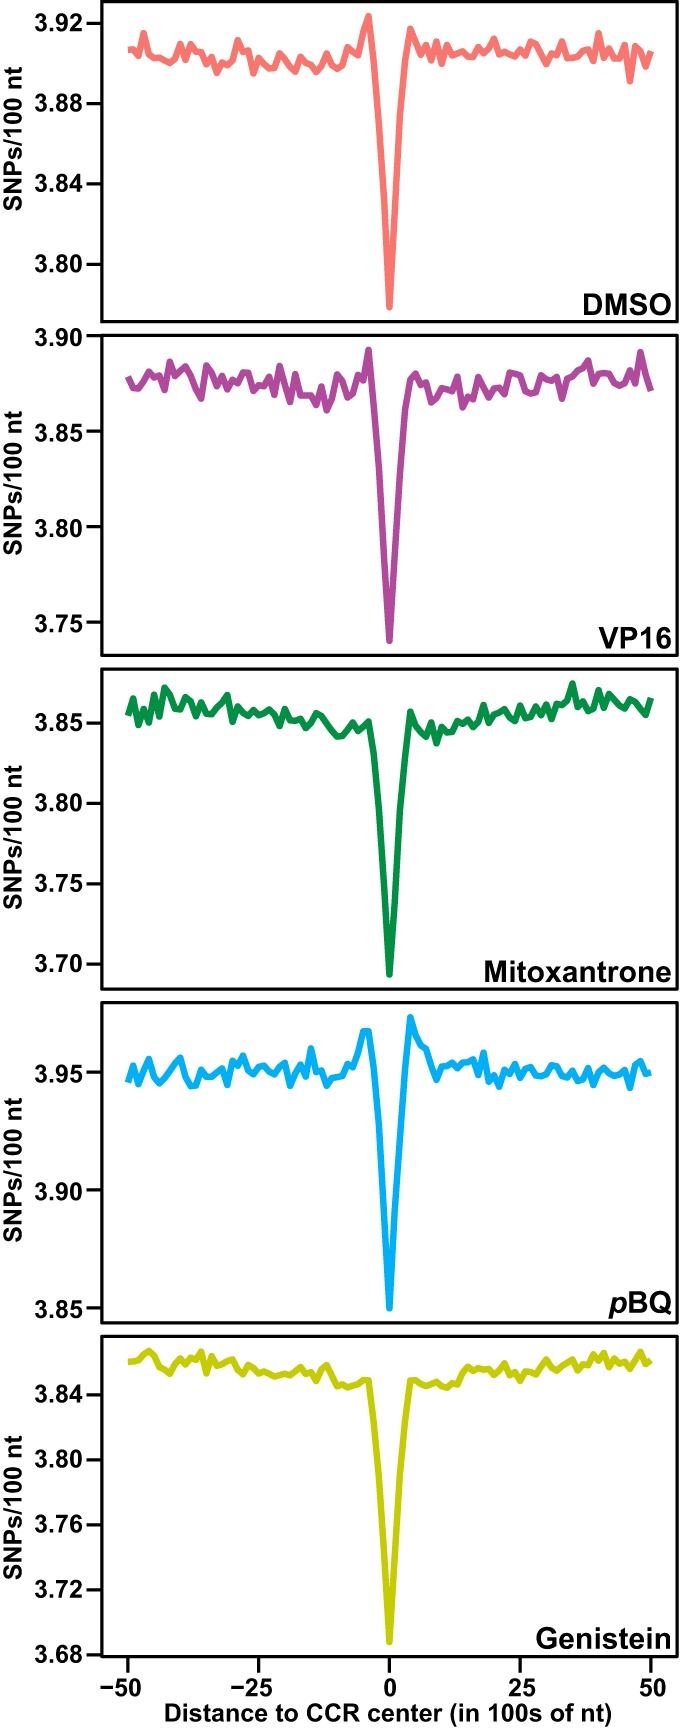
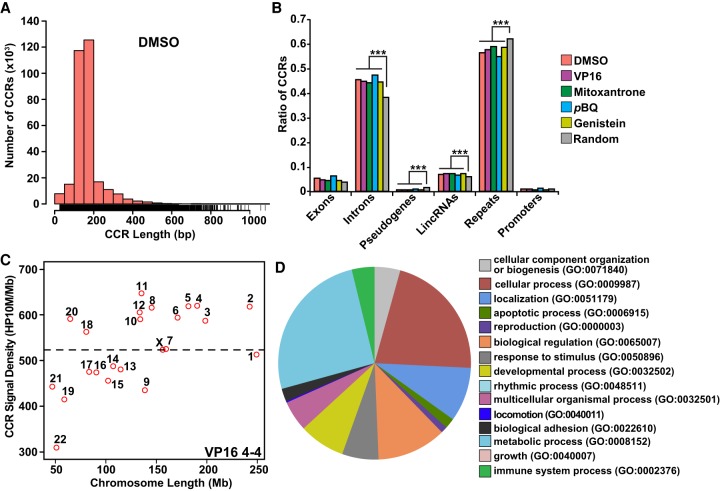
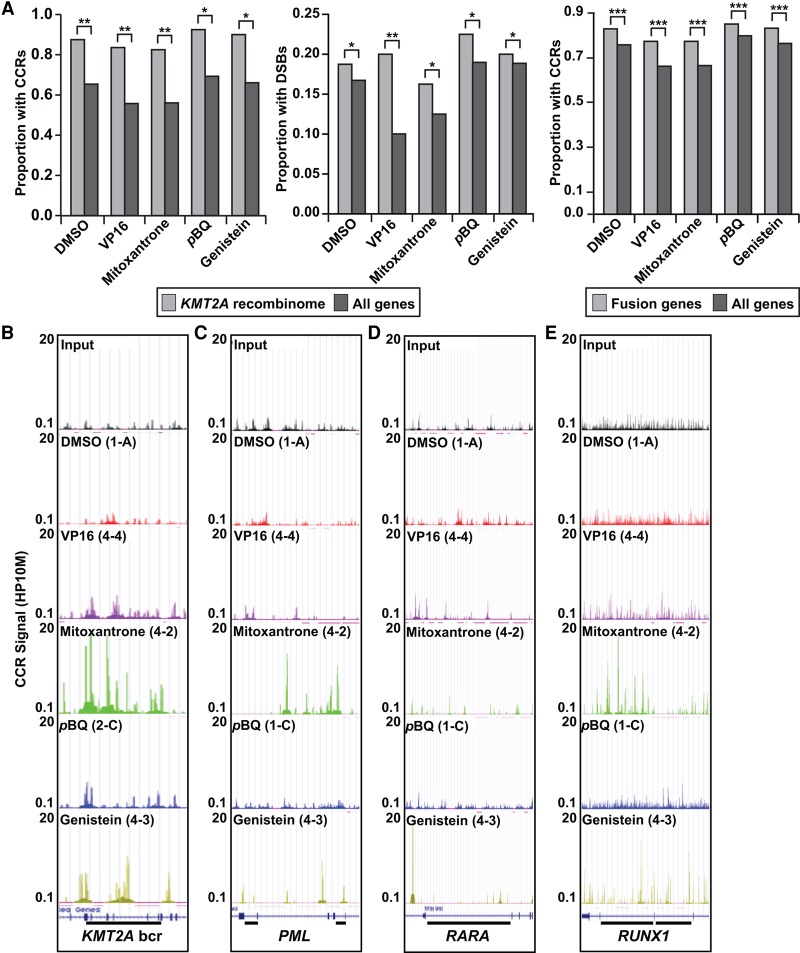
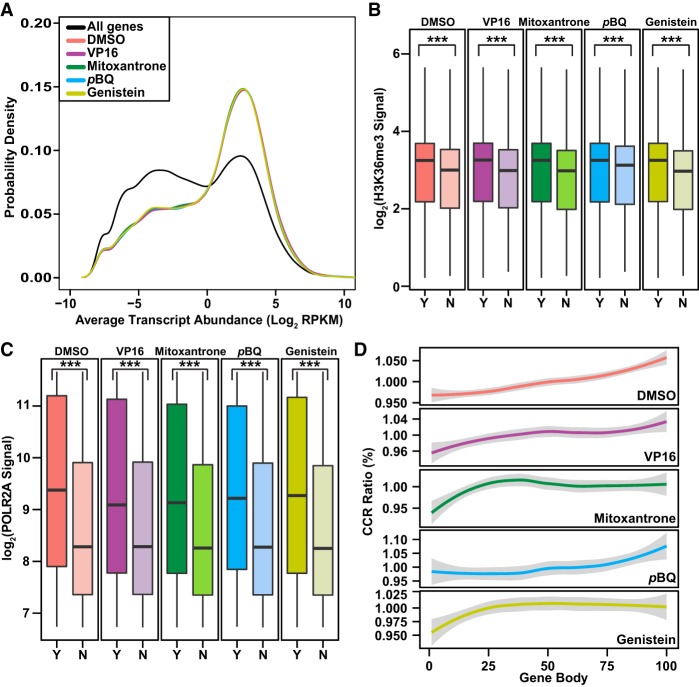
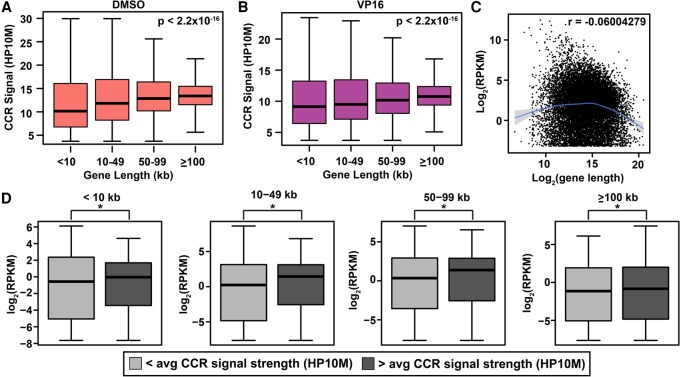
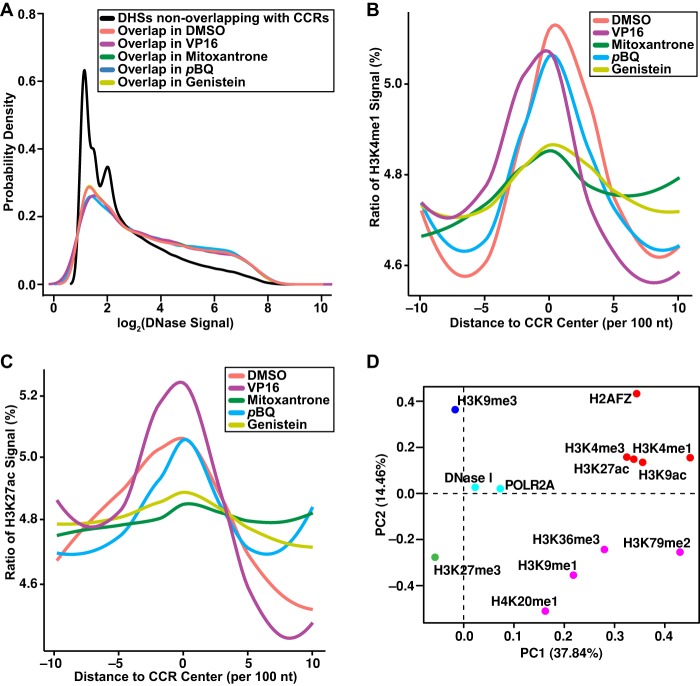
Type II topoisomerases orchestrate proper DNA topology, and they are the targets of anti-cancer drugs that cause treatment-related leukemias with balanced translocations. Here, we develop a high-throughput sequencing technology to define TOP2 cleavage sites at single-base precision, and use the technology to characterize TOP2A cleavage genome-wide in the human K562 leukemia cell line. We find that TOP2A cleavage has functionally conserved local sequence preferences, occurs in cleavage cluster regions (CCRs), and is enriched in introns and lincRNA loci. TOP2A CCRs are biased toward the distal regions of gene bodies, and TOP2 poisons cause a proximal shift in their distribution. We find high TOP2A cleavage levels in genes involved in translocations in TOP2 poison-related leukemia. In addition, we find that a large proportion of genes involved in oncogenic translocations overall contain TOP2A CCRs. The TOP2A cleavage of coding and lincRNA genes is independently associated with both length and transcript abundance. Comparisons to ENCODE data reveal distinct TOP2A CCR clusters that overlap with marks of transcription, open chromatin, and enhancers. Our findings implicate TOP2A cleavage as a broad DNA damage mechanism in oncogenic translocations as well as a functional role of TOP2A cleavage in regulating transcription elongation and gene activation.


Figures

Figure 1.
Figure 1.
Approach, reproducibility, and assay validation. (A) TOP2 cleavage complexes detected by sequencing. After TOP2 immunocapture, CIP releases covalently attached TOP2 subunits from DNA at the +1 positions relative to the cleavage, which (+/− preamplification) become 5′ adapter-ligated ends; 5′ ends from sonication give random signals. Input control (data not shown) is sonicated lysate with random 5′ ends created by sonication. (B) Strong read count correlations in 10-kb windows between DMSO-treated biological replicates +/− preamplification (Supplemental Table S1). (C) UCSC Genome Browser images and KMT2A gene model (http://genome.ucsc.edu/) (Kent et al. 2002) showing similar read distribution in nonamplified and amplified p-benzoquinone (pBQ)–treated replicates. Black bar indicates bcr. (D) Overlap of TOP2A cleavage sites detected by sequencing with cleavage sites from the in vitro assay. Vertical line beneath the red arrow in the KMT2A bcr schematic is a translocation breakpoint hotspot from the TOP2A high-throughput sequencing assay (bottom, left) and autoradiograph inset from TOP2A in vitro cleavage assay of sense strand of same sequence (bottom, right). Colors indicate different treatments; symbols, different replicates. Arrows at peaks in sense strand (bottom, left) indicate +1 positions of cleavage sites also found in vitro (bottom, right, dashes). Connecting lines indicate sites with cleavage detected at +1 positions of both strands by sequencing (bottom, left). Coordinates, NC_000011.10 (GRCh38/hg38). (VP16) Etoposide. Bars beneath KMT2A bcr schematic, regions from both assays in Supplemental Figures S3 and S4.
Figure 2.
Figure 2.
Regional TOP2A CCR sequence conservation. Lower SNP density within 100 nt at CCR centers compared with the surrounding 10 kb in 100-nt sliding windows. P < 2.2 × 10⁻¹⁶; Kruskal–Wallis test. Amplified samples; same treatments merged where applicable (Supplemental Table S1).
Figure 3.
Figure 3.
Characterization and functional analysis of TOP2A CCRs. (A) CCR length distribution. Bars represent numbers of CCRs in increasing 50-bp intervals of length. Note that most CCRs are 100–200 nt long. See also Supplemental Figure S6. (B) CCR occurrences in genomic elements compared with the control (10,000 random size-matched genome segments). Note enrichment in introns and lincRNAs; note underabundance in pseudogenes, repeats, and promoters. (***) P < 2.2 × 10⁻¹⁶; χ2 test. (A,B) Amplified samples; same treatments merged where applicable (Supplemental Table S1). (C) Scatterplot of TOP2A CCR signal density for each chromosome sorted by chromosome length with highest density on Chr 11. VP16 treatment shown as representative. Dashed line indicates average CCR signal density for all chromosomes. See also Supplemental Figure S7. (D) GO analysis of genes overlapping with TOP2A CCRs in union set of amplified DMSO-, VP16-, mitoxantrone-, pBQ-, and genistein-treated samples. GO term categories starting at the 12 o'clock position listed clockwise; metabolic process and cellular process are most enriched.
Figure 4.
Figure 4.
TOP2A cleavage in genes involved in oncogenic translocations. (A, left) Larger proportions of genes containing CCRs in KMT2A recombinome compared with all coding genes. (**) P < 1 × 10⁻⁵ for DMSO, VP16, mitoxantrone; (*) P < 1 × 10⁻⁴ for pBQ, genistein; χ2 test. (A, middle) Larger proportions of genes containing TOP2A DSBs in KMT2A recombinome compared with all coding genes. (*) P < 0.05 for DMSO, mitoxantrone, pBQ, genistein; (**) P = 0.00027375 for VP16; χ2 test. (A, right) Larger proportions of cancer fusion genes (Mitelman et al. 2016) containing CCRs compared with all coding genes. (***) P < 2.2 × 10⁻¹⁶; χ2 test. Amplified samples; same treatments merged where applicable (Supplemental Table S1). (BE) CCR signals (HP10M) in individual amplified samples along regions of genes involved in leukemia-associated translocations linked to TOP2 poisons (bars). Panels show sonicated input and different treatments (top in panels). Gene models from GRCh38/hg38 in the UCSC Genome Browser (bottom) (Kent et al. 2002; http://genome.ucsc.edu/) correspond to tracks shown. (B) KMT2A. Bar, 8.3-kb bcr spanning exon 7 through exon 13 positions 118,481,830–118,490,167; NC_000011.10. (C) PML. Left bar, 1.45-kb intron 3 bcr, positions 74,023,409–74,024,856; right bar, 1.06-kb intron 6 bcr, positions 74,033,415–74,034,477; NC_000015.10. (D) RARA. Bar, 16.9-kb intron 2 bcr, positions 40,332,397–40,348,315; NC_000017.11. (E) RUNX1. Left bar, 25-kb intron 6 bcr, positions 34,859,473–34,834,602; right bar, 35-kb intron 7 bcr, positions 34,834,409–34,799,463; NC_000021.9.
Figure 5.
Figure 5.
Relationships between TOP2A CCRs and transcription marks in coding genes. (A) Distribution of transcript abundance density for all coding genes compared to coding genes with CCRs. Two RNA-seq data sets for untreated K562 cells (GEO accession number GSE46718) (Bansal et al. 2014) were used to plot transcript abundance. Note skew of CCR-containing genes toward peak with more abundant transcripts (colored lines) compared with bimodal distribution of transcript abundance for all coding genes (black line). P-value for DMSO and each TOP2 poison = 2.2 × 10⁻¹⁶; Kruskal–Wallis test. (B,C) Higher H3K36me3 (B) and POLR2A (C) signals (total mapped reads) along bodies of coding genes with (Y indicates yes; darker colors) compared with without (N indicates no; lighter colors) CCRs. Data from the ENCODE Project Consortium 2012 for H3K36me3 and POLR2A signals (Supplemental Table S4; The ENCODE Project Consortium 2012) were converted from GRCh37/hg19 to GRCh38/hg38 using liftOver (http://genome.sph.umich.edu/wiki/LiftOver) (Hinrichs et al. 2006). (Boxes) 25th to 75th percentiles; (whiskers) fifth to 95th percentiles; (horizontal lines) medians. (***) P < 2.2 × 10⁻¹⁶; Kruskal–Wallis test. (D) CCR distribution along gene bodies divided into 100 equally sized windows. Graphs display CCRs/window relative to total. Note distribution in middle and 3′ ends with DMSO and pBQ and proximal shifts with VP16, mitoxantrone, and genistein. (AD) Amplified samples; same treatments merged where applicable (Supplemental Table S1).
Figure 6.
Figure 6.
Independent associations of CCR signal strength with coding gene length and transcript abundance. (A,B) Correlation between length and genic CCR signal strength (HP10M) in DMSO-treated (A) and VP16-treated (B) samples. Gene length from GRCh38/hg38 by categories on x-axis. (Boxes) 25th to 75th percentiles; (whiskers) fifth to 95th percentiles; (horizontal lines) median for each length interval. χ2 test P-values, top right in panels. Amplified samples; same treatments merged (Supplemental Table S1). (C) Scatter plot of protein-coding transcript abundance versus gene length based on two RNA-seq data sets for untreated K562 cells (GEO accession number GSE46718) (Bansal et al. 2014) and gene length from GRCh38/hg38. Smooth line was predicted by the gam method (Supplemental Methods). (Shading) Confidence interval around smoothed trend line. Genes with RPKM > 0.1 plotted. r-value (top right) shows slight overall negative correlation. (D) Box and whisker plots of genic CCR signal strength versus transcript abundance within indicated length categories subdivided based on </> average genic CCR signal strength. (*) P < 0.05; χ2 test. Note correlation between genic CCR signal strength and transcript abundance across all lengths. Union set of all amplified samples (Supplemental Table S1).
Figure 7.
Figure 7.
Colocalization of genome-wide TOP2A CCRs with chromatin features. (A) Higher DNase I signal density in DHSs that overlap (colored lines) with CCRs compared with DHSs that do not (black line) overlap. P < 2.2 × 10⁻¹⁶; Kruskal–Wallis test. (B,C) Enriched H3K4me1 (B) and H3K27ac (C) signals at CCR centers (position 0 on x-axis) compared with 1-kb upstream and downstream flanking sequences in 100-nt sliding windows. P < 0.001 for DMSO, VP16, pBQ; P < 0.01 for mitoxantrone, genistein; Kruskal–Wallis test. (AC) Amplified samples; same treatments merged where applicable. (D) Clustering of features found within CCRs by PCA and k-means algorithms. PC1 and PC2 account for 37.84% and 14.46% of the total variance, respectively. Dots represent PCA loadings for indicated features. Colors show five clusters of features found in CCRs. Along PC1, note the separation of histone marks of gene repression (dark blue, green) from marks known to positively affect gene expression (light blue, purple, red). Along PC2, note the separation between clusters of marks of actively expressed genes (light blue, purple) from cluster of gene activating elements including enhancer marks (red). Union set of CCRs from all amplified samples. (AD) Analyses were performed on existing data for chromatin features (The ENCODE Project Consortium 2012) after liftOver (Hinrichs et al. 2006; http://genome.sph.umich.edu/wiki/LiftOver) conversion to GRCh38/hg38. See also Supplemental Tables S1, S4.

References

    1. The 1000 Genomes Project Consortium. 2015. A global reference for human genetic variation. Nature 526: 68–74. - PMC - PubMed
    1. Ashour ME, Atteya R, El-Khamisy SF. 2015. Topoisomerase-mediated chromosomal break repair: an emerging player in many games. Nat Rev Cancer 15: 137–151. - PubMed
    1. Audic S, Claverie JM. 1997. The significance of digital gene expression profiles. Genome Res 7: 986–995. - PubMed
    1. Bansal H, Yihua Q, Iyer SP, Ganapathy S, Proia DA, Penalva LO, Uren PJ, Suresh U, Carew JS, Karnad AB, et al. 2014. WTAP is a novel oncogenic protein in acute myeloid leukemia. Leukemia 28: 1171–1174. - PMC - PubMed
    1. Baranello L, Kouzine F, Wojtowicz D, Cui K, Przytycka TM, Zhao K, Levens D. 2014. DNA break mapping reveals topoisomerase II activity genome-wide. Int J Mol Sci 15: 13111–13122. - PMC - PubMed

Publication types

MeSH terms