. 2017 Apr 7;356(6333):73-78.
doi: 10.1126/science.aam6808.

Engrams and circuits crucial for systems consolidation of a memory

Affiliations

Engrams and circuits crucial for systems consolidation of a memory

Takashi Kitamura et al. Science. .

Abstract

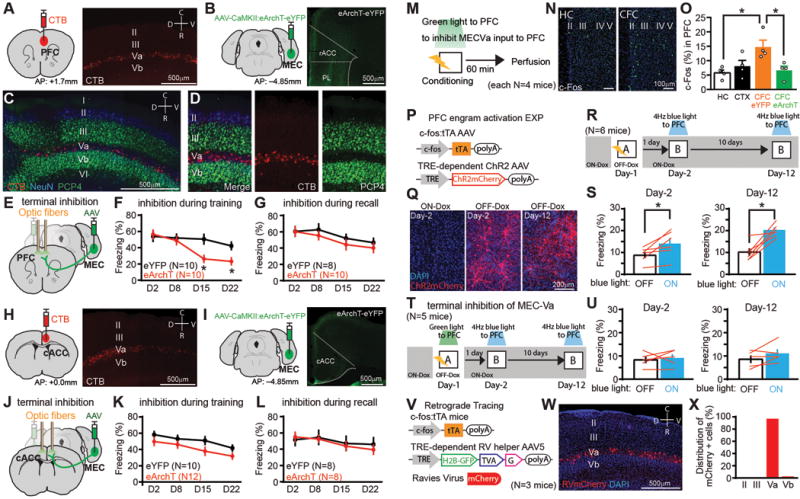
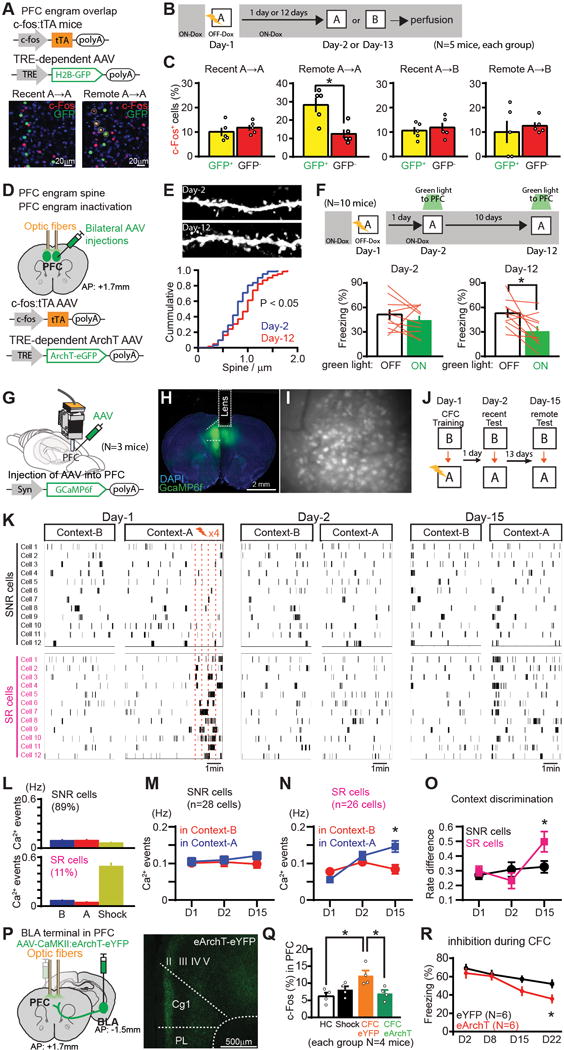
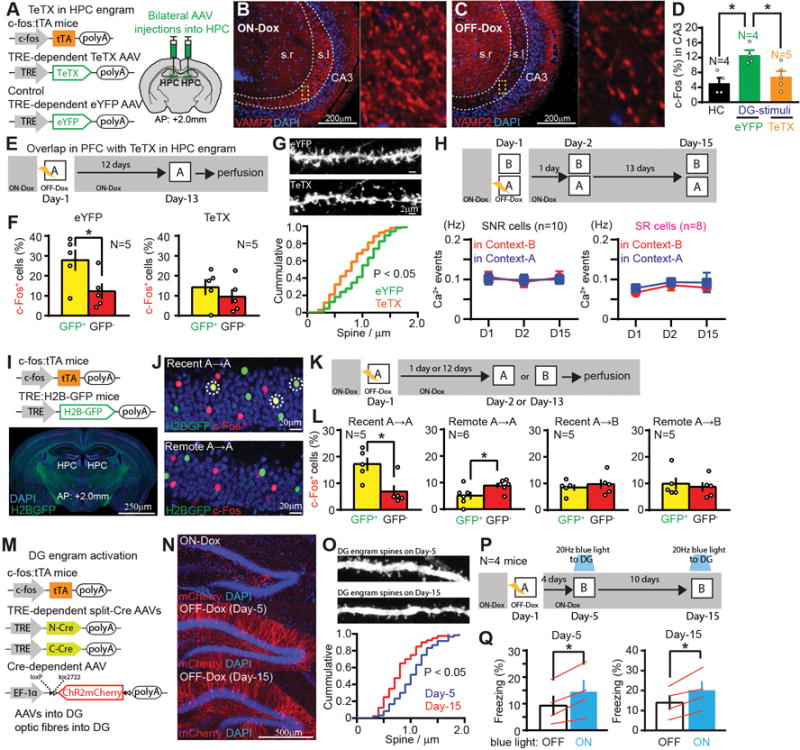
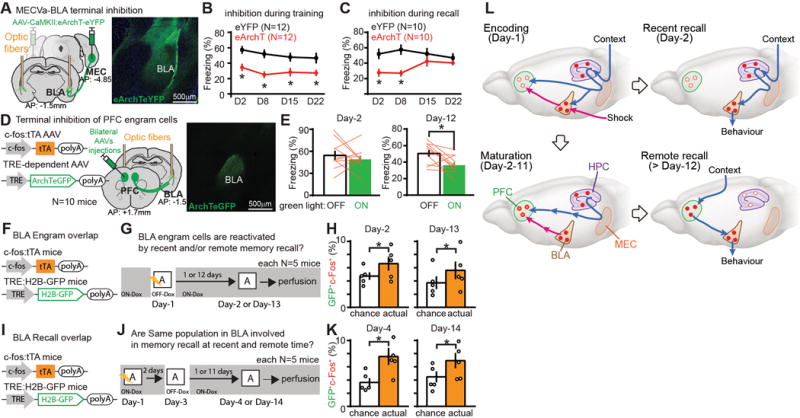
Episodic memories initially require rapid synaptic plasticity within the hippocampus for their formation and are gradually consolidated in neocortical networks for permanent storage. However, the engrams and circuits that support neocortical memory consolidation have thus far been unknown. We found that neocortical prefrontal memory engram cells, which are critical for remote contextual fear memory, were rapidly generated during initial learning through inputs from both the hippocampal-entorhinal cortex network and the basolateral amygdala. After their generation, the prefrontal engram cells, with support from hippocampal memory engram cells, became functionally mature with time. Whereas hippocampal engram cells gradually became silent with time, engram cells in the basolateral amygdala, which were necessary for fear memory, were maintained. Our data provide new insights into the functional reorganization of engrams and circuits underlying systems consolidation of memory.


Figures

Fig. 1
Fig. 1. MECVa input to PFC during conditioning is crucial for generation of PFC engram cells
(A) CTB injection into PFC. Sagittal section of MEC with CTB-labeled cells (red) (B) Coronal sections of PFC with MECVa axons expressing eYFP (green). rACC; rostral ACC, PL; prelimbic cortex. (C, D) Sagittal section of MEC with CTB-labeled cells (red) and immunostained with anti-PCP4 (green) and anti-NeuN (blue). PCP4 is a marker for layer III and Vb cells in MEC. CTB injection into BLA. (E, J) Viral injections and optic fiber implantations. (F, G) Time courses of freezing during recall tests. Green light was shone into the PFC during conditioning (F) or testing (G). N presents number of animals. (H) CTB injection into caudal ACC (cACC). Sagittal section of MEC with CTB-labeled cells (red). (I) Coronal sections of ACC with MECVa axons (green). (K, L) Time courses of freezing during recall tests. Green light was shone into the ACC during conditioning (K) or testing (L). (M) Experimental schedule. (N) Coronal section of PFC with anti-c-Fos (green). (O) Percentages of c-Fos+ cells in PFC of homecage (HC), context exposure (CTX), CFC with eYFP, and CFC with eArchT group. (P) Virus-mediated engram cell labelling with ChR2. (Q) Coronal section of PFC with ChR2-mCherry (red). (R, T) Experimental schedule. (S, U) Averaged freezing for light-off and light-on epochs. (V) Retrograde trans-synaptic labeling with activity-dependent cell labeling. (W) Sagittal section of MEC with rabies virus–specific mCherry (red). (X) Distribution of mCherry+ cells in the MEC (n=212 mCherry+ cells, n presents number of cells.). *P < 0.05 by unpaired t-test compared to eYFP (F, G, K, L), one-way ANOVA with Tukey-Kramer test (O) and paired t-test (S, U). Error bars mean ± s.e.m.
Fig. 2
Fig. 2. PFC engram cells mature with time
(A) PFC engram cell labelling with H2B-GFP. Coronal sections of PFC with H2B-GFP (green), anti-c-Fos (red). Marked cells are double-positive. (B) Experimental schedule. (C) Percentages of c-Fos+ cells in H2B-GFP+ and H2B-GFP cells in PFC. (D) PFC engram cell labelling with ArchT. (E) Images showing dendritic spines from PFC engram cells. Cumulative probability of the spine density of PFC engram. (F) Experimental schedule. Averaged freezing for light-off and light-on epoch during recall test. (G, H) Viral injections and GRIN lens implantation. (I) Stacked image acquired through the microendoscope over 10 mins of imaging in PFC. (J) Experimental schedule. (K) Raster plots of Ca2+ event in shock non-responding (SNR) cells and shock responding (SR) cells in PFC (showing 12 example cells). (L-N) Average Ca2+ event frequency of SNR cells and SR cells on Day-1, Day-2 and Day-3. (O) Average rate difference index of Ca2+ activity. (P) Viral injections and optic fiber implantations. Coronal sections of PFC visualizing BLA axons (green). (Q) Percentages of c-Fos+ cells in PFC of homecage (HC), shock only (Shock), CFC with eYFP, and CFC with eArchT, groups. (R) Time courses of freezing during recall tests. *P < 0.05 by unpaired t-test (C, O, R), KS test (E), paired t-test (F, M, N), one-way ANOVA with Tukey-Kramer test (Q). Error bars mean ± s.e.m.
Fig. 3
Fig. 3. HPC engram cells support the maturation of PFC engram cells, while HPC engram cells become silent with time
(A) DG engram cell labelling with TeTX. (B, C) Sagittal sections of HPC with anti-VAMP2 (red). (D) Percentages of c-Fos+ cells in hippocampal CA3 of homecage, blue-light-ON mice with eYFP or with TeTX. (E) Experimental schedule. (F) Percentages of c-Fos+ cells in H2B-GFP+ and H2B-GFP cells in the PFC of eYFP- and TeTX-expressing mice. (G) Images showing dendritic spines from PFC engram. Cumulative probability of the spine density of PFC engram of eYFP- and TeTX-expressing mice. (H) Experimental schedule, average Ca2+ event frequency of SNR cells and SR cells under TeTX-expressing condition. (I) Transgenic strategy of DG engram cell labelling with H2B-GFP. (J) Coronal sections of DG with H2B-GFP (green), anti-c-Fos (red). Marked cells are double-positive. (K, P) Experimental schedule. (L) Percentages of c-Fos+ cells in H2B-GFP+ and H2B-GFP cells in the DG. (M) Long-term DG engram cell labeling with ChR2. (N) Coronal sections of DG with ChR2-mCherry (red). (O) Images showing dendritic spines from DG engram. Cumulative probability of the spine density of DG engram. (Q) Averaged freezing by blue light stimulation for light-off and light-on epochs. *P < 0.05 by one-way ANOVA with Tukey-Kramer test (D), unpaired t-test (F, L), KS test (G, O), paired t-test (H, Q). Error bars mean ± s.e.m.
Fig. 4
Fig. 4. BLA engram cells are maintained throughout consolidation but with a switch of the recall circuit
(A) Viral injections and optic fiber implantations. Coronal sections of BLA with MECVa axons expressing eYFP (green). (B, C) Time courses of freezing during recall tests. Green light was shone into the BLA during conditioning (B) or testing periods (C). (D) Viral injections and optic fiber implantations. Coronal sections of BLA visualizing axons of PFC engram cells (green). (E) Averaged freezing for green light-off and light-on epochs during recall test. (F, I) BLA engram cell labelling with H2B-GFP. (G, J) Experimental schedules. (H, K) Percentages of double labeling with c-Fos+ and H2B-GFP+ in the BLA compared to the calculated chance level. (L) A new model for systems consolidation of memory. *P < 0.05 by unpaired t-test (B, C, H, K) or by paired t-test (E). Error bars mean ± s.e.m.

Comment in

References

    1. Marr D. Philos Trans R Soc Lond B Biol Sci. 1971 Jul 1;262:23. - PubMed
    1. Squire LR. Science. 1986 Jun 27;232:1612. - PubMed
    1. Kim JJ, Fanselow MS. Science. 1992 May 1;256:675. - PubMed
    1. McClelland JL, McNaughton BL, O’Reilly RC. Psychol Rev. 1995 Jul;102:419. - PubMed
    1. Nadel L, Moscovitch M. Curr Opin Neurobiol. 1997 Apr;7:217. - PubMed