. 2017 Jul;31(7):3138-3149.
doi: 10.1096/fj.201601294R. Epub 2017 Apr 6.

Pharmacological Sirt6 inhibition improves glucose tolerance in a type 2 diabetes mouse model

Affiliations

Pharmacological Sirt6 inhibition improves glucose tolerance in a type 2 diabetes mouse model

Giovanna Sociali et al. FASEB J. 2017 Jul.

Abstract

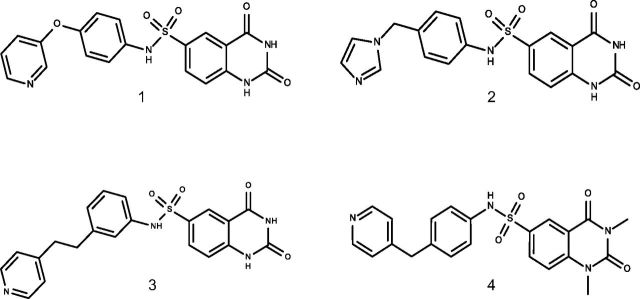
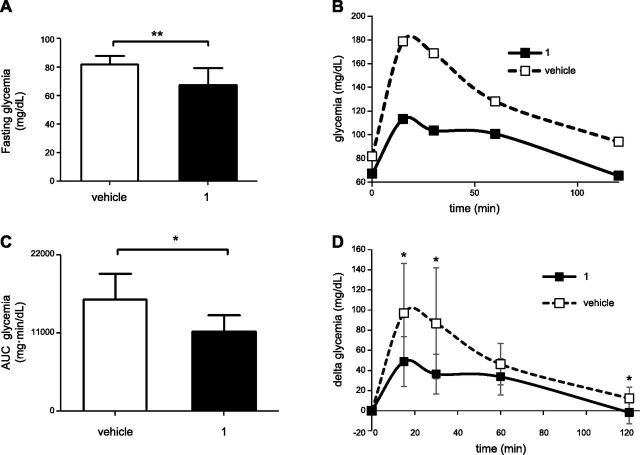
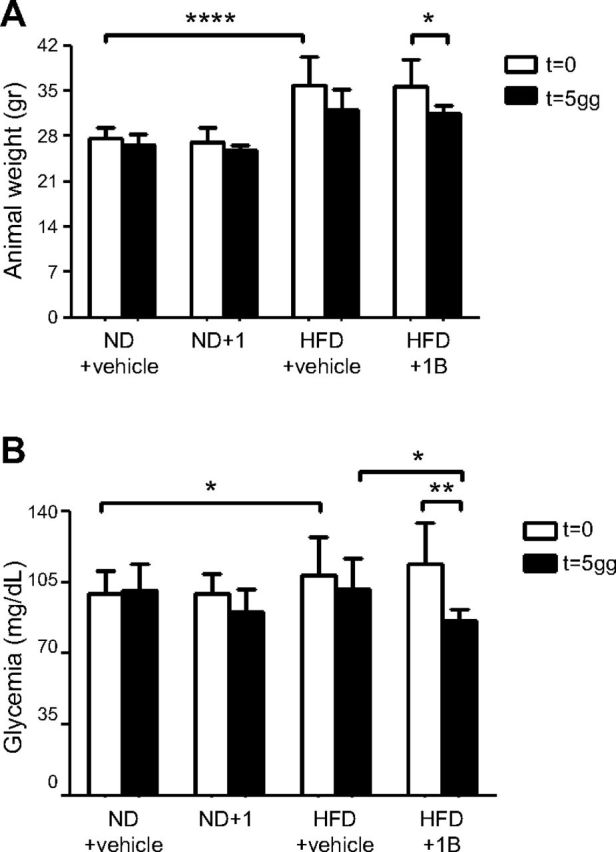
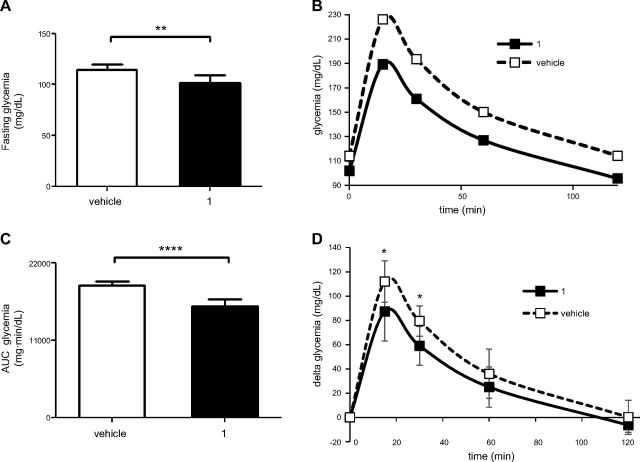
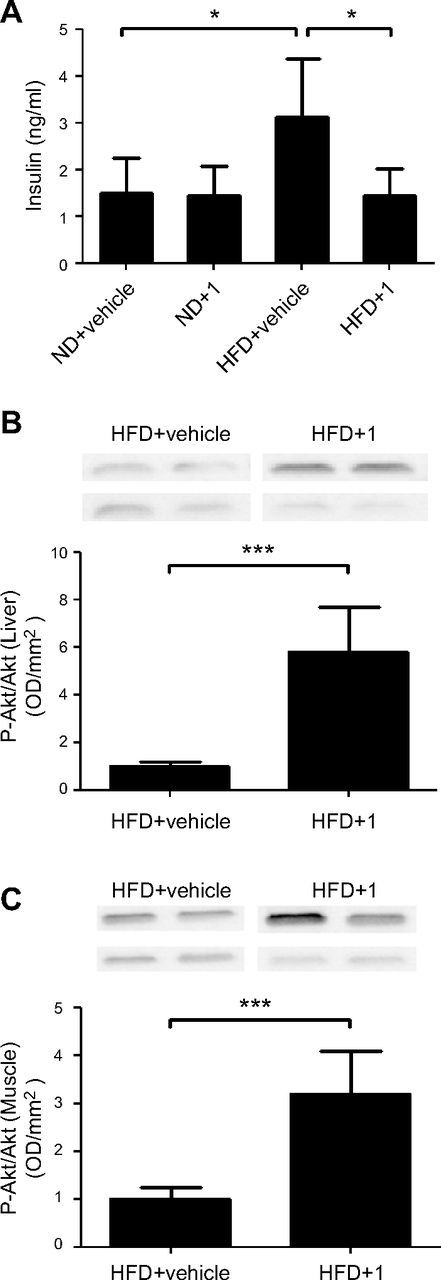
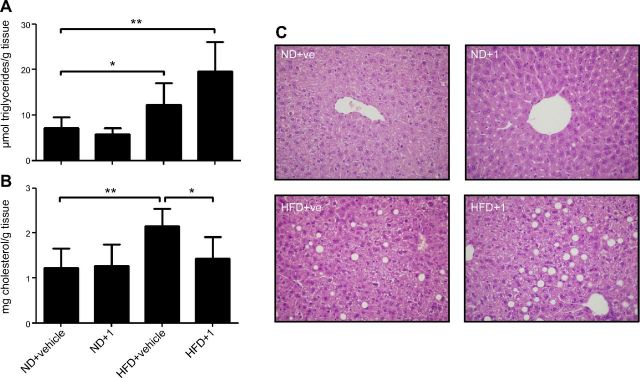
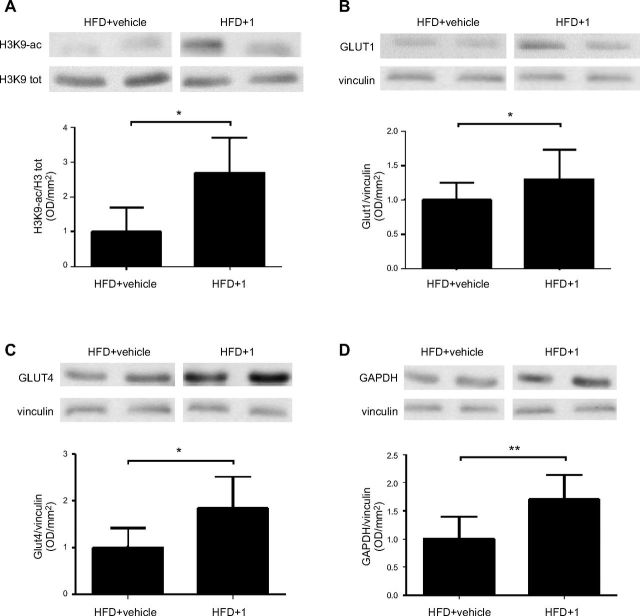
Sirtuin 6 (SIRT6) is a sirtuin family member involved in a wide range of physiologic and disease processes, including cancer and glucose homeostasis. Based on the roles played by SIRT6 in different organs, including its ability to repress the expression of glucose transporters and glycolytic enzymes, inhibiting SIRT6 has been proposed as an approach for treating type 2 diabetes mellitus (T2DM). However, so far, the lack of small-molecule Sirt6 inhibitors has hampered the conduct of in vivo studies to assess the viability of this strategy. We took advantage of a recently identified SIRT6 inhibitor, compound 1, to study the effect of pharmacological Sirt6 inhibition in a mouse model of T2DM (i.e., in high-fat-diet-fed animals). The administration of the Sirt6 inhibitor for 10 d was well tolerated and improved oral glucose tolerance, it increased the expression of the glucose transporters GLUT1 and -4 in the muscle and enhanced the activity of the glycolytic pathway. Sirt6 inhibition also resulted in reduced insulin, triglycerides, and cholesterol levels in plasma. This study represents the first in vivo study of a SIRT6 inhibitor and provides the proof-of-concept that targeting SIRT6 may be a viable strategy for improving glycemic control in T2DM.-Sociali, G., Magnone, M., Ravera, S., Damonte, P., Vigliarolo, T., Von Holtey, M., Vellone, V. G., Millo, E., Caffa, I., Cea, M., Parenti, M. D., Del Rio, A., Murone, M., Mostoslavsky, R., Grozio, A., Nencioni, A., Bruzzone S. Pharmacological Sirt6 inhibition improves glucose tolerance in a type 2 diabetes mouse model.

Keywords: glucose metabolism; glucose transporters; sirtuin inhibitors.


Conflict of interest statement

The authors thank Thierry Dupraz and Yogeshwar Bacchav (Debiopharm International SA) for technical support. G.S. is a recipient of a fellowship for young investigators granted by Collegio Ghislieri (Pavia, Italy). This work was supported by the Italian Ministry of Health Grant GR-2011–02347192 (to A.N., A.G., and A.D.R.); the University of Genova (to S.B. and A.N.); Programme FP7 PANACREAS Grant 256986 (to A.N. and S.B.) and Athero-B-Cell, Grant 602114 (to A.N.); Associazione Italiana per la Ricerca sul Cancro (AIRC) Grant 17736 (to A.N.); and the Fondazione Umberto Veronesi (to A.N.). G.S. and M.M. contributed equally to this work as first authors. A.N. and S.B. contributed equally to this work as senior authors. The authors declare no conflicts of interest.

Figures

Figure 1.
Figure 1.
Chemical structures of compounds 1, 2, 3, and 4.
Figure 2.
Figure 2.
Compound 1 reduces glycemia and improves oral glucose tolerance in unfed wild-type mice. C57BL/6J mice (7/group) were treated with 15 mg/kg compound 1, or with vehicle alone, left unfed overnight, and treated with a second dose of compound 1 (15 mg/kg) the following morning. A) After 2 h, glycemia was measured, and a standard oral glucose tolerance test was performed. B, C) Glycemia was monitored at the indicated time points (B), and AUC was calculated (C). D) Glycemia during the OGTT, as in B, was plotted setting the baseline glucose levels to 0. Data are expressed as means ± sd (A, C, D). Mean values are shown. *P < 0.05 (C); **P < 0.01 (A); *P < 0.05 vs. vehicle at the corresponding time point (D).
Figure 3.
Figure 3.
Compound 1 reduces body weight and fasting glycemia in HFD-fed mice. C57BL/6J mice (7/group) were fed an ND or an HFD for 11 wk. Next, animals were treated with compound 1 (15 mg/kg, i.p., daily), or with vehicle alone, for 5 d. After food was withheld overnight, body weight (A) and glycemia (B) were measured in unfed mice. *P < 0.05, **P < 0.01, ****P < 0.0001.
Figure 4.
Figure 4.
Compound 1 improves oral glucose tolerance in HFD-fed mice. C57BL/6J mice (7/group) were fed an HFD for 11 wk. The animals were then treated with compound 1 (15 mg/kg, i.p., daily), or with vehicle alone, for 10 d. A) After overnight food deprivation, glycemia was measured, and glucose was orally administered. B, C) Glycemia was monitored at the indicated time points (B), and the area under the curve was calculated (C). D) Glycemia during the OGTT, as in B, was plotted, setting the baseline glucose levels to zero. Data are expressed means ± sd (A, C, D). Means are shown in panel B. **P < 0.01, ****P < 0.0001 (A, C); *P < 0.05 vs. vehicle at the corresponding time point (D).
Figure 5.
Figure 5.
Compound 1 reduces insulin blood levels and increases levels of Akt phosphorylation in liver and muscle tissue in HFD-fed mice. C57BL/6J mice (7/group) were fed an ND or an HFD for 11 wk. The animals were then treated with compound 1 (15 mg/kg, i.p. daily), or with vehicle alone, for 11 d. A) Insulin plasma levels were measured. B, C) Liver (B) and muscle tissue (C) were recovered and homogenized: 50 μg proteins was loaded on SDS-polyacrylamide gels, subjected to Western blot analysis, and stained with anti-phospho-Akt or total Akt primary antibody. Band intensity was evaluated, and phospho-Akt levels were normalized to Akt levels. Representative Western blot analyses from 2 animals/group are shown. Graphs shows means ± sd of results from 4–5 animals. *P < 0.05, ***P < 0.001.
Figure 6.
Figure 6.
Compound 1 reduces triglycerides and total cholesterol and LDL/VLDL blood levels, and increases HDL, in HFD-fed mice. C57BL/6J mice (7/group) were fed an ND or an HFD for 11 wk. Next, animals were treated with compound 1 (15 mg/kg, i.p., daily), or with vehicle alone, for 11 d. A, B) Triglycerides (A) and total cholesterol (B) were measured with strips. C) Plasma total cholesterol. HDL and LDL/VLDL were measured with a colorimetric assay kit. *P < 0.05, **P < 0.01; #P < 0.01, ##P < 0.001 vs. ND+vehicle.
Figure 7.
Figure 7.
Compound 1 reduces hepatic total cholesterol, but not triglycerides, in HFD-fed mice. C57BL/6J mice (7/group) were fed an ND or an HFD for 11 wk. Next, animals were treated with compound 1 (15 mg/kg, i.p., daily) or with vehicle alone for 11 d. A, B) Triglycerides (A) and total cholesterol (B) were measured on liver homogenates with a colorimetric assay kit. C) Immediately after liver recovery, a part of the organ was fixed in formalin and processed for hematoxylin-eosin staining. *P < 0.05, **P < 0.01.
Figure 8.
Figure 8.
Compound 1 increases acetylation levels of H3K9 and expression of Glut1, Glut4, and Gapdh. C57BL/6J mice (7/group) were fed an ND or an HFD for 11 wk. The animals were then treated with compound 1 (15 mg/kg, i.p,. daily) or with vehicle alone for 11 d. Muscle tissue was collected, and Western blot analyses were performed on the obtained lysates. Acetylation levels of Lys 9 on Histone 3 (A) and expression levels of the glucose transporters Glut1 (B), Glut4 (C), and Gapdh (D) were evaluated with the appropriate antibodies. Representative Western blot analyses from 2 animals/group are shown. Graphs shows means ± sd of results in 4–5 animals. *P < 0.05, **P < 0.01.
Figure 9.
Figure 9.
Compound 1 increases glycolysis and decreases O2 consumption in muscle tissue from ND- and HFD-fed mice. A–C) PFK (A), PK (B), and LDH (C) activities were determined in muscle tissue lysates (50 μg protein) from the differently fed and treated animals. D, E) ATP and AMP levels were measured in the same extracts (D) and their ratio was calculated (E). F) O2 consumption was induced by the addition of pyruvate/malate and blocked by rotenone, the specific inhibitor of complex I. *P < 0.05, **P < 0.01, ***P < 0.001, ****P < 0.0001.

References

    1. Nolan C. J., Damm P., Prentki M. (2011) Type 2 diabetes across generations: from pathophysiology to prevention and management. Lancet , 169–181 - PubMed
    1. Marín-Peñalver J. J., Martín-Timón I., Sevillano-Collantes C., Del Cañizo-Gómez F. J. (2016) Update on the treatment of type 2 diabetes mellitus. World J. Diabetes , 354–395 - PMC - PubMed
    1. Finkel T., Deng C. X., Mostoslavsky R. (2009) Recent progress in the biology and physiology of sirtuins. Nature , 587–591 - PMC - PubMed
    1. Jiang H., Khan S., Wang Y., Charron G., He B., Sebastian C., Du J., Kim R., Ge E., Mostoslavsky R., Hang H. C., Hao Q., Lin H. (2013) SIRT6 regulates TNF-α secretion through hydrolysis of long-chain fatty acyl lysine. Nature , 110–113 - PMC - PubMed
    1. Liszt G., Ford E., Kurtev M., Guarente L. (2005) Mouse Sir2 homolog SIRT6 is a nuclear ADP-ribosyltransferase. J. Biol. Chem. , 21313–21320 - PubMed

Publication types

LinkOut - more resources