. 2017 Mar 23:11:141.
doi: 10.3389/fnins.2017.00141. eCollection 2017.

Characterizing Electrocochleography in Cochlear Implant Recipients with Residual Low-Frequency Hearing

Affiliations

Characterizing Electrocochleography in Cochlear Implant Recipients with Residual Low-Frequency Hearing

Christofer W Bester et al. Front Neurosci. .

Abstract

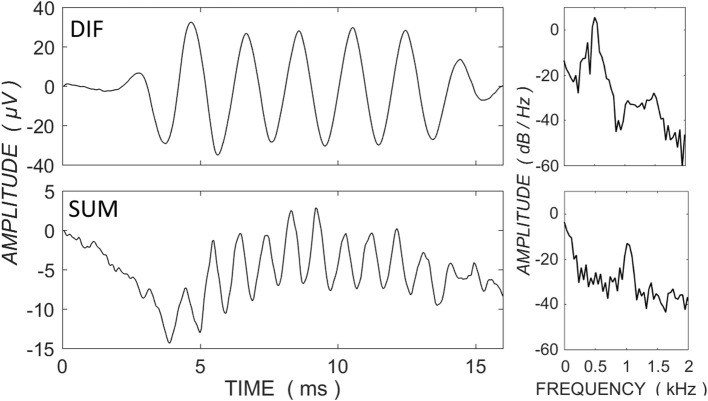
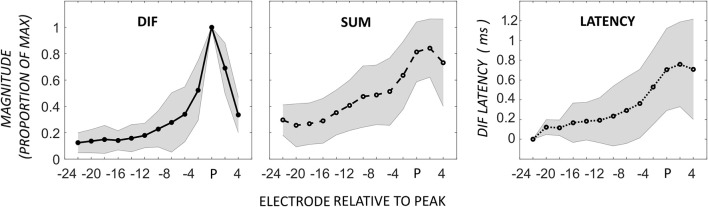
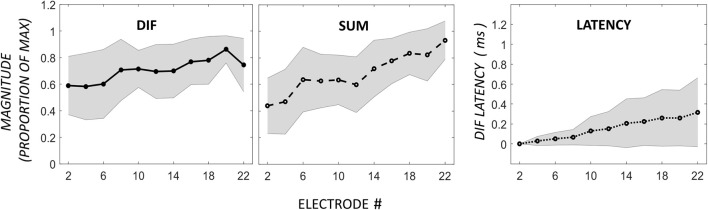
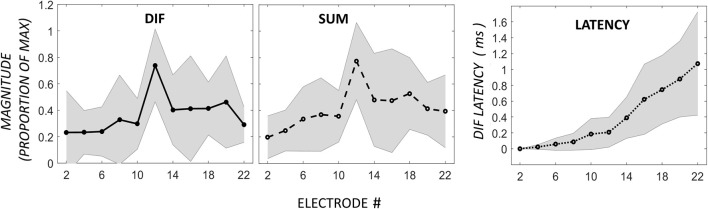
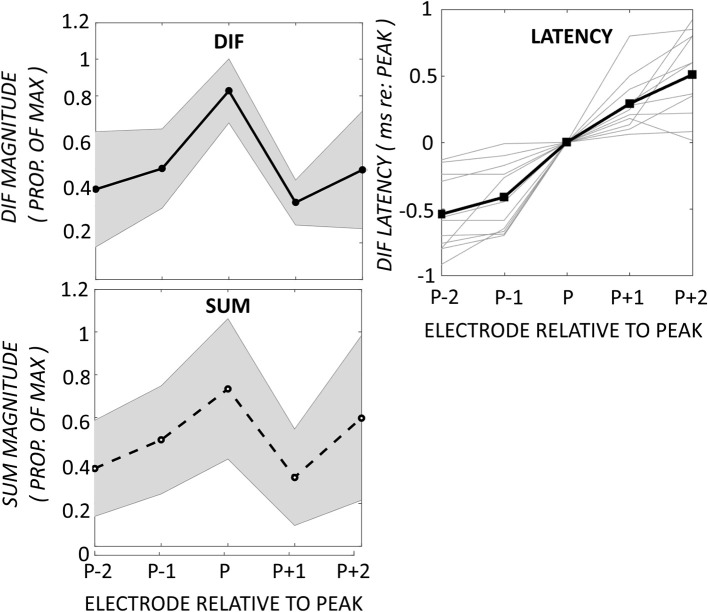
Objective: Lay the groundwork for using electrocochleography (ECochG) as a measure of cochlear health, by characterizing typical patterns of the ECochG response observed across the electrode array in cochlear implant recipients with residual hearing. Methods: ECochG was measured immediately after electrode insertion in 45 cochlear implant recipients with residual hearing. The Cochlear Response Telemetry system was used to record ECochG across the electrode array, in response to 100- or 110-dB SPL pure tones at 0.5-kHz, presented at 14 per second and with alternating polarities. Hair cell activity, as the cochlear microphonic (CM), was estimated by taking the difference (DIF) of the two polarities. Neural activity, as the auditory nerve neurophonic (ANN), was estimated by taking the sum (SUM) of the two polarities. Prior work in humans and animal studies suggested that the expected ECochG pattern in response to a 0.5-kHz pure tone is an apical-peak in CM amplitude and latency. Results: The most prevalent pattern was a peak in the DIF amplitude near the most apical electrode, with a prolongation of latency toward the electrode tip; this was found in 21/39 individuals with successful ECochG recordings. The 21 apical-peak recipients had the best low-frequency hearing. A low amplitude, long-latency DIF response that remained relatively constant across the electrode array was found in 10/39 individuals, in a group with the poorest low- and high-frequency hearing. A third, previously undescribed, pattern occurred in 8/39 participants, with mid-electrode peaks in DIF amplitude. These recipients had the best high-frequency hearing and a progressive prolongation of DIF latency around the mid-electrode peaks consistent with the presence of discrete populations of hair cells. Conclusions: The presence of distinct patterns of the ECochG response with relationships to pre-operative hearing levels supports the notion that ECochG across the electrode array functions as a measure of cochlear health.

Keywords: cochlea; cochlear implant; cochlear microphonic; electrocochleography; hearing loss.


Figures

Figure 1
Figure 1
ECochG traces for the difference (DIF - upper panels) and sum (SUM - lower panels) responses in a single CI recipient with <70 dB HL at 0.5-kHz and in response to a 0.5-kHz tone burst at 100 dB HL. Power spectral density functions are shown to the right of the traces (expressed as dB relative to 1 μV). The primary power for the DIF trace is concentrated at the fundamental frequency, consistent with a contribution primarily by the frequency-matching hair cell response, whereas the power in the SUM trace is concentrated at the secondary harmonic, consistent with the neural saturating response.
Figure 2
Figure 2
ECochG responses in 21 patients with the maximum DIF amplitude at apical electrodes. Responses here have been normalized to the maximum response in each individual, as well as to the electrode with the peak DIF response (P). The amplitudes of the SUM response are reported normalized to the electrode with the peak DIF response. The DIF latency is reported relative to the response on the most basal electrode in each individual. Shaded area represents ± 1 SD.
Figure 3
Figure 3
Comparison of DIF, SUM, and DIF latency responses in 10 participants with a flat response across electrodes 2–22. Note that the horizontal axis in this figure is not normalized to the maximum DIF response as in Figure 2, as these subjects showed a flat response pattern without a distinct maximum.
Figure 4
Figure 4
DIF amplitude across the electrode array in two individuals from the mid-electrode peak group. In these individuals, the mid-electrode peaks were on electrode 12. For (A), the DIF amplitude increased to a second peak on an apical electrode (16). For (B), the DIF amplitude decreases across the final 5 recording electrodes.
Figure 5
Figure 5
DIF, SUM, and DIF latency responses in 8 participants with a mid-electrode peak, for electrodes 2–22.
Figure 6
Figure 6
Changes in DIF and SUM amplitudes and DIF latencies have been aligned to the electrode exhibiting the mid-electrode peak (P). The DIF and SUM responses show peaks on the same electrodes. The DIF latency increased progressively across the peak. Shaded area represents ± 1 SD.
Figure 7
Figure 7
Median HL for the Apical Peak, Flat Response, and Mid-electrode Peak groups, with upper and lower quartile ranges. The Apical Peak group has the best low-frequency thresholds, and the Mid-electrode Peak group has the best high-frequency thresholds. The Flat Response group has poor thresholds across the audiometric range.

References

    1. Adunka O., Roush P., Grose J., Macpherson C., Buchman C. A. (2006). Monitoring of cochlear function during cochlear implantation. Laryngoscope 116, 1017–1020. 10.1097/01.mlg.0000217224.94804.bb - DOI - PubMed
    1. Calloway N., Fitzpatrick D. C., Campbell A. P., Iseli C., Pulver S. H., Buchman C. A., et al. . (2014). Intracochlear electrocochleography during cochlear implantation. Otol. Neurotol. 35, 1451–1457. 10.1097/MAO.0000000000000451 - DOI - PubMed
    1. Campbell L., Kaicer A., Briggs R., O'Leary S. (2015). Cochlear response telemetry: intracochlear electrocochleography via cochlear implant neural response telemetry pilot study results. Otol. Neurotol. 36, 399–405. 10.1097/MAO.0000000000000678 - DOI - PubMed
    1. Campbell L., Kaicer A., Sly D., Iseli C., Wei B., Briggs R., et al. . (2016). Intraoperative real-time cochlear response telemetry predicts hearing preservation in cochlear implantation. Otol. Neurotol. 37, 332–338. 10.1097/mao.0000000000000972 - DOI - PubMed
    1. Choudhury B., Fitzpatrick D. C., Buchman C. A., Wei B. P., Dillon M. T., He S., et al. . (2012). Intraoperative round window recordings to acoustic stimuli from cochlear implant patients. Otol. Neurotol. 33, 1507–1515. 10.1097/MAO.0b013e31826dbc80 - DOI - PMC - PubMed

LinkOut - more resources