. 2017 Feb 8;4(2):160808.
doi: 10.1098/rsos.160808. eCollection 2017 Feb.

Expression and function of ATP-dependent potassium channels in zebrafish islet β-cells

Affiliations

Expression and function of ATP-dependent potassium channels in zebrafish islet β-cells

Christopher H Emfinger et al. R Soc Open Sci. .

Abstract

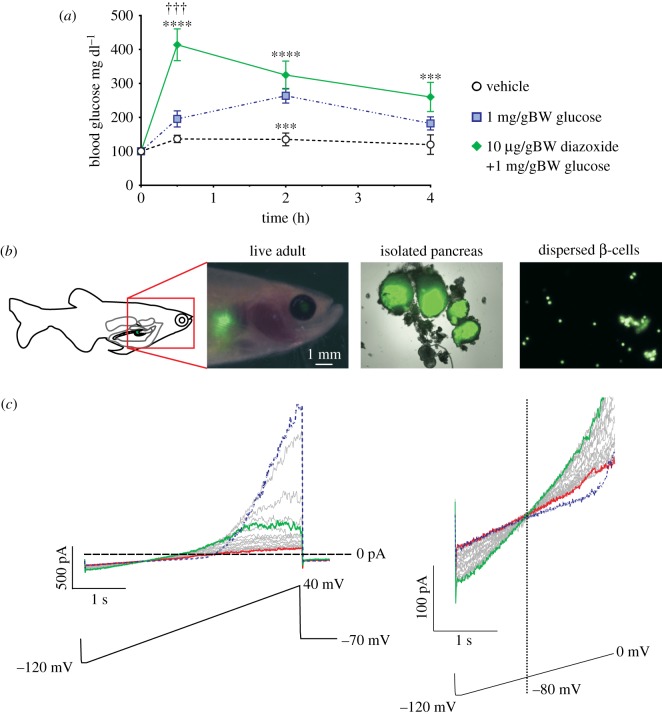
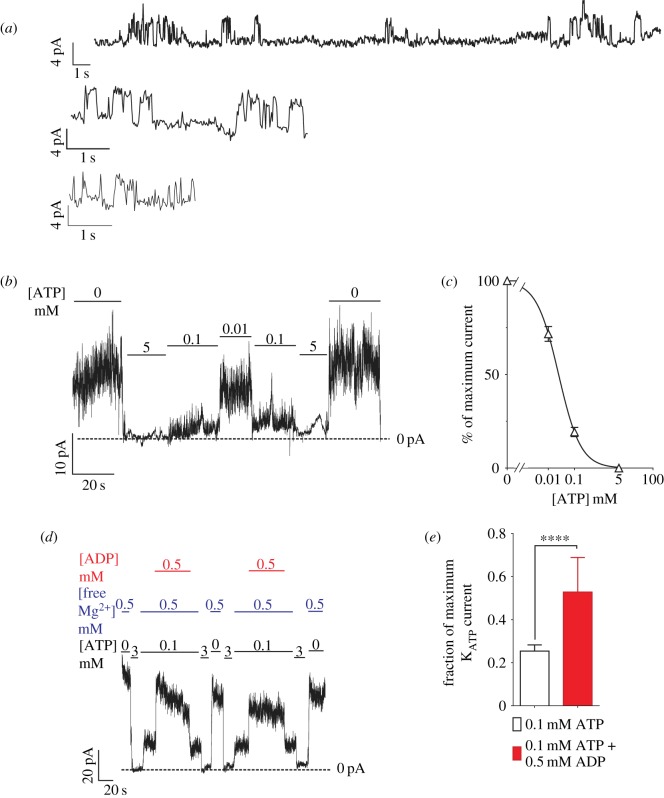
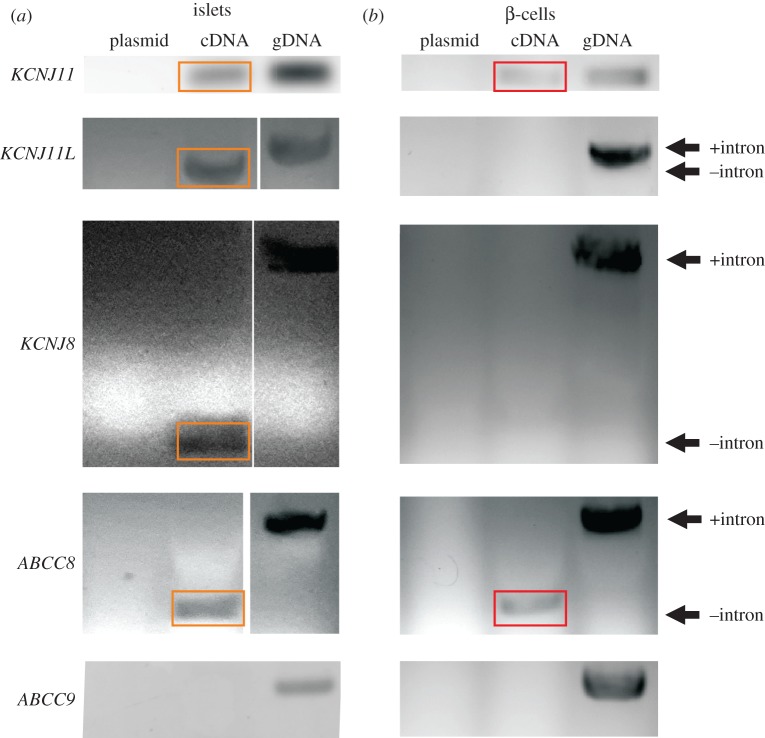
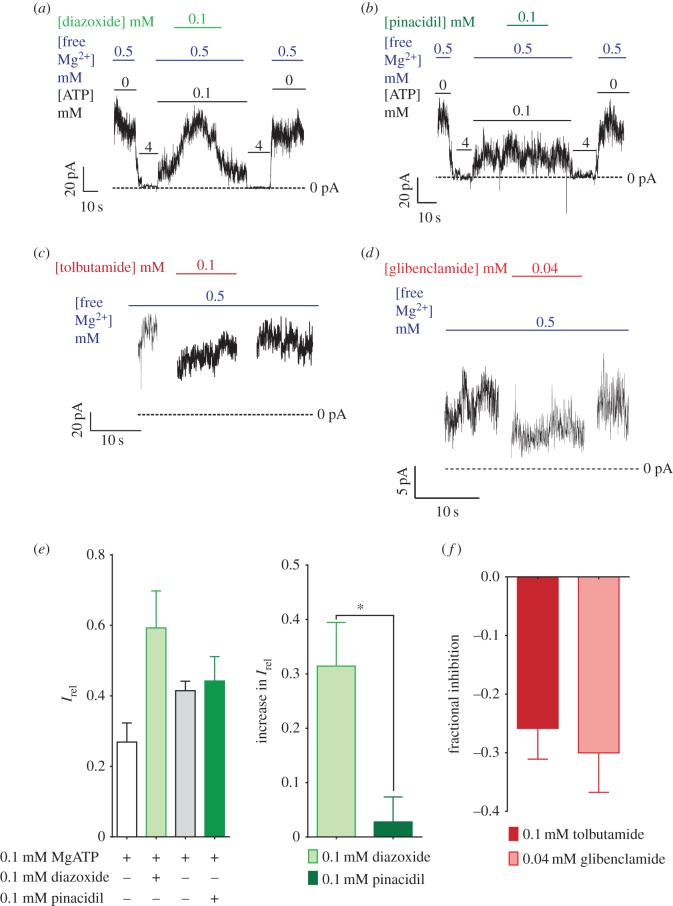
ATP-sensitive potassium channels (KATP channels) are critical nutrient sensors in many mammalian tissues. In the pancreas, KATP channels are essential for coupling glucose metabolism to insulin secretion. While orthologous genes for many components of metabolism-secretion coupling in mammals are present in lower vertebrates, their expression, functionality and ultimate impact on body glucose homeostasis are unclear. In this paper, we demonstrate that zebrafish islet β-cells express functional KATP channels of similar subunit composition, structure and metabolic sensitivity to their mammalian counterparts. We further show that pharmacological activation of native zebrafish KATP using diazoxide, a specific KATP channel opener, is sufficient to disturb glucose tolerance in adult zebrafish. That β-cell KATP channel expression and function are conserved between zebrafish and mammals illustrates the evolutionary conservation of islet metabolic sensing from fish to humans, and lends relevance to the use of zebrafish to model islet glucose sensing and diseases of membrane excitability such as neonatal diabetes.

Keywords: KATP; ion channels; metabolism; pancreas; zebrafish.


Figures

Figure 1.
Figure 1.
Whole-cell voltage-clamp of zebrafish β-cells reveals functional KATP channels. (a) Glucose tolerance in adult zebrafish. Blood glucose at each time point in (a) was compared between groups by ANOVA with Tukey's multiple comparisons on log-transformed datasets. n = 7–13 at each time point except for the baseline values which were 24. ***p < 0.001, group versus vehicle; ****p < 0.0001, group versus vehicle; p-values are from Tukey's multiple comparisons test following ANOVA of log-transformed values. †††p < 0.001, group versus glucose, also from Tukey's multiple comparisons test. Data in this panel are compiled from multiple injection experiments performed over several days. (b) Expression of eGFP in the fish pancreas allows visualization of β-cells in live adults (left image), isolated islets (middle image) and dispersed β-cells (right image). Scale is indicated for the live adult image. The middle and right images are at 20× and 40×, respectively. For image panels, bright-field and fluorescence images were superimposed for adult fish and whole islets. Adult fish bright-field image was contrast-enhanced prior to superimposing it with the fluorescence image to enhance visibility in the final combined image. (c) Whole-cell voltage-clamp detection of KATP in zebrafish β-cells. Voltage ramps (lower) were applied from −120 to +40 mV over 4 s. Following break-in, the initial ramp (blue) elicits large voltage-dependent K currents above −30 mV. These currents gradually run down in successive voltage ramps, and a weakly inwardly rectifying KATP conductance gradually increases to maximal (green) and then in turn runs down to baseline (red). Right panel shows currents between −120 and 0 mV for more clear visualization of KATP currents.
Figure 2.
Figure 2.
Excised-patch clamp reveals functional properties of KATP channels in zebrafish β-cells. (a) Individual KATP channels (4.35 pA at −50 mV) are detected in three representative membrane patches excised from zebrafish β-cells. (b) These K+ currents are inhibited by ATP, with (c) IC50 = 22.6 mM, nH = 1.01. (d) These channels are also activated by increasing [Mg-ADP], quantified in (e). ****p < 0.0001 (Mann–Whitney test). The dose–response curve was generated from 16 cells derived from six pools of zebrafish islet (biological replicates). The ADP response graph comprises nine cells derived from four biological replicates. (a,b and d) Representative traces.
Figure 3.
Figure 3.
Zebrafish β-cell KATP channels are similar in composition to mammalian β-cell KATP channels. (a) PCR of RNA-derived cDNA from different pools of islets shows bands for orthologues of KCNJ11 (Kir6.2), KCNJ8 (Kir6.1), KCNJ11 L (Kir6.3) and ABCC8 (SUR1), but no bands for ABCC9 (SUR2). Plasmid DNA is a negative control for non-specific replication by primer mix; genomic DNA (gDNA) is a positive control for presence of target genes. These reactions were repeated over n ≥ 5 separate pools of cDNA and gDNA for validation. Primers for KCNJ11 L, KCNJ8 and ABCC8 span exons to distinguish gDNA from cDNA. There are no introns in KCNJ11. (b) PCR of RNA-derived cDNA from eGFP-sorted β-cells shows bands for orthologues of KCNJ11 and ABCC8, but no bands for the other subunits. Images were cropped and resized, and in some cases contrast-enhanced to improve clarity. Original images are in the electronic supplementary material, figures S4 and S5. Orange and red boxes highlight transcript presence in islet and β-cell cDNAs, respectively.
Figure 4.
Figure 4.
Zebrafish β-cell KATP channels exhibit similar in pharmacology to mammalian β-cell KATP channels. Zebrafish β-cell KATP channels show activation by diazoxide (a) but not by pinacidil (b) in excised patches. These channels also show inhibition by both tolbutamide (c) and glibenclamide (d). (e,f) Quantification of activation (e) and inhibition (f) of the KATP channels. Asterisk indicates p < 0.05 by the Mann–Whitney test. In (e), the right panel indicates the increase in Irel produced by each drug, whereas the left panel indicates the fraction of overall maximum current in each condition. These are quantified from recordings of six cells for diazoxide, four cells for pinacidil and glibenclamide, and five cells for tolbutamide.

References

    1. Keane K, Newsholme P. 2014. Metabolic regulation of insulin secretion. Vitamins Horm. 95, 1–33. (doi:10.1016/B978-0-12-800174-5.00001-6) - DOI - PubMed
    1. Drews G, Krippeit-Drews P, Dufer M. 2010. Electrophysiology of islet cells. In The islets of langerhans (ed. Islam MS.), pp. 115–163. Dordrecht, The Netherlands: Springer. - PubMed
    1. Remedi MS, Nichols CG. 2009. Hyperinsulinism and diabetes: genetic dissection of beta cell metabolism-excitation coupling in mice. Cell Metab. 10, 442–453. (doi:10.1016/j.cmet.2009.10.011) - DOI - PMC - PubMed
    1. Koster JC, Permutt MA, Nichols CG. 2006. Diabetes and insulin secretion: the ATP-sensitive K+ channel (KATP) connection. Diabetes 54, 3065–3072. (doi:10.2337/diabetes.54.11.3065) - DOI - PubMed
    1. Gloyn AL, et al. 2004. Activating mutations in the gene encoding the ATP-sensitive potassium-channel subunit Kir6.2 and permanent neonatal diabetes. N. Engl. J. Med. 350, 1838–1849. (doi:10.1056/NEJMoa032922) - DOI - PubMed