. 2017 Jul;134(1):15-34.
doi: 10.1007/s00401-017-1706-x. Epub 2017 Apr 6.

Differential contribution of immune effector mechanisms to cortical demyelination in multiple sclerosis

Affiliations

Differential contribution of immune effector mechanisms to cortical demyelination in multiple sclerosis

Nielsen Lagumersindez-Denis et al. Acta Neuropathol. 2017 Jul.

Abstract

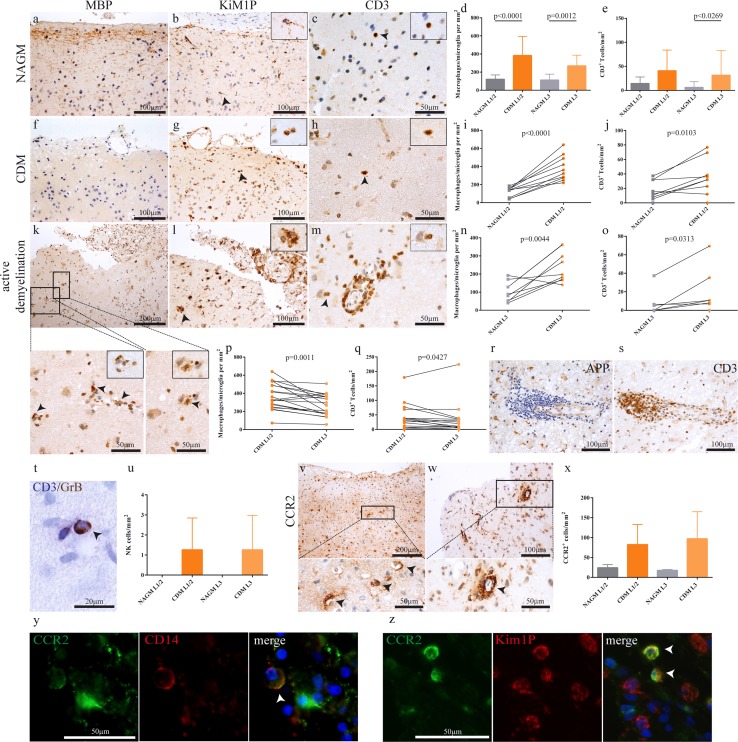
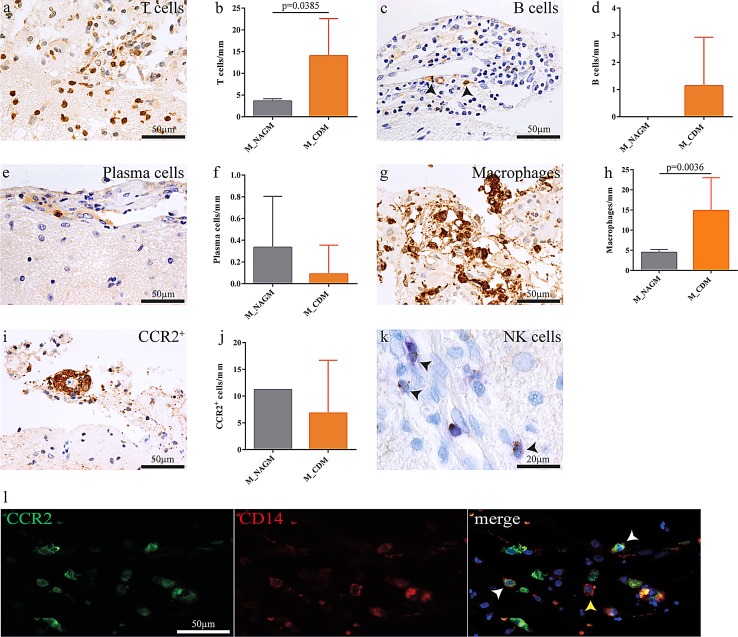
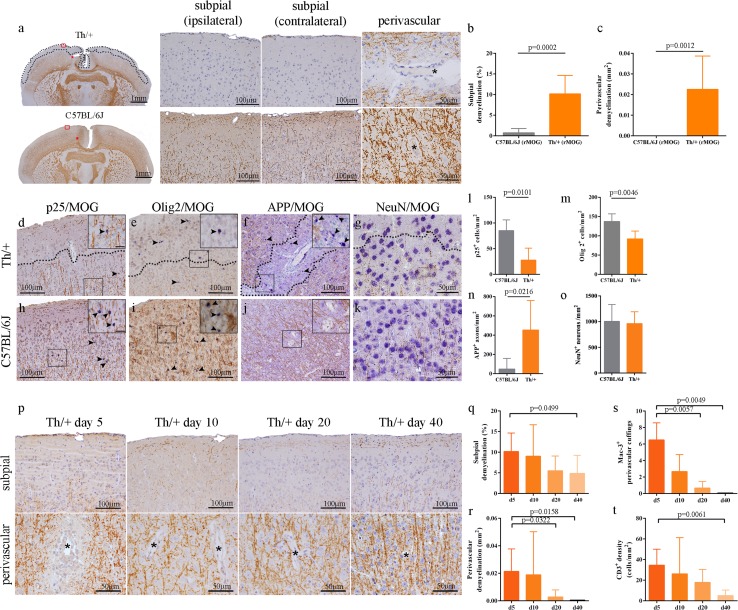
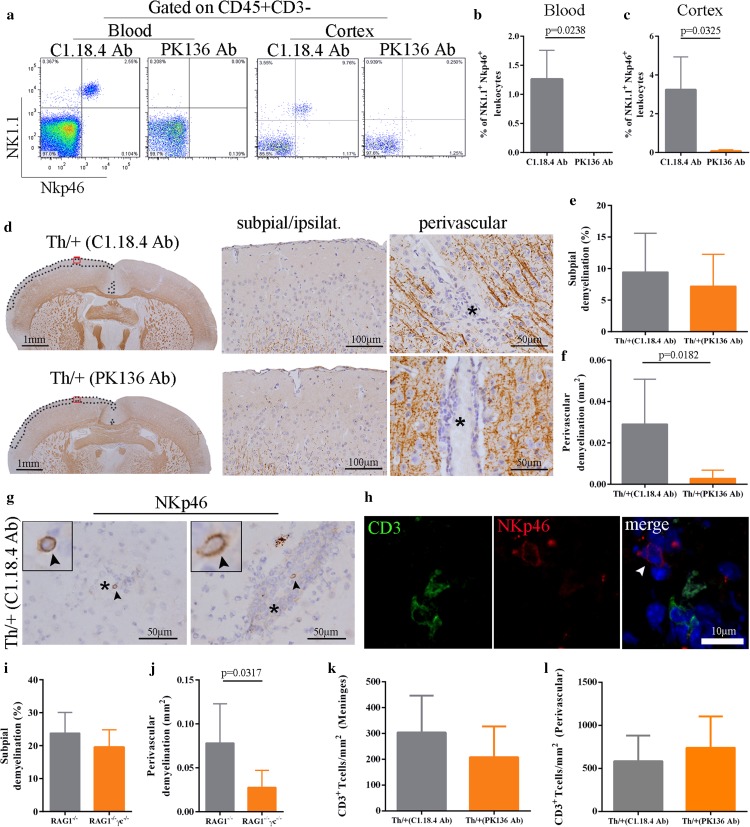
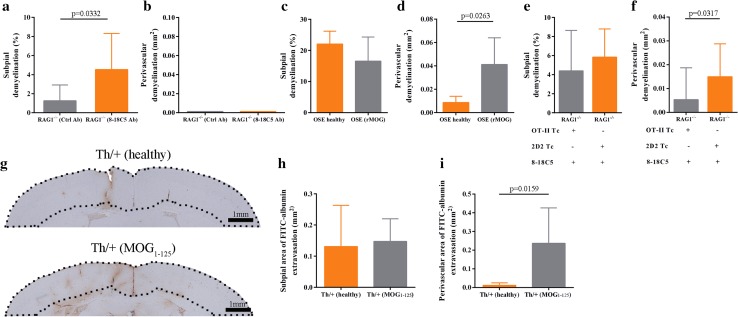
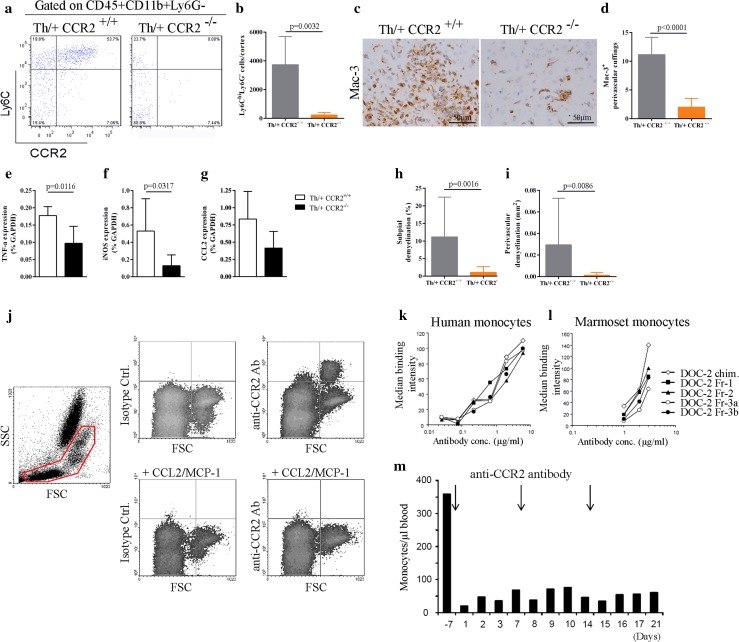
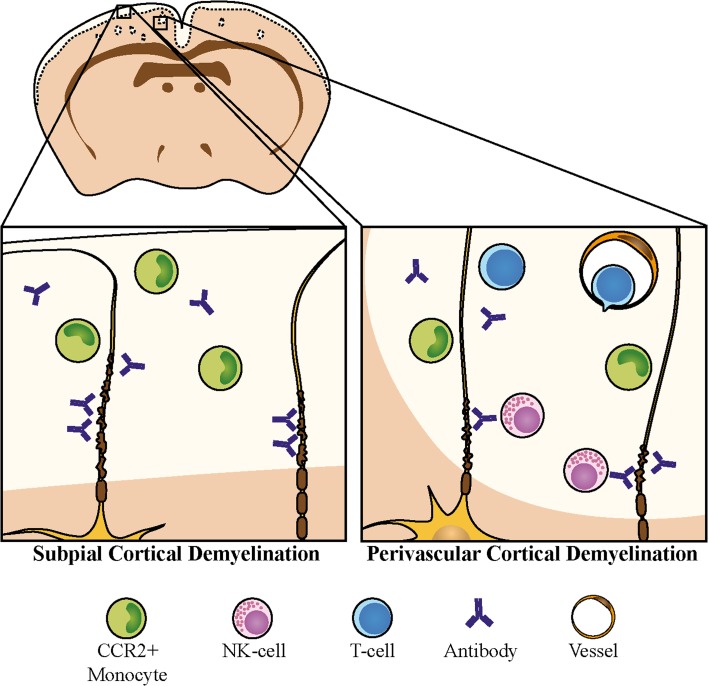
Cortical demyelination is a widely recognized hallmark of multiple sclerosis (MS) and correlate of disease progression and cognitive decline. The pathomechanisms initiating and driving gray matter damage are only incompletely understood. Here, we determined the infiltrating leukocyte subpopulations in 26 cortical demyelinated lesions of biopsied MS patients and assessed their contribution to cortical lesion formation in a newly developed mouse model. We find that conformation-specific anti-myelin antibodies contribute to cortical demyelination even in the absence of the classical complement pathway. T cells and natural killer cells are relevant for intracortical type 2 but dispensable for subpial type 3 lesions, whereas CCR2+ monocytes are required for both. Depleting CCR2+ monocytes in marmoset monkeys with experimental autoimmune encephalomyelitis using a novel humanized CCR2 targeting antibody translates into significantly less cortical demyelination and disease severity. We conclude that biologics depleting CCR2+ monocytes might be attractive candidates for preventing cortical lesion formation and ameliorating disease progression in MS.

Keywords: Cortical demyelination; Experimental autoimmune encephalomyelitis; Inflammatory monocytes; Progressive multiple sclerosis.


Conflict of interest statement

MM, MP and WB hold a patent (9068002) for the depletion of CCR2+ monocytes in MS.

Figures

Fig. 1
Fig. 1
Increased adaptive and innate immune cell infiltration in demyelinated as compared to normal appearing cortical gray matter. In comparison with regularly myelinated normal appearing cortical gray matter (ac), demyelinated cortex obtained at biopsy (fh) shows higher densities of KiM1P+ macrophages/activated microglia (d, g, i, n) and T cells (e, h, j, o). An example of a cortical lesion with ongoing demyelination as evidenced by MBP-laden phagocytes (arrows, km). In addition to foamy macrophages (k, l), T cells are found perivascularly, as well as in the parenchyma (m). A gradient of macrophage/microglia (p) and T cell densities (q) is apparent with higher densities in the superficial cortical layers 1/2 compared to layer 3. Multilayered perivascular T cell cuffs in the cortex, identified by the presence of APP+ neurons, were only seen in rare cases (r, s). The patient shown here presented with neuropsychiatric symptoms (patient no. 25). GrB+/CD3 natural killer (NK) cells were observed perivascularly and only in demyelinated, but not normal appearing cortex (t, u, arrow). CCR2+ monocytes were mainly observed perivascularly, with some cells scattered in the parenchyma (v, w, x). CCR2/CD14 double-positive cells were observed perivascularly in patients with ongoing demyelination, indicating active myeloid cell recruitment into the cortex (y, arrows). Fluorescent double-immunohistochemistry of CCR2 and the pan-macrophage marker KiM1P identifies CCR2/KiM1P double-positive cells (z). All data are presented as mean ± SD. d, e One-way ANOVA followed by Dunn's Multiple Comparison post hoc test; i, j, n paired t test; o Wilcoxon signed-rank test; p, q paired t test and Wilcoxon matched pairs signed-rank test. All immunohistochemistries were performed with diaminobenzidine (DAB; brown color), except for CD3 (Fast Blue, in double labelling with GrB). Cell nuclei are counterstained with hematoxylin. APP amyloid precursor protein, NAGM normal appearing cortical gray matter, CDM cortical demyelination, GrB granzyme B, L1/2 cortical layer 1 and 2, L3 cortical layer 3
Fig. 2
Fig. 2
The intensity of meningeal inflammation associates with cortical demyelination. Meningeal inflammation, mostly arranged in a perivascular fashion, was found adjacent to demyelinated and non-demyelinated cortical areas. T lymphocyte (a, b) and macrophage (g, h) infiltration was significantly higher in areas overlying demyelinated cortex. Also, macrophages and T cells were more abundant than B cells (c, d) and plasma cells (e, f). NK cells were exceedingly rare (k). CCR2+ monocytes were found perivascularly in the leptomeninges overlying both demyelinated and normal-appearing cortical gray matter (i, j). Meningeal CD14+ CCR2+ and CD14+ CCR2 monocytes overlying an actively demyelinating cortical lesion in a patient with monocyte invasion into the subpial cortex (l). Data are presented as mean ± SD; Mann–Whitney test
Fig. 3
Fig. 3
Cortical demyelination in Th/+ mice with demyelinating antibodies. a Subpial and perivascular cortical demyelination as assessed by immunohistochemistry (IHC) for MBP (brown color) on day 5 after stereotactic cytokine injection in Th/+ mice (top) and C57BL/6J mice (bottom). b, c Subpial cortical demyelination was quantified on MBP-immunostained brain sections as percentage of total cortical area of the injected hemisphere. The extent of perivascular cortical demyelination is given in mm2 (C57BL/6: n = 5; Th/+: n = 13). Data are from three independent experiments and presented as mean ± SD; Mann–Whitney test. Representative IHC of mature oligodendrocytes (d, h), oligodendroglial cells including OPC (e, i), axons (f, j) and neurons (g, k) in cortical demyelinated areas of Th/+ (top) and corresponding non-demyelinated cortex in C57BL/6J mice (bottom). Cell markers are depicted in blue (Fast Blue), myelin oligodendrocyte glycoprotein (MOG) in brown (DAB). Exemplary APP+ axons as well as p25+ and Olig2+ cells are indicated by arrowheads and shown in greater detail (insets). Dotted lines in the images mark the border between demyelinated and non-demyelinated cortical areas. Scale bars: insets 20 µm. Densities of p25+ oligodendrocytes (l), Olig2+ cells (m), APP+ damaged axons (n) and NeuN+ neurons (o) were determined in subpial cortical demyelination in Th/+ mice and corresponding cortical layers in C57BL/6J mice. A total of 7 Th/+ and 5 C57BL/6J mice were analyzed in two independent experiments and are presented as mean ± SD; Mann–Whitney test. pt Resolution of inflammation and lesion repair of cortical demyelination in Th/+ mice. The extent of subpial and perivascular cortical demyelinated lesions was assessed by MBP IHC on days 5, 10, 20 and 40 post cytokine injection (p). Asterisks mark parenchymal vessels. (q, r) Quantitative analysis of subpial cortical demyelination and perivascular cortical demyelination (d5: n = 13, three independent experiments; days 10, 20, 40: n = 6 each, two independent experiments). Data are presented as mean ± SD; one-way ANOVA followed by Dunn's Multiple Comparison post hoc analysis. Quantification of Mac-3 (macrophages, s) and CD3 (T cells, t) IHC on days 5, 10, 20 and 40 post stereotactic cortical cytokine injections. Representative data of two independent experiments for each time point presented as mean ± SD. Mac-3 (n = 6, for each day), T cells (n = 6, d5 and d20; n = 5, d10 and d40); one-way ANOVA followed by Dunn's Multiple Comparison post hoc analysis
Fig. 4
Fig. 4
The classical complement pathway does not substantially contribute to cortical demyelination. a, b Quantitative assessment of subpial and perivascular cortical demyelination in MBP-immunostained brain sections of cytokine injected Th/+ mice, which received the C5 convertase blocking antibody BB5.1 or an isotype control antibody (n = 9 animals/group, analyzed in two independent experiments; unpaired t test). c, d Quantitative assessment of subpial and perivascular cortical demyelination in MBP-immunostained brain sections of C1q−/− or C57BL/6 (C1q+/+) mice, which received 1.5 mg of the MOG-specific, complement-fixing antibody Z2 i.v. prior to stereotactic cytokine injections. e, f Quantitative assessment of subpial and perivascular cortical demyelination in MBP-immunostained brain sections of Th/+ C1q−/− (n = 6) and Th/+ C1q+/+ (n = 9) mice; representative data of two independent experiments. g, h Quantitative assessment of subpial and perivascular cortical demyelination in MBP-immunostained brain sections of Th/+ CD59a−/− and Th/+ CD59a+/+ mice; n = 9/group, representative data of two independent experiments. i Leukocyte subsets in cortical demyelination. Leukocytes isolated from the demyelinated cortex of Th/+ mice (n = 3) were analyzed by multicolor flow cytometry on day 2 post injection. All data are presented as mean ± SD
Fig. 5
Fig. 5
NK cells contribute to perivascular cortical demyelination. ac Analysis of NK depletion efficiency in the blood (before stereotactic injection) and in the cortex (d5 after stereotactic injection) of Th/+ mice by multicolor flow cytometry. b, c Quantification of NK cells in the blood (b) and the cortex (c) of NK cell depleted (PK136 antibody, n = 4) and control mice (C1.18.4 antibody, n = 3). Data are given as mean ± SD and were analyzed in two independent experiments; Mann–Whitney test. d Subpial and perivascular cortical demyelination as assessed by IHC for MBP (brown color) on day 5 after stereotactic cytokine injection in NK cell depleted Th/+ mice (PK136 antibody, bottom) and controls (C.1.18.4 antibody, top). Red squares in the brain overviews mark the magnified areas in the subpial ipsilateral photographs. Dotted lines define the respective subpial demyelinated areas. Vessel lumina are marked by asterisks. e, f Quantitative analysis of subpial and perivascular cortical demyelination in MBP-immunostained brain sections of 7 animals per group. Data are presented as mean ± SD and were analyzed in two independent experiments; unpaired t test with Welch correction. g Representative IHC of perivascularly located NK cells (NKp46, arrowheads) in the cortex of Th/+ mice. Asterisks mark the vessel lumen. h Immunohistochemical double-labelling of NKp46 (red) and CD3 (green). A perivascular NK cell is marked with a white arrowhead. Nuclei were counterstained with DAPI (blue signal). i, j Quantitative analysis of subpial and perivascular cortical demyelination in 2D2 T cell and anti-MOG antibody (Z2) transferred RAG1−/− (n = 5) and RAG1−/− γc−/− mice (n = 4). k, l Quantitative analysis of meningeal and perivascular CD3+ T cells in NK cell depleted Th/+ mice and controls. Data are presented as mean ± SD analyzed in three independent experiments; Mann–Whitney test
Fig. 6
Fig. 6
Encephalitogenic T cells are dispensable for subpial but not for perivascular demyelination. a, b Quantitative analysis of subpial and perivascular cortical demyelination in 8–18C5 (n = 8) and control antibody (n = 9) transferred RAG1−/− mice analyzed in two independent experiments. Data are presented as mean ± SD; unpaired t test. c, d Quantitative analysis of subpial and perivascular cortical demyelination in healthy (n = 4) and diseased OSE mice (n = 8) analyzed in two independent experiments. Data are given as mean ± SD; Mann–Whitney test. e, f Quantitative analysis of subpial and perivascular cortical demyelination in 2D2 Tc/8-18C5 antibody transferred RAG1−/− mice (n = 6) and OT-II Tc/8-18C5 antibody transferred RAG1−/− mice (n = 12). Representative data of two independent experiments are presented as mean ± SD; Mann–Whitney test. g Assessment of FITC-albumin extravasation by IHC in healthy (top) and diseased Th/+ mice (bottom) 24 h after stereotactic cytokine injection into the motor cortex. Dotted lines mark the cortical area where FITC-albumin extravasation was quantified. h, i Quantification of FITC-albumin extravasation in healthy (n = 4) and diseased Th/+ mice (n = 5). Data are presented as mean ± SD; Mann–Whitney test
Fig. 7
Fig. 7
Inflammatory monocytes are indispensable for cortical demyelination in Th/+ mice. a Representative density plots of inflammatory monocytes (CD45+CD11b+Ly6ChiLy6G-) isolated from the cortex of Th/+ CCR2+/+ and Th/+ CCR2−/− mice on day 2 post stereotactic injection. b Cortical inflammatory monocytes were quantified by flow cytometry in seven animals/group analyzed in three independent experiments and presented as mean ± SD; unpaired t test with Welch correction. c Representative IHC for activated microglia/macrophages (Mac-3) in Th/+ CCR2+/+ mice (left) and Th/+ CCR2−/− mice (right). d The number of Mac-3+ intracortical perivascular cuffings was assessed in Th/+ CCR2+/+ and Th/+ CCR2−/− mice and presented as mean ± SD; n = 6 mice per group, analyzed in two independent experiments; unpaired t test. e–g Quantitative real-time PCR analysis of monocyte-related cytokines and chemokines in the cortex of Th/+ CCR2+/+ (white bars) and Th/+ CCR2−/– mice (black bars) on day 2 after stereotactic injection. Results are normalized against GAPDH expression. One representative experiment is shown, n = 5 animals per group; Mann–Whitney test. h, i Quantification of subpial and perivascular cortical demyelination in Th/+ CCR2+/+ (n = 13) and Th/+ CCR2−/− mice (n = 5). Data of three independent experiments are shown and expressed as mean ± SD. Mann–Whitney test. j Representative flow cytometry dot plots of marmoset blood. The monoclonal mouse anti-human CCR2 antibody DOC-2 (upper panel right), but not the isotype control antibody (upper panel left) binds to marmoset monocytes. Binding of DOC-2 antibodies to monocytes is lost, if CCR2 is internalized by pretreatment of the cells with CCL2 (1 µg/ml) for 30 min at 37 °C (lower panel), demonstrating target specificity. k, l Representative plot for titrated humanized DOC-2 antibodies (named DOC-2 Fr) demonstrating their preserved capability to bind to human (left panel) and marmoset monocytes (right panel) after humanization. m Monocyte concentrations in the blood of healthy marmosets treated weekly with 5 mg/kg i.v. of DOC-2 Fr-2
Fig. 8
Fig. 8
Depletion of CCR2+ monocytes in marmosets with EAE ameliorates cortical demyelination. a Schematic representation of the treatment protocol for marmoset monkeys. be Analysis of immune cell subpopulations in the blood of marmosets with EAE in response to injections of 5 mg/kg DOC-2 Fr2 (twice weekly d14–d28; once weekly d28-56). f Representative overview of coronal brain sections immunostained for MBP (brown). Subpial cortical demyelinated regions (black dotted lines) and perivascular cortical demyelinated areas (red lines) are highlighted. g, h The extent of subpial and perivascular cortical demyelination was measured on MBP-immunostained sections of DOC-2 Fr-2 (anti-CCR2, n = 5) and Ctrl-antibody (n = 5) injected marmosets; Mann–Whitney test. i Clinical disease severity of anti-CCR2 or isotype control treated marmosets (n = 5/group; *p < 0.05, one sided Mann–Whitney test)
Fig. 9
Fig. 9
Differential involvement of immune effector mechanisms in perivascular type 2 and subpial type 3 cortical demyelination. Whereas subpial cortical demyelination occurs in the absence of an adaptive immune response, executed by the concerted action of pro-inflammatory cytokines, demyelinating antibodies, and CCR2+ monocytes, activated encephalitogenic T cells and NK cells substantially amplify perivascular cortical demyelination

References

    1. Absinta M, Rocca MA, Moiola L, Copetti M, Milani N, Falini A, Comi G, Filippi M. Cortical lesions in children with multiple sclerosis. Neurology. 2011;76:910–913. doi: 10.1212/WNL.0b013e31820f2e69. - DOI - PubMed
    1. Absinta M, Vuolo L, Rao A, Nair G, Sati P, Cortese IC, Ohayon J, Fenton K, Reyes-Mantilla MI, Maric D, et al. Gadolinium-based MRI characterization of leptomeningeal inflammation in multiple sclerosis. Neurology. 2015;85:18–28. doi: 10.1212/WNL.0000000000001587. - DOI - PMC - PubMed
    1. Albert M, Antel J, Bruck W, Stadelmann C. Extensive cortical remyelination in patients with chronic multiple sclerosis. Brain Pathol. 2007;17:129–138. doi: 10.1111/j.1750-3639.2006.00043.x. - DOI - PMC - PubMed
    1. Barnden MJ, Allison J, Heath WR, Carbone FR. Defective TCR expression in transgenic mice constructed using cDNA-based alpha- and beta-chain genes under the control of heterologous regulatory elements. Immunol Cell Biol. 1998;76:34–40. doi: 10.1046/j.1440-1711.1998.00709.x. - DOI - PubMed
    1. Bettelli E, Baeten D, Jager A, Sobel RA, Kuchroo VK. Myelin oligodendrocyte glycoprotein-specific T and B cells cooperate to induce a Devic-like disease in mice. J Clin Investig. 2006;116:2393–2402. doi: 10.1172/JCI28334. - DOI - PMC - PubMed

Publication types

MeSH terms