. 2017 Apr 7:8:14819.
doi: 10.1038/ncomms14819.

Retrograde transport of TrkB-containing autophagosomes via the adaptor AP-2 mediates neuronal complexity and prevents neurodegeneration

Affiliations

Retrograde transport of TrkB-containing autophagosomes via the adaptor AP-2 mediates neuronal complexity and prevents neurodegeneration

Natalia L Kononenko et al. Nat Commun. .

Abstract

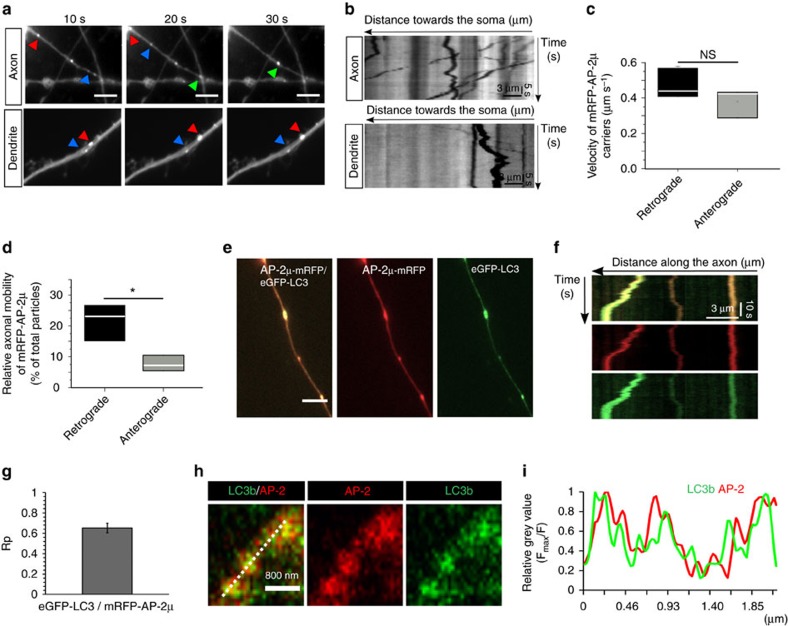
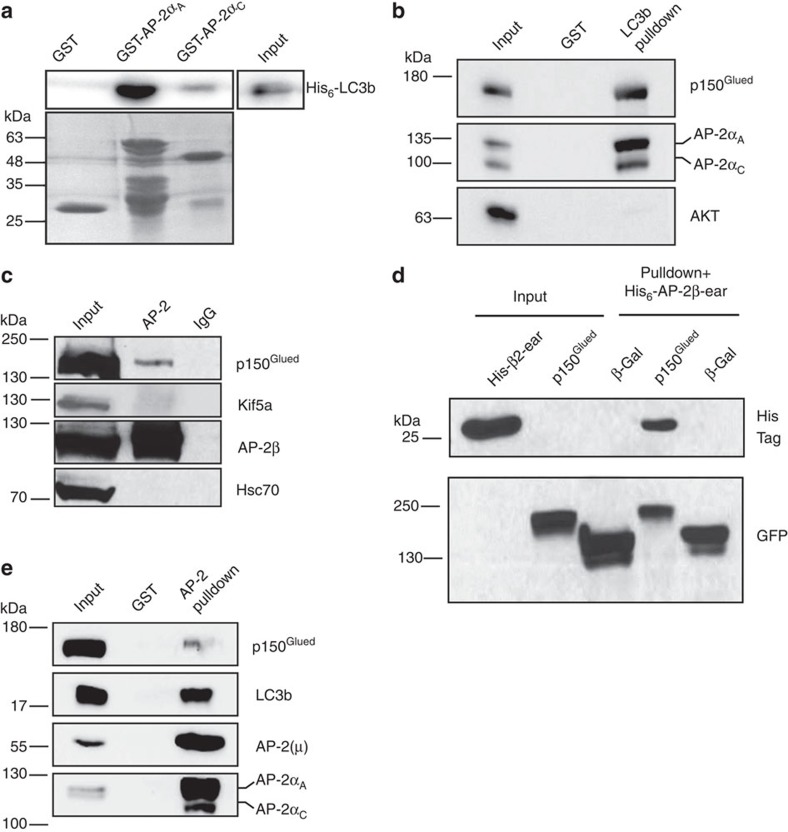
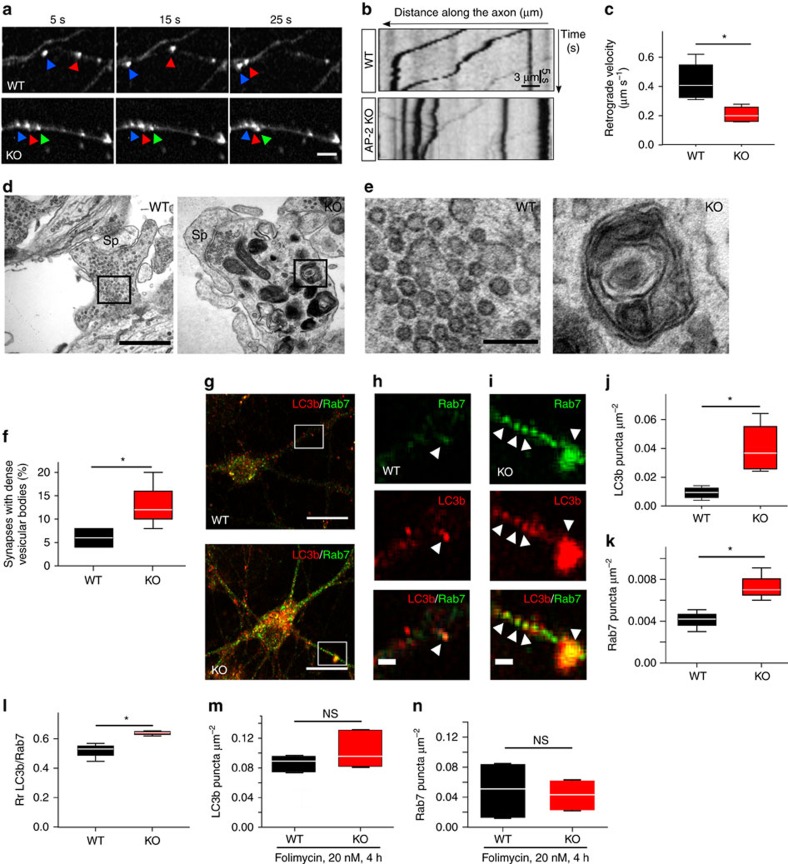
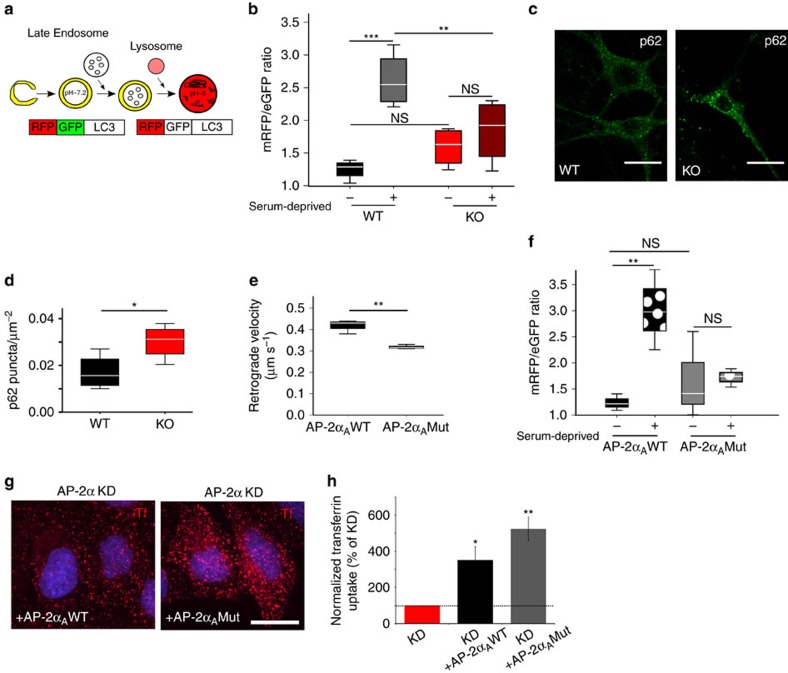
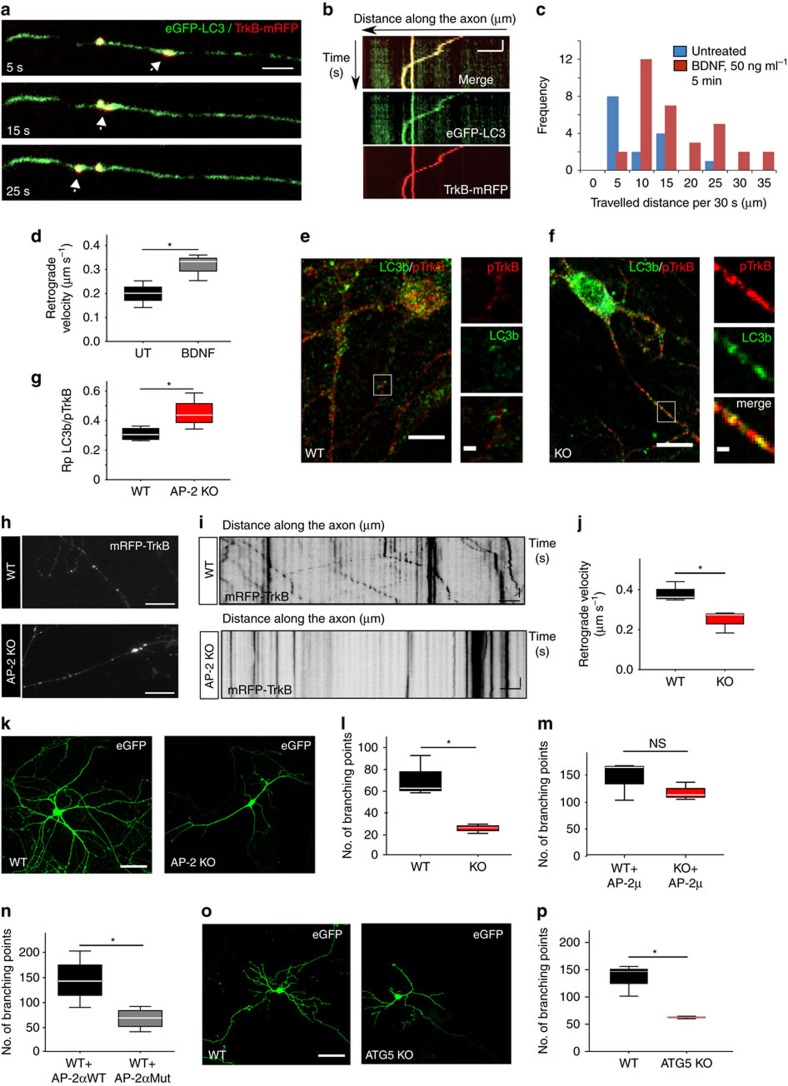
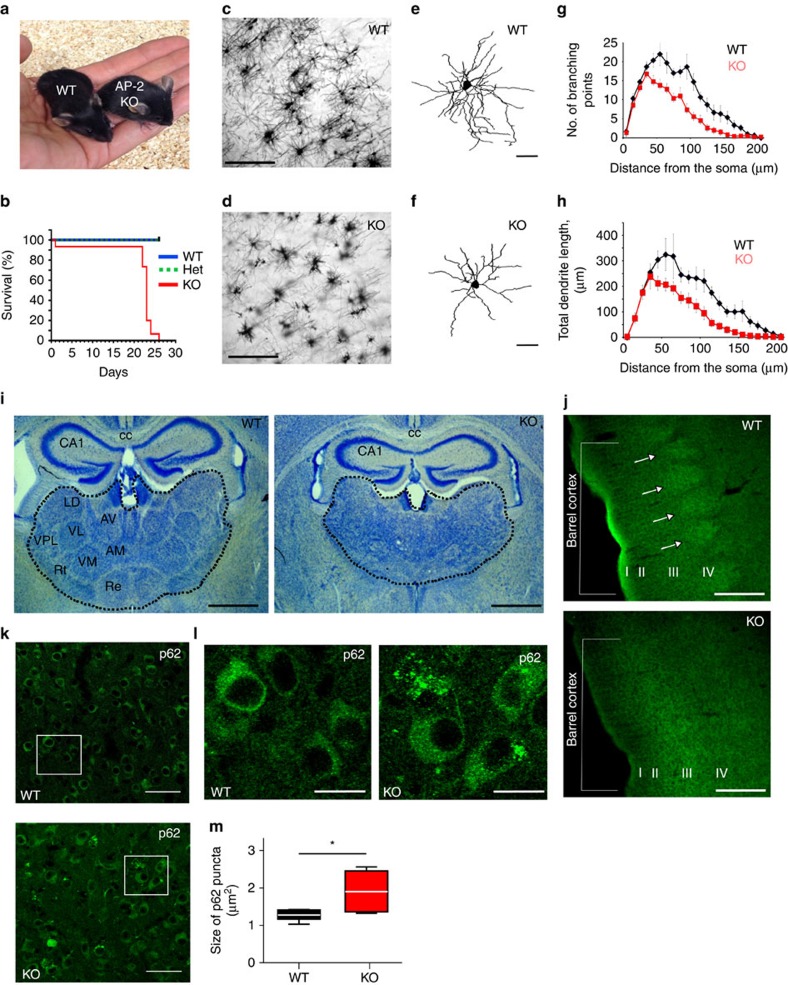
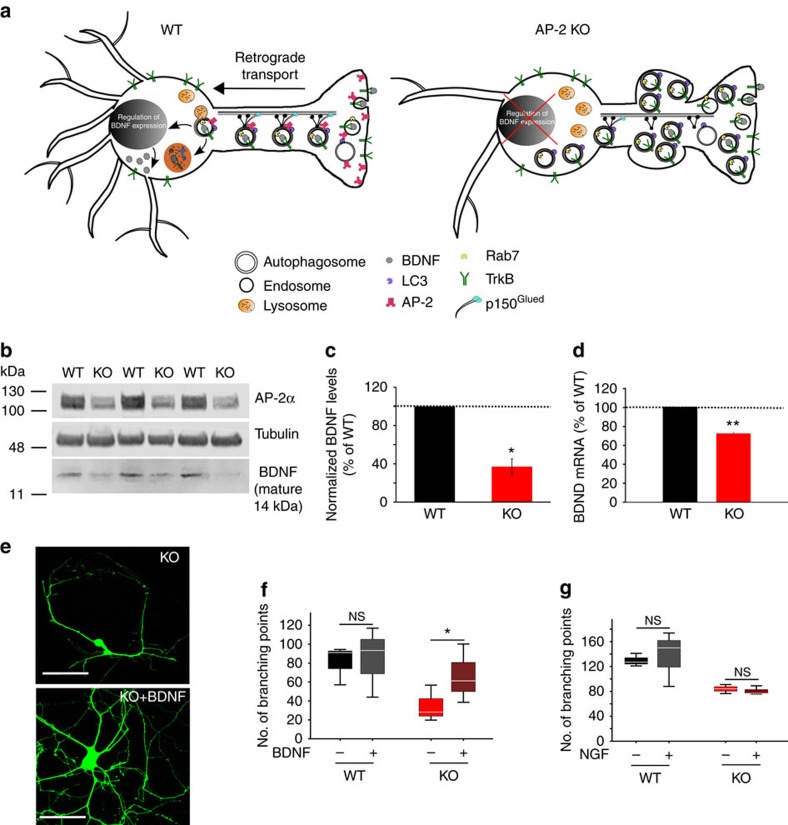
Autophagosomes primarily mediate turnover of cytoplasmic proteins or organelles to provide nutrients and eliminate damaged proteins. In neurons, autophagosomes form in distal axons and are trafficked retrogradely to fuse with lysosomes in the soma. Although defective neuronal autophagy is associated with neurodegeneration, the function of neuronal autophagosomes remains incompletely understood. We show that in neurons, autophagosomes promote neuronal complexity and prevent neurodegeneration in vivo via retrograde transport of brain-derived neurotrophic factor (BDNF)-activated TrkB receptors. p150Glued/dynactin-dependent transport of TrkB-containing autophagosomes requires their association with the endocytic adaptor AP-2, an essential protein complex previously thought to function exclusively in clathrin-mediated endocytosis. These data highlight a novel non-canonical function of AP-2 in retrograde transport of BDNF/TrkB-containing autophagosomes in neurons and reveal a causative link between autophagy and BDNF/TrkB signalling.


Conflict of interest statement

The authors declare no competing financial interests.

Figures

Figure 1
Figure 1. Retrograde co-trafficking of adaptor protein complex 2 (AP-2) and LC3 in cultured cortico-hippocampal neurons.
(ad) Dynamics of AP-2μ-mRFP transport in neurons. (a) Representative time series and corresponding kymographs (b) of AP-2μ-mRFP-positive puncta in axons and dendrites in control neurons. Coloured arrows in a indicate retrograde carriers. See also overview in Supplementary Fig. 1a. Scale bars, 5 μm. (c) Mean retrograde and anterograde velocities of AP-2μ-mRFP-positive carriers in axons (retrograde: 0.47±0.04 μm s−1, anterograde: 0.38±0.04 μm s−1, P=0.246, n=3 independent experiments). NS, non-significant. (d) AP-2μ-mRFP carriers preferentially undergo retrograde movement (21.6±3%) in comparison to anterograde movement (7.7±1.3%, *P=0.02, n=3 independent experiments) in axons. (eg) AP-2μ-mRFP associates with autophagosomes in axons. (e,f) Representative time series and corresponding kymographs showing the colocalization (e) and cotransport (f) of AP-2μ-mRFP with eGFP-LC3b-labelled autophagosomes. (g) Bar diagram representing the colocalization of AP-2μ-mRFP with eGFP-LC3b in neurons based on Pearson's coefficient (Rp) (Rp: 0.65±0.05). Rp was calculated for 26 regions of interest (ROI, 5.1 × 4.3 μm) per condition from n=3 independent experiments. Scale bar in e, 5 μm. (h,i) Time-gated stimulated emission depletion (STED) microcopy analysis of endogenous AP-2 and LC3 localization in neurons acutely treated with folimycin to inhibit lysosomal proteolysis of autophagosomes (20 nM, 4 h). Representative images (h) and corresponding line scans (i) of neuronal processes immunostained for endogenous AP-2α and LC3b. See also overview in Supplementary Fig. 1j. Scale bar in h, 800 nm. Data in c,d are illustrated as box plots as described in Methods. Data in g and all data reported in the text are mean±s.e.m.
Figure 2
Figure 2. Direct binding of AP-2α to LC3b and association with p150Glued/dynactin.
(a) Upper panel: purified recombinant LC3b-His6 detected by immunoblotting directly binds to GST-AP-2αΑ with preference (about threefold) over GST-AP-2αC. Input, 2% of the total recombinant LC3b added to the assay. Lower panel: ponceau-stained membrane. Example from n=3 independent experiments. (b) Complex formation of neuronal AP-2 with LC3b and the p150Glued subunit of dynactin. Affinity purifications of mouse brain lysates using GST-LC3b as bait co-purified AP-2αA and, to a lesser extent AP-2αC, as well as p150Glued, but not the negative control protein Akt. Input, 1.5% of lysate added to the assay. Representative example from n=4 independent experiments. (c) Co-immunoprecipitation of endogenous AP-2 with p150Glued, but not with Kif5A from rat brain lysate using antibodies against AP-2β. Hsc70, used as a negative control, was not co-precipitated. Input, 10% of lysate added to the assay. Representative example from n=3 independent experiments. (d) AP-2β-ear interacts with p150Glued. AviGFP-tagged p150Glued or β-galactosidase were expressed together with BirA in HEK293T cells, affinity-purified using M-280 streptavidin Dynabeads, incubated with recombinant His6-AP-2β-ear and analysed by immunoblotting. Input, 10% of lysate added to the assay. Representative example from n=3 independent experiments. (e) AP-2 interacts with LC3b and p150Glued. Affinity purifications using a GST-tagged N-terminal fragment of Stonin 2 as bait co-purified endogenous AP-2 (detected via its μ and α subunits), LC3b and p150Glued. Input, 1.4% of lysate added to the assay. Representative example from n=3 independent experiments.
Figure 3
Figure 3. AP-2 regulates autophagosome transport in neurons.
(a) Time-lapse images of mRFP-LC3-positive puncta (arrows) in WT and AP-2μ KO neurons. Scale bar, 5 μm. (b) Kymographs of mRFP-LC3 carriers generated from a. (c) Average retrograde velocity of mRFP-LC3 carriers in WT and AP-2μ KO neurons. Loss of AP-2μ significantly decreased the LC3 velocity compared to WT controls (WT: 0.44±0.07 μm s−1, KO: 0.21±0.03 μm s−1, *P=0.019, n=4 independent experiments, 49–67 neurites per condition). (de) Electron micrographs of synapses from cultured WT and AP-2μ KO neurons. AP-2 KO neurons accumulate dense vesicular bodies with the majority representing concentric multilamellar structures (black boxes in d represent magnified areas in e). Scale bars, (d) 500 nm, (e) 100 nm. Sp, spine. See also Supplementary Fig. 3l–o. (f) Percentage of WT and KO synapses containing dense vesicular bodies (WT: 6.00%±1.54%, AP-2 KO: 13.00%±2.52%, *P=0.045, n=4, 100 synapses per condition). (gi) Representative confocal images of cultured WT and AP-2 KO neurons immunostained for LC3b and Rab7 (white boxes in g represent the magnified areas in h,i). Scale bars, (g) 15 μm, (h,i) 2 μm. (j,k) Accumulation of LC3b-containing structures (LC3b puncta μm−2 are depicted, WT: 0.009±0.002, AP-2 KO: 0.040±0.009, *P=0.016, n=4, in total 39 AP-2 KO and 33 WT neurons) (j) and Rab7-containing structures (Rab7 puncta μm−2 are depicted, WT: 0.004±0.000, AP-2 KO: 0.007±0.000, *P=0.042, n=3, in total 29 AP-2 KO and 23 WT neurons) (k) in AP-2μ-KO neurons. (l) Enhanced colocalization of LC3b with Rab7 on neuronal autophagosomes in absence of AP-2μ based on Pearson's coefficient (Rp) (WT: 0.52±0.04, AP-2 KO: 0.64±0.01, *P=0.032). Rp was calculated for 64–84 regions of interest (ROI) per condition from three independent experiments (n=3). (m,n) Bar diagrams indicating similar numbers of LC3b- (WT: 0.09±0.01, AP-2 KO: 0.1±0.02) (m) and Rab7-positive puncta μm−2 (WT: 0.05±0.02%, AP-2 KO: 0.04±0.01) (n) in WT and AP-2μ KO neurons treated with folimycin.. Shown is the number of puncta per μm2 (n=3 independent experiments, 26 neurons per condition). Data in c,f,jn are illustrated as box plots as described in Methods. Data reported in the text are mean±s.e.m. NS, non-significant.
Figure 4
Figure 4. AP-2 regulates autophagosome turnover independent of its role in endocytosis.
(a) Tandem mRFP-eGFP-tagged LC3 as a reporter of autolysosome formation. (b) Mean mRFP/eGFP intensity ratio in control or serum-deprived WT or AP-2μ KO neurons (n=6 independent experiments, with 37–54 neurons per condition). No significant difference between WT and AP-2μ KO neurons was observed at steady state (P=0.398). Serum deprivation failed to trigger the formation of autolysosomes in AP-2μ neurons (control WT: 1.247±0.092, serum-deprived WT: 2.847±0.213, ***P<0.001, control KO: 1.528±0.130, serum-deprived KO: 1.774±0.169, P=0.640; serum-deprived WT versus serum-deprived KO **P=0.002). (c) Representative confocal images of WT and AP-2μ KO neurons immunostained for p62. Scale bars, 20 μm. (d) Increased number of p62-positive puncta per μm2 in AP-2μ KO (0.030±0.003) compared to WT neurons (0.017±0.003). *P=0.046, n=4, 33–39 neurons per condition. See also Supplementary Fig. 4g. (e) Average retrograde velocity of mRFP-LC3 carriers in control neurons expressing AP-2αA WT or LC3 binding-deficient AP-2αA Mut and co-expressing mRFP-eGFP-LC3. Loss of LC3-AP-2α binding significantly decreased LC3 transport compared to AP-2αA WT expressing controls (AP-2αAWT: 0.42±0.00 μm s−1, AP-2αAMut: 0.32±0.01 μm s−1, **P=0.007, n=3 independent experiments, ≥45–47 neurites per condition). (f) Mean mRFP/eGFP intensity ratio in control or serum-deprived neurons expressing AP-2αAWT or AP-2αAMut (n=4 independent experiments, ≥25 neurons per condition). No significant difference between neurons expressing AP-2αAWT or AP-2αAMut was observed at steady state (P=0.661). Serum deprivation fails to trigger autolysosome formation in neurons expressing AP-2αAMut (control AP-2αAMut: 1.544±0.361, serum-deprived AP-2αAMut: 1.775±0.088, P=0.886), but not in neurons expressing AP-2αAWT (control AP-2αAWT: 1.173±0.091, serum-deprived AP-2αAWT: 2.660±0.240, **P=0.003). (g,h) LC3-binding defective AP-2αA (AP-2αA Mut) restores clathrin-mediated endocytosis of transferrin in HeLa cells depleted of endogenous AP-2α (KD) (*P=0.041, **P=0.007, n=4, 156, 124, 148 cells per condition, respectively). Mean grey values of transferrin uptake in KD+AP-2αAWT and KD+AP-2αAMut conditions were normalized to KD condition set to 100%. Scale bar, 20 μm. Tf, transferrin. Data in b,d,e,f are illustrated as box plots as described in Methods. Data in h and all data reported in the text are mean±s.e.m. NS, non-significant.
Figure 5
Figure 5. Autophagosome transport by AP-2 promotes neuronal complexity.
(a,b) Representative time series (a) and corresponding kymographs (b) of eGFP-LC3/TrkB-mRFP-positive carriers in the axon. Scale bars, (a) 3 μm, (b) 5 μm × 5 s. (c) Total distance of eGFP-LC3/TrkB-mRFP puncta travelled during a 30 s run when either left untreated or in the presence of BDNF. (d) BDNF significantly increases the retrograde velocity of eGFP-LC3/TrkB-mRFP-positive carriers compared to controls (Control: 0.198±0.0032 μm s−1, BDNF: 0.315±0.032 μm s−1; *P=0.036, n=3 experiments, 16–33 neurites per condition). (e,f) WT or AP-2μ KO neurons immunostained for LC3b and phospho-TrkB (pTrkB). White boxes indicate panels magnified to the right. Scale bars, (e) 10 μm, (f) 2 μm. (g) Colocalization of pTrkB with LC3b based on Pearson's coefficient (Rp) (WT: 0.3±0.02, AP-2 KO: 0.45±0.01, *P=0.043, n=4 experiments, 60–64 ROIs per condition). (h,i) Representative epifluorescent images and corresponding kymographs of TrkB-mRFP-positive puncta in WT and AP-2μ KO neurons. Scale bars, 5 μm. (j) TrkB velocity is decreased in AP-2 KO neurons compared to WT (WT: 0.39±0.03 μm s−1, KO: 0.25±0.03 μm s−1, *P=0.033, n=3 experiments, 44–48 neurites per genotype). (k) eGFP-expressing WT or AP-2μ KO neurons at DIV14. Scale bar, 40 μm. (l) Mean number of branching points in WT (69.78±10.76) and AP-2μ KO neurons (24.25±2.46, *P=0.014, n=3 experiments, 22–25 neurons per genotype). See also Supplementary Fig. 6b. (m) Mean number of branching points in WT and AP-2μ KO neurons co-expressing eGFP and AP-2μ (WT+AP-2μ: 144.99±25.31, KO+AP-2μ: 118.38±9.45, P=0.308, n=3 experiments, 29–31 neurons per condition). See also Supplementary Fig. 6a,c. (n) Mean number of branching points in control neurons expressing WT HA-AP-2αA (HA-AP-2αAWT) (144.131±13.43) or LC3-binding deficient mutant AP-2αA (HA-AP-2αAMut) (66.36±17.55) (*P=0.024, n=4 experiments, 32–38 neurons per condition). See also Supplementary Fig. 6d,e. (o) eGFP-expressing WT or ATG5 KO neurons. Scale bar, 40 μm. (p) Mean number of branching points in WT or ATG5 KO neurons (WT: 134.69±16.84; KO: 62.62±18.11) (*P=0.013, n=3 experiments, 35–42 neurons per genotype). See also Supplementary Fig. 6m. Data in d,g,j,l,m,n,p are illustrated as box plots as described in Methods. Data in c and all data reported in the text are mean±s.e.m.
Figure 6
Figure 6. Reduced neuronal complexity and neurodegeneration in the absence of neuronal AP-2μ in vivo.
(a) Postnatal growth retardation of 21-day-old KO mice conditionally deleted for AP-2μ by transgenic expression of Cre recombinase under the neuron-specific Tα1 tubulin promoter (AP-2lox/lox:Tubα1-Cre ). See also Supplementary Figs 7a,b. (b) Kaplan–Meier survival curves of neuron-specific AP-2μ KO mice and littermate controls (AP-2wt/wt:Tubα1-Cre (WT), AP-2lox/wt:Tubα1-Cre (Het) and AP-2lox/lox:Tubα1-Cre (KO)). (c,d) Golgi silver impregnation of cortices from p20 WT and AP-2μ KO mice reveal the loss of dendritic architecture in AP-2μ KO brain. Scale bars, 200 μm. (e,f) 3D morphology of stellate neurons in control (e) and AP-2μ-deficient (f) brains. Scale bars, 40 μm. (g,h) Sholl analysis of stellate cells, revealing their branching complexity (g) and total dendritic length (h) in p20 WT and AP-2μ KO brains. (i) Histopathological analysis of the brain of AP-2μ KO mice at p20 shows marked degeneration of the thalamus (indicated by dotted line), but no overt alteration of the hippocampus (CA1). Nissl-stained brain sections of WT and conditional AP-2μ KO mice. cc, corpus callosum; AV, anteroventral thalamic nucleus; AM, anteromedial thalamic nucleus; LD, laterodorsal thalamic nucleus; VL, ventrolateral thalamic nucleus; VM, ventromedial thalamic nucleus; VPL, ventral posteriorlateral thalamic nucleus, Re, reuniens thalamic nucleus; Rt, reticular nucleus. Scale bars, 800 μm. See also Supplementary Fig. 7g–p for an overview of the temporal progression of neurodegeneration in the brain of AP-2 KO mice. (j) Loss of barrel compartments in the somatosensory cortex of AP-2μ KO mice. Cortical barrels visualized by immunostaining for potassium-chloride transporter member 2 are seen in WT controls, but absent in AP-2μ KO brains. Roman numbers indicate cortical layers. Scale bars, 500 μm. (k,l) Representative confocal images of thalamus in WT and AP-2μ KO mice immunostained for p62. White rectangular boxes in k indicate areas magnified in l. Scale bars, 5 μm. (m) Mean size of p62-positive puncta is significantly increased in brains of AP-2μ KO mice (1.92±0.26) compared to WT littermates (1.26±0.08, *P=0.041, n=5). Data in m are illustrated as box plots as described in Methods. Data in b,g,h and all data reported in the text are mean±s.e.m.
Figure 7
Figure 7. Loss of neuronal complexity in AP-2μ-deficient neurons results from reduced TrkB signalling to control expression of BDNF.
(a) Hypothetical model for the role of AP-2 in retrograde transport of TrkB-containing autophagosomes in neurons. In WT neurons, AP-2 via its association with LC3 and p150Glued mediates retrograde transport of BDNF/TrkB-containing amphisomes (late-stage autophagosomes post-fusion with Rab7-positive late endosomes) to the cell body, where TrkB signalling regulates transcription of activity-dependent genes in the nucleus. In the absence of AP-2 (KO) TrkB endocytosis proceeds, however BDNF/TrkB-mediated signalling is defective due to impaired retrograde transport of BDNF/TrkB-containing autophagosomes. Stalled late-satge autophagosomes in neurites of AP-2 KO neurons cause axonal swellings and underlie neurodegeneration. (b) Immunoblot analysis of BDNF expression levels in brain lysates from WT or conditional AP-2μ KO mice. Note that AP-2α remaining in the KO brains is largely derived from AP-2 expressed in glial cells not targeted by Cre. See also the levels of pro-BDNF in WT and AP-2 KO neurons in Supplementary Fig. 7v. (c) BDNF levels are significantly reduced in AP-2 KO brains. BNDF levels in WT were set to 100% (n=3 mice per genotype, *P=0.0158). (d) BDNF mRNA levels are significantly decreased in AP-2 KO neurons (WT: 99.9±0.02%, KO: 72.1±1.12%, **P=0.02). (eg) Reduced neuronal complexity of AP-2μ-deficient neurons is rescued by long-term BDNF application. (e) AP-2μ KO neurons expressing eGFP were treated for 7 days with 50 ng ml−1 BDNF or left untreated. Scale bars, 100 μm. (f) Application of BDNF rescues the number of branching points in neurons lacking AP-2μ compared to untreated controls (KO+BDNF: 66.65±24.19, KO untreated: 34.87±11.19, *P=0.046). No difference in the number of branching points between untreated and BDNF-treated WT neurons was observed (WT+BDNF: 84.74±21.49, WT untreated 80.86±11.96, P=0.882, n=3 experiments, 21–23 neurons per condition). (g) NGF fails to rescue the neuronal complexity loss in AP-2μ-KO neurons (KO+NGF: 80.6±4.2, KO untreated: 83.8±4.2, P=0.254; WT+NGF: 130.1±6.3, WT untreated 137.6±25.4, P=0.774, n=3 experiments). NS, non-significant. Data in f,g are illustrated as box plots as described in Methods. Data in c,d and all data in the text are mean±s.e.m.

References

    1. Mizushima N., Levine B., Cuervo A. M. & Klionsky D. J. Autophagy fights disease through cellular self-digestion. Nature 451, 1069–1075 (2008). - PMC - PubMed
    1. Xie Z. & Klionsky D. J. Autophagosome formation: core machinery and adaptations. Nat. Cell Biol. 9, 1102–1109 (2007). - PubMed
    1. Levine B. & Kroemer G. Autophagy in the pathogenesis of disease. Cell 132, 27–42 (2008). - PMC - PubMed
    1. Sanchez-Wandelmer J. & Reggiori F. Amphisomes: out of the autophagosome shadow? EMBO J. 32, 3116–3118 (2013). - PMC - PubMed
    1. Cheng X.-T., Zhou B., Lin M.-Y., Cai Q. & Sheng Z.-H. Axonal autophagosomes recruit dynein for retrograde transport through fusion with late endosomes. J. Cell Biol. 209, 377–386 (2015). - PMC - PubMed

Publication types

LinkOut - more resources