. 2017 Apr 7:7:46249.
doi: 10.1038/srep46249.

Elucidating dynamic metabolic physiology through network integration of quantitative time-course metabolomics

Affiliations

Elucidating dynamic metabolic physiology through network integration of quantitative time-course metabolomics

Aarash Bordbar et al. Sci Rep. .

Abstract

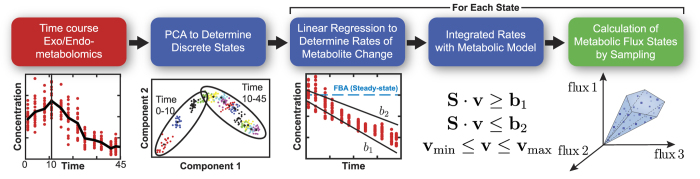
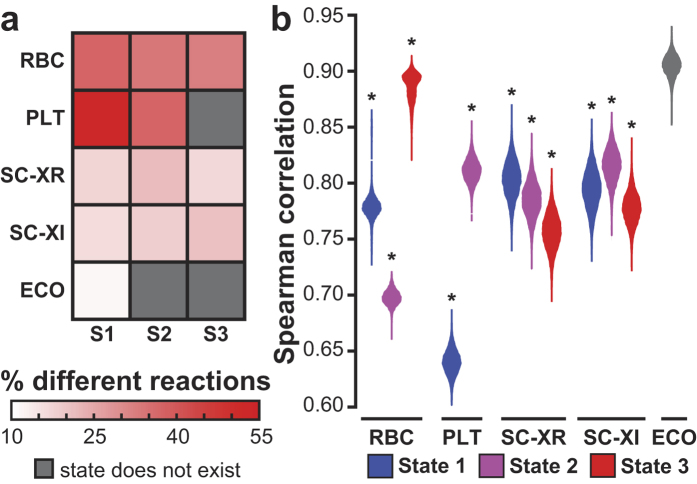
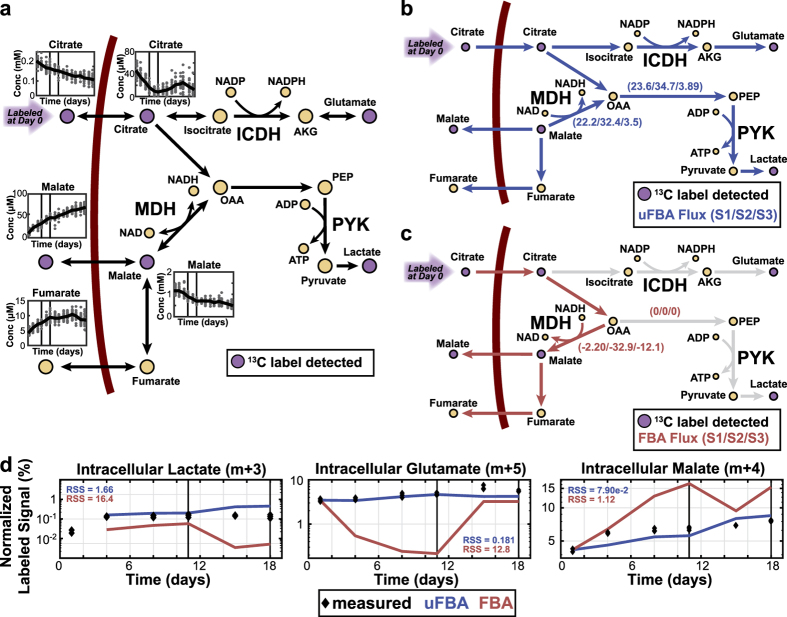
The increasing availability of metabolomics data necessitates novel methods for deeper data analysis and interpretation. We present a flux balance analysis method that allows for the computation of dynamic intracellular metabolic changes at the cellular scale through integration of time-course absolute quantitative metabolomics. This approach, termed "unsteady-state flux balance analysis" (uFBA), is applied to four cellular systems: three dynamic and one steady-state as a negative control. uFBA and FBA predictions are contrasted, and uFBA is found to be more accurate in predicting dynamic metabolic flux states for red blood cells, platelets, and Saccharomyces cerevisiae. Notably, only uFBA predicts that stored red blood cells metabolize TCA intermediates to regenerate important cofactors, such as ATP, NADH, and NADPH. These pathway usage predictions were subsequently validated through 13C isotopic labeling and metabolic flux analysis in stored red blood cells. Utilizing time-course metabolomics data, uFBA provides an accurate method to predict metabolic physiology at the cellular scale for dynamic systems.


Conflict of interest statement

The authors declare no competing financial interests.

Figures

Figure 1
Figure 1. Overview of the uFBA workflow.
First, extracellular (exo) and intracellular (endo) metabolite time profiles are split into discrete time intervals of linearized metabolic states using principal component analysis. For each metabolic state, the rate of change of each metabolite is calculated using linear regression, along with the 95% confidence interval (b1 and b2). If the metabolite’s rate of change is significant, the model is updated by changing the steady-state constraint b = 0 to a range denoted by b1 and b2. uFBA differs from FBA in that elements of the b vector are known and can be used as constraints, but FBA in the absence of such information assumes that these elements are zero (i.e., at steady-state).
Figure 2
Figure 2. Comparison of uFBA and FBA reaction flux states.
(a) Percentage of reactions with significantly different fluxes between the uFBA and FBA models. (b) The Spearman correlation between uFBA and FBA flux states indicates that differences in flux estimates were not due to uniform increases or decreases in fluxes but a reordering of reactions from high to low flux. The null hypothesis is that the distribution of Spearman correlations is drawn from the same distribution when comparing candidate flux states from uFBA to uFBA or FBA to FBA. *p = 0.0; E. coli p = 0.995.
Figure 3
Figure 3. Experimental confirmation of differences in predictions between uFBA and FBA models.
(a) TCA metabolites and pathways in the RBC metabolic model are shown, including changes in metabolite levels and metabolites found to be isotopically labeled after addition of fully labeled 13C citrate. Cofactor producing reactions are shown, while other cofactors and reaction names are omitted. Concentrations are shown as μmol/L of bag or mmol/L of bag. Time spans 0–45 days for insets. (b) uFBA (blue arrow) predicts that the depletion of intracellular malate produces extracellular malate and fumarate, while driving lactate production. Extracellular citrate is used to produce glutamate and lactate. Fluxes shown in μM. (c) FBA (red arrow) predicts extracellular citrate is used only to produce malate and fumarate and that MDH proceeds in the opposite direction than in uFBA. (d) uFBA and FBA predicted fluxes were integrated with a 13C MFA “forward” tracer simulation to simulate how labeled citrate would accumulate across the first two metabolic states. The three intracellular metabolites outside of citrate that were observed to be labeled and were absolutely quantified are shown. As fully labeled citrate is used, the only labeled versions of lactate and glutamate are shown. The unlabeled fraction of the metabolite (not shown) is the remainder. For malate, there is a small percentage of m + 3 labeling (see Fig. S11), and the remainder is unlabeled. uFBA predicted more correct labeling patterns than FBA. This is quantitatively corroborated by the residual sum of squares (RSS) for each. Abbreviations: oaa: oxaloacetate; akg: alpha-ketoglutarate; pep: phosphoenolpyruvate; MDH: malate dehydrogenase; PYK: pyruvate kinase; ICDH: isocitrate dehydrogenase. Vertical lines on metabolite time profiles denote the time intervals of the three metabolic states.

References

    1. Patti G. J., Yanes O. & Siuzdak G. Innovation: Metabolomics: the apogee of the omics trilogy. Nat Rev Mol Cell Biol 13, 263–269, doi: 10.1038/nrm3314 (2012). - DOI - PMC - PubMed
    1. Jain M. et al.. Metabolite profiling identifies a key role for glycine in rapid cancer cell proliferation. Science 336, 1040–1044, doi: 10.1126/science.1218595 (2012). - DOI - PMC - PubMed
    1. King Z. A. et al.. BiGG Models: A platform for integrating, standardizing and sharing genome-scale models. Nucleic Acids Res, doi: 10.1093/nar/gkv1049 (2015). - DOI - PMC - PubMed
    1. Bordbar A., Monk J. M., King Z. A. & Palsson B. O. Constraint-based models predict metabolic and associated cellular functions. Nat Rev Genet 15, 107–120, doi: 10.1038/nrg3643 (2014). - DOI - PubMed
    1. Lewis N. E., Nagarajan H. & Palsson B. O. Constraining the metabolic genotype-phenotype relationship using a phylogeny of in silico methods. Nat Rev Microbiol 10, 291–305, doi: 10.1038/nrmicro2737 (2012). - DOI - PMC - PubMed

Publication types