. 2017 Apr 7:7:46195.
doi: 10.1038/srep46195.

Klotho preservation via histone deacetylase inhibition attenuates chronic kidney disease-associated bone injury in mice

Affiliations

Klotho preservation via histone deacetylase inhibition attenuates chronic kidney disease-associated bone injury in mice

Wenjun Lin et al. Sci Rep. .

Abstract

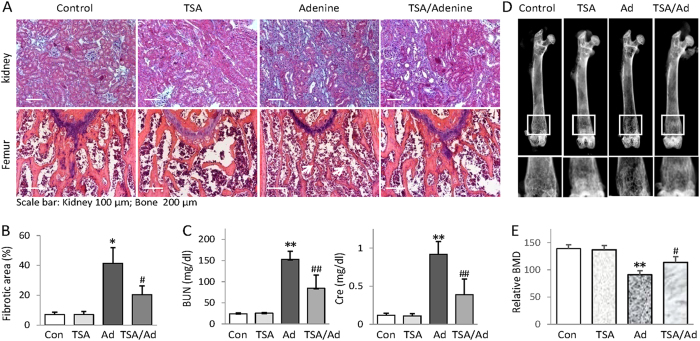
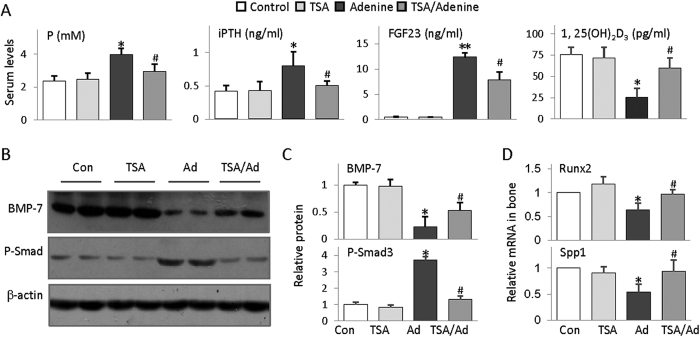
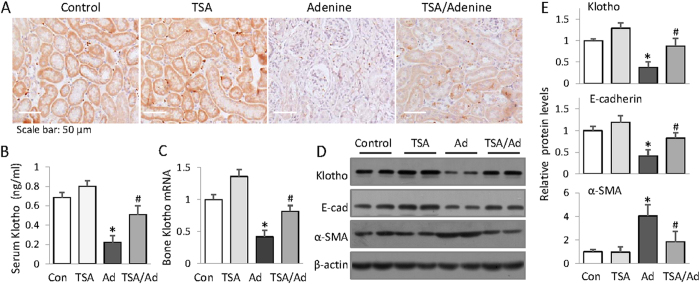
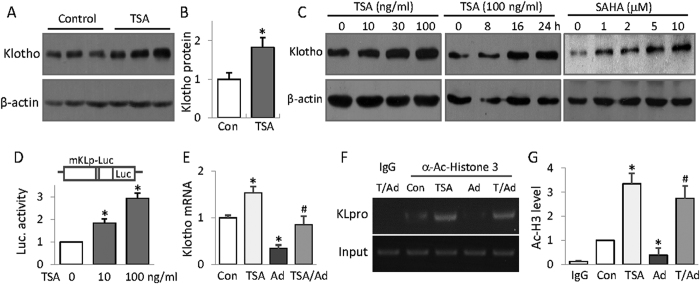
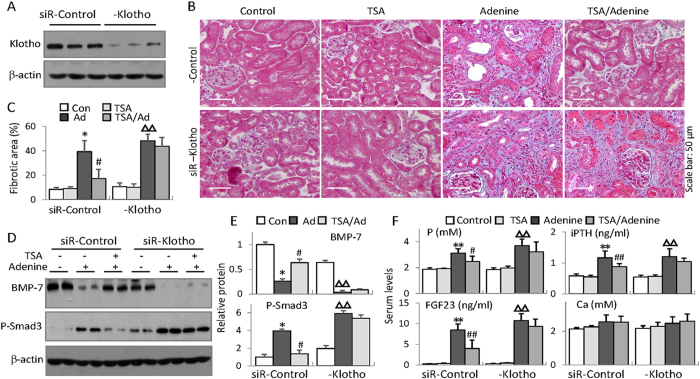
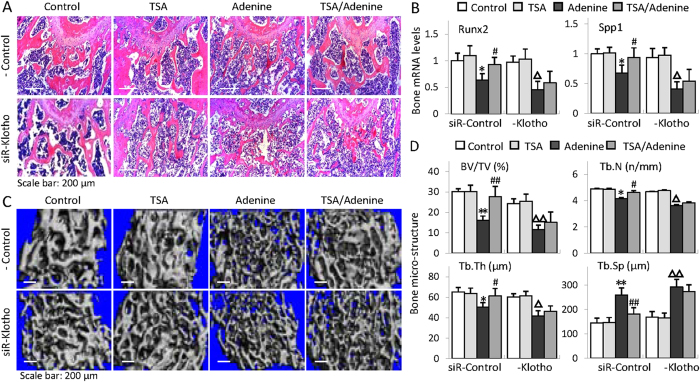
Bone loss and increased fracture are the devastating outcomes of chronic kidney disease-mineral and bone disorder (CKD-MBD) resulting from Klotho deficit-related mineral disturbance and hyperparathyroidism. Because Klotho down-regulation after renal injury is presumably affected by aberrant histone deacetylase (HDAC) activities, here we assess whether HDAC inhibition prevents Klotho loss and attenuates the CKD-associated bone complication in a mouse model of CKD-MBD. Mice fed adenine-containing diet developed the expected renal damage, a substantial Klotho loss and the deregulated key factors causally affecting bone remodeling, which were accompanied by a marked reduction of bone mineral density. Intriguingly, administration of a potent HDAC inhibitor trichostatin A (TSA) impressively alleviated the Klotho deficit and the observed alterations of serum, kidney and bone. TSA prevented Klotho loss by increasing the promoter-associated histone acetylation, therefore increasing Klotho transcription. More importantly the mice lacking Klotho by siRNA interference largely abolished the TSA protections against the serum and renal abnormalities, and the deranged bone micro-architectures. Thus, our study identified Klotho loss as a key event linking HDAC deregulation to the renal and bone injuries in CKD-MBD mice and demonstrated the therapeutic potentials of endogenous Klotho restoration by HDAC inhibition in treating CKD and the associated extrarenal complications.


Conflict of interest statement

The authors declare no competing financial interests.

Figures

Figure 1
Figure 1. HDAC inhibition prevents CKD-associated renal and bone damage in adenine-fed mice.
(A) Representative Masson’s trichrome staining of kidney sections and H&E stained femur sections from control, TSA, adenine and TSA-treated adenine mice (n = 6 in each group, 6 weeks). (B) Semi-quantifications of renal interstitial fibrosis (the percentage of blue-colored cortex area over the whole cortex field from Masson’s trichrome-stained sections) from all mice. (C) Average levels of serum blood urea nitrogen (BUN) and Creatinine (Cre). The quantifications were based on all mice tested. (D) Representative femur radiographs from Control, TSA, adenine and TSA-treated adenine mice. The lower panels are the enlarged views of framed images above (E) Quantifications of bone density of Fig. 1D from all mice. Data are presented as the mean ± SD. *P < 0.05, **P < 0.01 versus control; #P < 0.05, ##P < 0.01 versus adenine mice.
Figure 2
Figure 2. HDAC inhibition attenuates CKD-associated abnormalities of mineral, hormone and bone remodeling-related gene expression.
(A) Average concentrations of serum phosphorus (P), intact parathyroid hormone (iPTH), FGF23 and 1,25-dihydroxyvitamin D3 (1,25 (OH)2D3 from Control, TSA, adenine and TSA-treated adenine mice of 6 weeks (n = 6). (B) Renal BMP-7 and phosphorylated Smad3 (P-Smad3) were examined from all mice by Western blotting (two randomly selected samples from each group were shown). Beta-actin (β-actin) served as loading control. (C) Quantifications of Figure 2B (n = 6 in each group). (D) Average levels of bone Runx2 and Spp1 mRNA examined by qRT-PCT (n = 6). The data are presented as mean ± SD. *P < 0.05, **P < 0.01 versus control; #P < 0.05 versus adenine mice.
Figure 3
Figure 3. HDAC inhibition restores declined renal Klotho in adenine mice.
(A) Immunohistochemical staining. The kidney sections from control, TSA, adenine and TSA-treated adenine mice (6 weeks, n = 6) were examined by immunohistochemical staining for renal Klotho expression. The representative figures from each group were shown. (B) Serum Klotho levels. The average concentrations of serum Klotho from control, TSA, adenine and TSA-treated adenine mice were measured by ELISA (n = 6). (C) Bone Klotho mRNA. The relative levels of Klotho mRNA were examined from control, TSA, adenine and TSA-treated adenine mouse femurs by qRT-PCR (n = 6). (D) Renal expressions of Klotho, α-SMA and E-cadherin were assayed by Western blotting from the mouse kidneys (2 randomly selected samples were shown). (E) Quantifications of Fig. 3D (n = 6). Data are presented as mean ± SD. *P < 0.05 versus control, #P < 0.05 versus adenine mice.
Figure 4
Figure 4. HDAC inhibition up-regulates Klotho via reversing the promoter hypoacetylation and increasing Klotho transcription.
(A) TSA up-regulates Klotho in kidney. Kidney lysates from control and TSA-treated mice (6 weeks) were analyzed for Klotho protein levels by Western blotting (3 randomly selected samples from each group were shown). (B) Quantification of Fig. 3A. (C) HDAC inhibition dose and time-dependent up-regulation of Klotho in renal cells. HK2 cells were treated TSA of various doses (10, 30, or 100 ng/ml) or different times (100 ng/ml for 8, 16, and 24 h), or treated with SAHA of various amounts (1, 2, 5 and 10 μM) for 24 h, and then cell lysates were analyzed for Klotho protein expression by Western blotting. (D) Luciferase assay. HK2 cells were transfected with a mouse Klotho promoter reporter (mKLp-Luc) plus a renilla luciferase plasmid control for 20 h, and then TSA of two doses (10 and 100 ng/ml) was added to the cells for additional 24 h. The cell lysates were analyzed for luciferase activities, presented as the fold changes of the reporter luciferase activities divided by that of renilla control. (E) Klotho mRNA from mouse kidney. The average levels of Klotho mRNA from control (Con), TSA, adenine (Ad) and TSA-treated adenine mice (6 weeks, n = 6) were determined by qRT-PCR. (F) ChIP assay. Mouse kidney lysates from control, TSA, adenine and TSA-treated adenine mice were cross-linked and immune-precipitated with an anti-acetylated Histone3 antibody. The immune-precipitated DNAs were further PCR-amplified with primer sets specific for mouse Klotho promoter (KLpro). The genomic DNAs served as input control. The PCR products were analyzed on a 1.5% agarose gel and visualized under UC light. Representative results were shown. (G) Semi-quantification of Fig. 4F from all mice (n = 6 in each group). Data are presented as mean ± SD. Cell-bases assays were repeated three times and the representative results were shown. *P < 0.05 versus control; #P < 0.05 versus adenine.
Figure 5
Figure 5. Klotho is critical for the renal protection by HDAC inhibition.
Mice receiving siRNA-control or siRNA-Klotho underwent TSA, adenine or TSA plus adenine treatments for 6 weeks (n = 6 in each group). (A) Renal Klotho protein levels from siRNA-control or siRNA-Klotho-injected mice were examined (6 weeks, three randomly selected samples from each group were shown) by Western blotting. (B) Representative Masson’s trichrome staining of kidney sections from siRNA-control or siRNA-Klotho-injected control, TSA, adenine and TSA-treated adenine mice (6 weeks, n = 6 in each group). (C) Quantifications of renal interstitial fibrosis (the percentage of blue-colored cortex area over the whole cortex field from Masson’s trichrome-stained sections) from all mice in Fig. 5B. (D) Renal expressions of BMP-7 and phosphorylated Smad3 were examined by Western blotting (Two randomly selected samples were shown). (E) Quantifications of BMP-7 and P-Smad3 in Fig. 5D (n = 6). (F) Average serum levels of phosphorus (P), iPTH, FGF23 and Calcium (Ca), from all mice (n = 6). Data are presented as the mean ± SD. *P < 0.05, **P < 0.01 versus control, #P < 0.05, ##P < 0.01 versus adenine treatment in siR-control mice; ΔP < 0.05, ΔΔP < 0.01 versus control in siR-Klotho mice.
Figure 6
Figure 6. Klotho is essential for the bone protection by HDAC inhibition.
(A) Representative H&E staining of mouse distal femur sections from siRNA-control or siRNA-Klotho-injected control, TSA, adenine and TSA-treated adenine mice (6 weeks, n = 6 in each group). (B) Average bone mRNA levels of Runx2 and Spp1 examined by qRT-PCR (n = 6). (C) Representative micro-CT 3D images of trabecular architectures of the distal femurs from mice as in Fig. 6A. (D) Quantitative analyses of the ratio of bone volume to tissue volume (BV/TV), trabecular number (Tb.N), trabecular thickness (Tb.Th) and trabecular separation (Tb.Sp) from micro-CT examinations (n = 6). Data are presented as the mean ± SD. *P < 0.05, **P < 0.01 versus control, #P < 0.05, ##P < 0.01 versus adenine treatment in siR-control mice; ΔP < 0.05, ΔΔP < 0.01 versus control in siR-Klotho mice.

References

    1. Komaba H. [The expanding concept of CKD-MBD]. Clinical calcium 26, 1253–1260, doi: CliCa160912531260 (2016). - PubMed
    1. Kochanek M., Said A. & Lerma E. V. Mineral metabolism in chronic kidney disease. Disease-a-month: DM 61, 425–433, doi: 10.1016/j.disamonth.2015.08.003 (2015). - DOI - PubMed
    1. Iwashita Y., Iwashita Y., Ito T. & Shigematsu T. [Treatment for CKD-MBD(Chronic Kidney Disease-Mineral and Bone Disorder)]. Clinical calcium 26, 259–267, doi: CliCa1602259267 (2016). - PubMed
    1. Hu M.-C., Kuro-o M. & Moe O. W. Klotho and kidney disease. Journal of nephrology 23, S136 (2010). - PMC - PubMed
    1. Hu M. C., Kuro-o M. & Moe O. W. Klotho and chronic kidney disease. Contributions to nephrology 180, 47–63, doi: 10.1159/000346778 (2013). - DOI - PMC - PubMed

Publication types

MeSH terms