Review
. 2017 Apr 7;17(4):794.
doi: 10.3390/s17040794.

Recent Advances in Electrochemical Immunosensors

Affiliations
Review

Recent Advances in Electrochemical Immunosensors

Benoît Piro et al. Sensors (Basel). .

Abstract

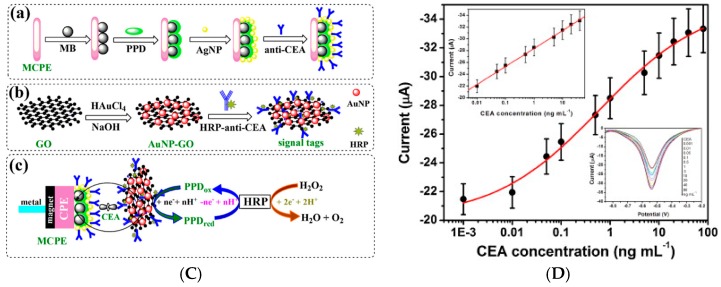
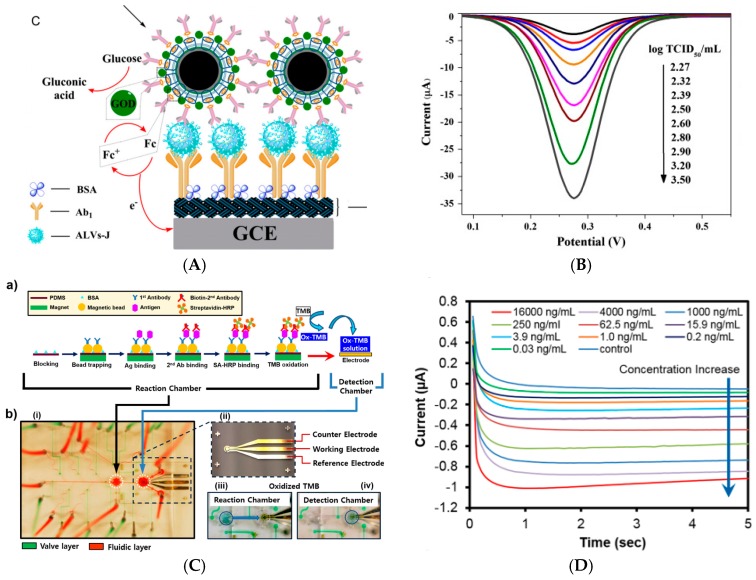
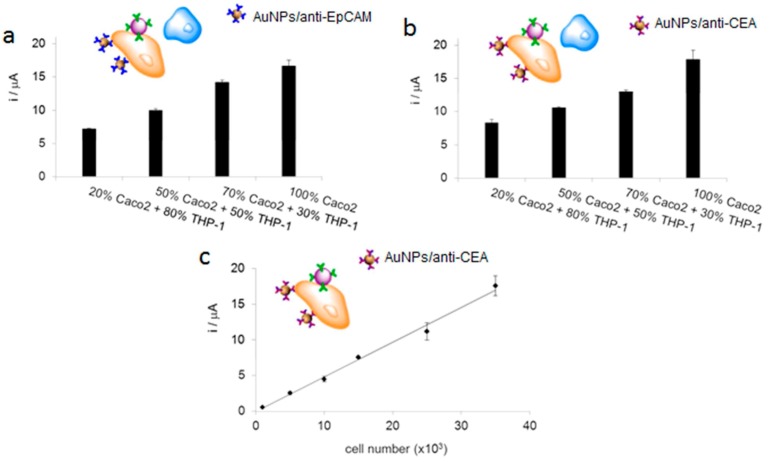
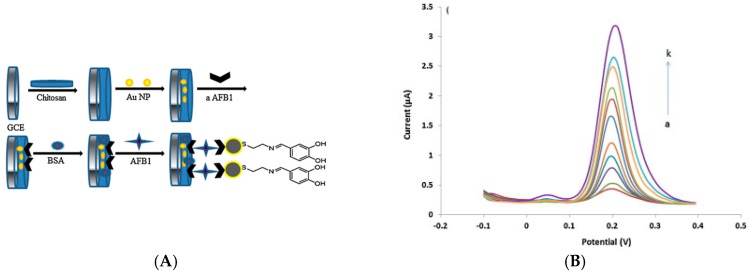
Immunosensors have experienced a very significant growth in recent years, driven by the need for fast, sensitive, portable and easy-to-use devices to detect biomarkers for clinical diagnosis or to monitor organic pollutants in natural or industrial environments. Advances in the field of signal amplification using enzymatic reactions, nanomaterials such as carbon nanotubes, graphene and graphene derivatives, metallic nanoparticles (gold, silver, various oxides or metal complexes), or magnetic beads show how it is possible to improve collection, binding or transduction performances and reach the requirements for realistic clinical diagnostic or environmental control. This review presents these most recent advances; it focuses first on classical electrode substrates, then moves to carbon-based nanostructured ones including carbon nanotubes, graphene and other carbon materials, metal or metal-oxide nanoparticles, magnetic nanoparticles, dendrimers and, to finish, explore the use of ionic liquids. Analytical performances are systematically covered and compared, depending on the detection principle, but also from a chronological perspective, from 2012 to 2016 and early 2017.

Keywords: ELISA; antibodies; carbon nanotubes; competitive immunosensor; dendrimers; electrochemical sensors; enzyme; graphene; hapten; immunosensors; ionic liquids; magnetic nanoparticles; nanoparticules; redox probe; sandwich-type immunosensors.


Conflict of interest statement

The authors declare no conflict of interest. The founding sponsors had no role in the design of the study; in the collection, analyses, or interpretation of data and in the writing of the manuscript.

Figures

Figure 1
Figure 1
(A) (a) Au microelectrodes obtained by electroreduction of HAuCl4 in 5 μm apertures; (b) Immunorecognition. HIV-1 antigens are covalently immobilized on a SU-8 layer, then target antibodies are bound, followed by secondary AlkP-labelled anti-IgG binding. p-Aminophenyl phosphate (pAPP) is added as substrate; (c) Transduction: (c) AlkP converts pAPP to p-aminophenol which is electrooxidized at the electrode and produces a current proportional to the amount of target antibody bound to the sensor; (d) Resulting DPV. Reprinted with permission from [12]. Copyright 2013 American Chemical Society; (B) Above. Detection principle of the screen-printed bi-analyte array, including a BSA (reference) electrode. Below. Change in current for different concentrations of AFP, for blank (lowest current) to 50 ng mL−1 (highest current); calibration curve in inset. Adapted from [15] with permission from The Royal Society of Chemistry.
Figure 2
Figure 2
(A) Reactions involved in the ACTH immunosensor using SPEs modified with phenylboronic acid; (B) DPV obtained with the Strept-AlkP–Biotin-ACTH/anti-ACTH/SPCE electrode for 0 (1), 0.05 (2), 0.50 (3), and 1.00 (4) pg mL−1 ACTH. Reprinted from [16], Copyright 2012, with permission from Elsevier; (C) Above, scheme of the immunosensor principle for SA and TC antibiotics. Below, surface chemistry involved for covalent binding of Protein G; (D) Calibration curves obtained with the SPY/TC immunosensor for SPY and TC in a 1:1 PBS:milk mixture. Reprinted from [17], Copyright 2013, with permission from Elsevier.
Figure 3
Figure 3
(A) Strategy for the electrochemical detection of atrazine based on the change in electroactivity of a polymer film poly(juglone-ATZ); (1) polymer/hapten-modified electrode; (2) after complexation with anti-ATZ; (3) after addition of ATZ in solution; (B) Calibration curve measured from SWV at −450 mV/SCE, after addition of ATZ from 1 pM up to 10 μM. Adapted from [22], Copyright 2012, with permission from Elsevier; (C) RCA-based immunosensor for HE4 detection. Reprinted from [26], Copyright 2012, with permission from Elsevier; (D) Scheme of the competitive inhibition assay for detecting HbA1c (anti-HbA1c: blue Y; HbA1c: red triangle; GPP: pink triangle, surface bound); (E) Above, a representative SWV for a FDMA-modified electrodes after (a) grafting of GPP and (b) incubation in 2 μg mL−1 anti-HbA1c and 13.5% HbA1c. Below, corresponding calibration curve. Reprinted from [23] with permission from The Royal Society of Chemistry.
Figure 4
Figure 4
(A) Hemagglutinin H5 immunosensor based on a SAM of 4,4′-thiobisbenzenethiol carrying single chain variable fragments (scFv) of antibodies as probes. Reprinted from [31], Copyright 2016, with permission from Elsevier; (B) Schematic representation of a scFv fragment. A scFv fragment makes 25 kDa and corresponds to the VH + VL domains; it is the smallest fragment that holds a complete binding site of an antibody and therefore provides its specificity. From Antibody Design Laboratories (http://www.abdesignlabs.com/technical-resources/scfv-cloning/); access 29 January 2017.
Figure 5
Figure 5
(A) Preparation of the immunoelectrode, and reactions occurring at the electrode surface for determination of E. sakazakii and E. coli O157:H7. Thi(ox) and Thi(red) are the oxidized and reduced forms of thionine, respectively; (B) CVs after incubation with E. sakazakii (1010 cfu mL−1) (left) and E. coli O157:H7 (right). Curves a1 and b1 were obtained before incubation; curves a2 and b2 were obtained after incubation. Reprinted from [32], Copyright 2013, with permission from Elsevier; (C) (a) Preparation procedure of the ChOx/Ab2/CoPc-MWCNTs bioconjugates; (b) Transduction and amplification mechanisms; (D) DPV responses after incubation with PCT (from 0.01 to 100 ng mL−1), and corresponding calibration curve of the anodic peak current. Reprinted from [38], Copyright 2016, with permission from Elsevier.
Figure 6
Figure 6
(A) SWNT-modified GC electrodes for detection of endosulfan; (B) SWVs for GC-Ph-NH2/SWNT/PEG/FDMA/endosulfan/anti-endosulfan electrode after incubation in with 0, 0.02, 0.05, 0.1, 0.2, 0.4, 0.8, 1, 2, and 4 ppb endosulfan, respectively. Adapted with permission from [40]. Copyright 2012 American Chemical Society; (C) Immunosensing architecture used for tissue transglutaminase. 3-IP: 3-indoxyl phosphate disodium salt; (D) CVs obtained for anti-tTG at various concentrations. Inset: relationship between the peak current and the anti-tTG concentration. Reprinted from [42], Copyright 2012, with permission from Elsevier.
Figure 7
Figure 7
(A) Functioning of the 8-isoprostane immunosensor on a SPE; (B) Corresponding calibration plot for 8-isoprostane. Adapted from [45], Copyright 2016, with permission from Elsevier; (C) Schematic representation of electrode modification by the nanohorns–bienzyme–Ab2 complex, for AFP detection; (D) Nyquist diagrams of bienzyme/Ab2/SWCNHs bioconjugates, for various AFP concentrations. Adapted from [46], Copyright 2014, with permission from Elsevier.
Figure 7
Figure 7
(A) Functioning of the 8-isoprostane immunosensor on a SPE; (B) Corresponding calibration plot for 8-isoprostane. Adapted from [45], Copyright 2016, with permission from Elsevier; (C) Schematic representation of electrode modification by the nanohorns–bienzyme–Ab2 complex, for AFP detection; (D) Nyquist diagrams of bienzyme/Ab2/SWCNHs bioconjugates, for various AFP concentrations. Adapted from [46], Copyright 2014, with permission from Elsevier.
Figure 8
Figure 8
(A) Biosensor chip for CRP, cTnT and myoglobin; (a) SEM image of an array of 9 electrodes, and (b) of an individual electrode; (c) AFM image of an array carbon nanofibers (bright dots); (d) AFM profile of the carbon nanofibers height; (e) 3D AFM micrograph after antibody immobilization. Reprinted from [47], Copyright 2016, with permission from Elsevier; (B) (a) Ab2–C60–AuPtNPs and (b) scheme of the Vangl1 immunosensor using these C60 templates. Reprinted from [48], Copyright 2016, with permission from Elsevier.
Figure 9
Figure 9
(A) Electroreduction of a diazonium salt on a SPE, for covalent immobilization of β-lactoglobulin antibodies; (B) DPVs of the immunosensor incubated with different concentrations of β-lactoglobulin (inset: calibration curve); (C) Comparison of the DPV response of the graphene-modified electrodes to 1000 ng mL−1 ovalbumin, BSA, casein, lysozyme, and 100 ng mL−1 β-lactoglobulin. Reprinted from [52], Copyright 2012, with permission from Elsevier.
Figure 10
Figure 10
(A) Covalent attachment of 3-aminopropyltriethoxysilane (APTES) to a hydroxyl-terminated graphene surface; (B) Resistance across a 100 μm × 4 mm graphene channel as a function of the hCG concentration. Resistance across the channel as a function of the urea and cortisol concentration (inset, top left). I–V curves are plotted (inset, bottom right) for the unmodified device (black curve), amine-terminated (red curve), and Ab-modified (blue curve) graphene surface. Reprinted from [59], Copyright 2014, with permission from Elsevier. (C) Sandwich-type electrochemical immunosensor based of Fc-modified Cu2ONPs, for PSA detection. (D) SWVs for detection of 0.05 pg mL−1 (a), 0.1 pg mL−1 (b), 0.5 pg mL−1 (c), 1 pg mL−1 (d), 5 pg mL−1 (e), 10 pg mL−1 (f), 50 pg mL−1 (g) and 100 pg mL−1 (h) PSA. Reprinted from [62], Copyright 2016, with permission from Elsevier.
Figure 11
Figure 11
(A) RGO and RGO/AgNPs for PSA detection, with Fe(CN)63−/4− as diffusing redox probe. Reprinted from [63], Copyright 2017, with permission from Elsevier; (B) Cyclodextrin-modified graphene (a); functionalization by Pt/PdCuNPs and Ab2 (b); and (c) global immunosensing scheme. Reprinted from [65], Copyright 2016, with permission from Elsevier.
Figure 12
Figure 12
(A) Fe3O4@SiO2–Fc–Ab2/HRP particles for enzyme-less catalytic immunodetection of CEA. (B) DPV curves of the above-described sensor for various CEA concentrations in PBS + 4 mM H2O2; (C) Calibration plots. Adapted from [67], Copyright 2016, with permission from Elsevier.
Figure 13
Figure 13
(A) Ab/PtNPs/Thi/Nafion/GR/GC electrode for detection of kanamycin. Reprinted from [71], Copyright 2012, with permission from Elsevier; (B) Antibody-modified and Prussian blue-modified GO (a) and multiplexed electrochemical immunoassay protocol for CEA and AFP detection (b); (C) Left: DPV responses of the immunosensor after incubation with CEA and AFP; center and right: corresponding calibration curves. Reprinted from [77], Copyright 2013, with permission from Elsevier.
Figure 14
Figure 14
(A) (a) Fe3O4/M2+/Ab labels and (b) immunosensing and transduction for estradiol and diethylstilbestrol detection. Reprinted from [86], Copyright 2014, with permission from Elsevier. (B) (a) GO/AuNP; (b) Fc-modified and Ab-modified GO; (c) Assembly of these functionalized GO sheets for cTnI detection. Drawings are not at scale. Reprinted from [87], Copyright 2016, with permission from Elsevier.
Figure 15
Figure 15
(A) Description of miRNA immunosensing; (B) SWVs after pDNA-29b-1 probe grafting, after hybridization with 10 fM miR-29b-1 and with 10 nM miR-29b-1; (C) Calibration curve: ΔI/I (%) vs. miR-29b-1 concentration. Medium: PBS. Relative current changes were calculated as follows: I = Ibefore hybridization and ΔI = Iafter hybridizationIbefore hybridization. Adapted with permission from [89]. Copyright 2013 American Chemical Society.
Figure 16
Figure 16
(A) Sandwich immunoassay for IgG detection using HRP-AuNP for oxidation of aniline into polyaniline; PANi is detected by DPV. Adapted with permission from [91]. Copyright 2014 American Chemical Society; (B) DPV responses of the immunosensor toward different concentrations of IgG (I) and (II) corresponding calibration curve. Curves a–g correspond to IgG concentrations from 0.01 to 500 ng mL−1 (C) Fabrication process of HRP-Ab2/Thi/AuNPs and electrochemical transduction; (D) (III) Calibration curves for CEA in pH 7.0 PBS + 2 mmol L−1 H2O2 for different electrode materials: (a) 3D-AuNPs/GR (inset: DPV curves), (b) GR, (c) AuNPs. (IV) Interferents and associated currents. Reprinted from [93], Copyright 2013, with permission from Elsevier.
Figure 17
Figure 17
(A) Preparation and detection procedures for the MMP-2 immunosensor. Reprinted from [99], Copyright 2013, with permission from Elsevier; (B) Typical DPVs corresponding to MMP-2 concentrations from a to j (0, 0.0005, 0.005, 0.02, 0.05, 0.25, 1.0, 5.0, 10.0 and 50.0 ng mL−1) in PBS + 4 mM H2O2, and corresponding calibration curve; (C) The different steps involved in the construction of the adiponectin (APN) immunosensor using a metallocomplex polymer (CMC) and RGO on a screen-printed carbon electrode; (D) Corresponding calibration plot. Reprinted from [101], Copyright 2016, with permission from Elsevier.
Figure 18
Figure 18
Electrochemical ELISA-like immunosensor for micro-RNA detection. Reprinted from [103], Copyright 2014, with permission from Elsevier.
Figure 19
Figure 19
(A) (a) Preparation of the HRP-anti-CEA-AuPt nanochains as label; (b) sandwich-type recognition; (c) transduction. (B) Corresponding LSV (I) and calibration (II) curves for CEA at different concentrations in PBS + 0.8 mM H2O2. Reprinted from [105], Copyright 2013, with permission from Elsevier. (C) Detection of CEA with AuNPs-Ab2-GOx as label. (D) EIS (III) for CEA at different concentrations: (a) 5, (b) 10, (c) 20, (d) 30, (e) 40, (f) 50, (g) 60, (h) 70 and (i) 80 ng mL−1 in 0.1 M KCl + 5.0 mM Fe(CN)63−/4−; (IV) corresponding calibration curve. Reprinted from [106], Copyright 2016, with permission from Elsevier.
Figure 20
Figure 20
(A) PNIPAAm-based immunosensor for CA125, CEA and PSA detection; (ac) Electrochemical response of this sensor to CA125, CEA, and PSA, respectively. Chronoamperometric results were obtained at −0.2 V. After incubation with the target proteins, HRP/antibody-tagged PPy NPs were bound to the primary antibody on the PNIPAAm-Au, and 0.1 M hydroquinone and 0.5 mM H2O2 were addede in PBS buffer. Reprinted from [107], Copyright 2016, with permission from Elsevier; (B) GOx-modified gold nanorods for TNF-α detection. Reprinted from [111], Copyright 2013, with permission from Elsevier.
Figure 21
Figure 21
(A) Schematic representation of the structure of the ZnO nanorods microfluidic immunosensor for influenza virus detection; (B) Chronoamperometric curves measured from each electrode of the arrayed sensor, for an antigen mixture of (a) 1 pg mL−1 H1N1 and 100 pg mL−1 H5N1; (b) 10 pg mL−1 H5N1 and 100 pg mL−1 H7N9; and (c) 10 pg mL−1 H1N1 and 1 pg mL−1 H7N9, respectively. Reprinted from [113], Copyright 2016, with permission from Elsevier.
Figure 22
Figure 22
(A) (a) Scheme of the cells biorecognition with AuNPs-conjugated antibodies and detection through the electrocatalyzed HER; (b) CVs performed from +1.35 to −1.40 V at a scan rate of 50 mV/s in 1 M HCl in the absence (a curve) and in the presence (b curve) of AuNPs-conjugated antibodies; (c) Left: Chronoamperograms registered in 1 M HCl, during the HER applying a constant voltage of −1.0 V, for AuNPs-labeled cells (a: control with BSA; b: 3.5 × 10⁴ cells). Right: Comparison of the corresponding analytical signals for the blank and the positive sample. Reprinted from [117], Copyright© 2012 WILEY-VCH Verlag GmbH & Co; (B) EIS immunosensor based on AuNPs for detection of HbA1c; (C) Impedance change with the concentration of target anti-HbA1c IgG (triangle dot), anti-biotin antibody (square dot), and anti-pig IgG (circle dot). Adapted from [118] with permissions. Copyright© 2012 WILEY-VCH Verlag GmbH & Co; (D) Scheme of the electrochemical lateral flow immunosensor for dengue detection, with AuNPs/Fc-labeled antibodies; (E) CVs of NS1 protein detection over the lateral flow immunosensor, for concentrations from 0.5 ng mL−1 to 400 ng mL−1 of NS1 protein. Reprinted from [119], Copyright 2016, with permission from Elsevier.
Figure 22
Figure 22
(A) (a) Scheme of the cells biorecognition with AuNPs-conjugated antibodies and detection through the electrocatalyzed HER; (b) CVs performed from +1.35 to −1.40 V at a scan rate of 50 mV/s in 1 M HCl in the absence (a curve) and in the presence (b curve) of AuNPs-conjugated antibodies; (c) Left: Chronoamperograms registered in 1 M HCl, during the HER applying a constant voltage of −1.0 V, for AuNPs-labeled cells (a: control with BSA; b: 3.5 × 10⁴ cells). Right: Comparison of the corresponding analytical signals for the blank and the positive sample. Reprinted from [117], Copyright© 2012 WILEY-VCH Verlag GmbH & Co; (B) EIS immunosensor based on AuNPs for detection of HbA1c; (C) Impedance change with the concentration of target anti-HbA1c IgG (triangle dot), anti-biotin antibody (square dot), and anti-pig IgG (circle dot). Adapted from [118] with permissions. Copyright© 2012 WILEY-VCH Verlag GmbH & Co; (D) Scheme of the electrochemical lateral flow immunosensor for dengue detection, with AuNPs/Fc-labeled antibodies; (E) CVs of NS1 protein detection over the lateral flow immunosensor, for concentrations from 0.5 ng mL−1 to 400 ng mL−1 of NS1 protein. Reprinted from [119], Copyright 2016, with permission from Elsevier.
Figure 23
Figure 23
(A) PfHRP2 immunosensor in the absence (a) and presence (b) of the target antigen with the MB-labelled detection antibody; (B) Chronocoulograms of PBS spiked with PfHRP2 recorded at 0.05 V (vs. Ag/AgCl). Reprinted from [122], Copyright 2016, with permission from Elsevier; (C) Scheme of (a) construction of signaling AuNPs by layer-by-layer alternate assembly of PDDA and PSS, and (b) sandwich immunoassay with Ag deposition and AgNPs redissolution, for CEA detection, on a chitosan/RGO-modified GC electrode; (D) Linear sweep stripping voltammetric curves of AgNPs for detection of CEA from 0 to 0.5 ng mL−1. Reprinted with permission from [127]. Copyright 2012 American Chemical Society.
Figure 24
Figure 24
(A) GC/Ph/AuNP competitive immunosensor for CEA detection; (B) CVs of the modified electrode in 10 mM [Fe(CN)6]4−/3− + 0.1 M KCl, for (a) a bare electrode; (b) NH2-Ph-NH2-modified electrode; (c) NH2-Ph-NH2 + AuNPs and (d) NH2-Ph-NH2 + AuNPs + Anti-CEA. Reprinted from [130]. Copyright 2012, with permission from Elsevier; (C) Ag/AuNPs coated on GR as CEA immunosensor; (D) CVs obtained in PBS form a Ag/AuNPs/GR electrode, showing the oxidation/reduction of the Ag0/Ag2O couple for different concentrations of CEA. Reprinted from [139], Copyright 2015, with permission from Elsevier.
Figure 25
Figure 25
(A) (a) Formation of ‘all-in-one’ redox-active PtNP@ICP catalyst; and (b) coupling this ‘all-in-one’ catalyst on Ab2 and transduction for PSA detection; (B) DPV of PtNP@ICP-Ab2/PSA/Ab1-PAMAM-GCE for various PSA concentration (a) 0 ng mL−1; and (b) 5 ng mL−1 [inset: DPV of ICP-Ab2/ PSA/Ab1-PAMAM-GCE toward different PSA concentration (c) 0 ng mL−1; and (d) 5 ng mL−1. Reprinted from [142], Copyright 2015, with permission from Elsevier; (C) PtNPs and BSA-copper nanoclusters for detection of PSA; transduction comes from the catalytic oxidation of ascorbic acid; (D) SWV responses of the immunosensor for different concentrations of PSA, from 0.0005 ng mL−1 to 100 ng mL−1. Reprinted from [145], Copyright 2017, with permission from Elsevier.
Figure 26
Figure 26
(A) Sandwich immunodetection of PSA using Ab1-Au@MNPs, magnetic collection and enzymatic transduction; (B) Calibration plots of reduction current versus PSA concentration using planar Ab1-modified gold electrode (black dots) and Ab1-Au@MNPs (black dots), anti-biotin immobilised on thioctic acid modified Au@MNPs (red squares) and thioctic acid modified Au@MNPs exposed to Ab1 without EDC/NHS activation (blue triangles). Reproduced from [146] with permission from The Royal Society of Chemistry. (C) Steps required for (a) the magnetic capture of PSA using Ab1-Au@MNPs; (b) construction of the GO-based label; and (c) sandwich immunodetection of CEA; (D) Calibration plots of the magnetic immunoassay toward CEA standards in pH 5.3 acetic acid salt-buffered saline buffer + 3.0 mM H2O2. Inset: corresponding linear and DPV curves. Reprinted from [147], Copyright 2012, with permission from Elsevier.
Figure 26
Figure 26
(A) Sandwich immunodetection of PSA using Ab1-Au@MNPs, magnetic collection and enzymatic transduction; (B) Calibration plots of reduction current versus PSA concentration using planar Ab1-modified gold electrode (black dots) and Ab1-Au@MNPs (black dots), anti-biotin immobilised on thioctic acid modified Au@MNPs (red squares) and thioctic acid modified Au@MNPs exposed to Ab1 without EDC/NHS activation (blue triangles). Reproduced from [146] with permission from The Royal Society of Chemistry. (C) Steps required for (a) the magnetic capture of PSA using Ab1-Au@MNPs; (b) construction of the GO-based label; and (c) sandwich immunodetection of CEA; (D) Calibration plots of the magnetic immunoassay toward CEA standards in pH 5.3 acetic acid salt-buffered saline buffer + 3.0 mM H2O2. Inset: corresponding linear and DPV curves. Reprinted from [147], Copyright 2012, with permission from Elsevier.
Figure 27
Figure 27
(A) Architecture of the magnetic Fe3O4-based immunosensor. MBs were decorated with GOx, signaling Abs and Fc-labeled β-CD. Capture Abs were grafted on GR sheets; (B) DPV at pH 7.0 Dependency of the DPV response towards different avian leukosis virus concentrations. Reprinted from [149], Copyright 2013, with permission from Elsevier; (C) Design, fabrication, and detection principle of the MB-based microfluidic electrochemical system; (a) Immunosensing principle with MB collection and sandwich capture of transferrin; (b) The microfluidic sensing chip, (i) photograph of the chip with an integrated microelectrode; (ii) photograph of the microelectrode; (iii) photograph of the reaction chamber with oxidized TMB, (iv) transfer of oxidized TMB to the detection chamber; (D) Amperometry measurement at −100 mV for different standard transferrin concentrations. Adapted from [151], licensed under a Creative Commons Attribution 4.0 International License.
Figure 28
Figure 28
Electrochemical detection of Caco2 cells using MBs/antiEpCAM for selective capture. (a,b) Effect of the number of cells on the analytical signal for different target (Caco2) and control cells (THP-1) proportions for (a) simultaneous labeling with AuNPs/antiEpCAM and (b) simultaneous labeling with AuNPs/anti-CEA. 100% corresponds to a cell amount of 5 × 10⁴; (c) Calibration plot for an increasing number of Caco2 cells (in the absence of THP-1) with simultaneous labeling with AuNPs/anti-CEA. Reprinted with permission from [153]. Copyright 2012 American Chemical Society.
Figure 29
Figure 29
(A) GCE/chitosan/AuNP/anti-AFB1/AFB1/anti-AFB1/MB/catechol immunoensor; (B) DPV recorded for GCE/chitosan/AuNP/anti-AFB1/BSA/AFB1/anti-AFB1/catechol–Au–Fe3O4 immunoelectrode as a function of AFB1 concentration from 0 ng mL−1 to 110 ng mL−1 in pH 7.0 (scan rate 50 mV s−1). Reprinted from [154], Copyright 2013, with permission from Elsevier;
Figure 30
Figure 30
Schematic experimental design. (A) E. coli was captured by MBs modified with primary antibodies, and subsequently labelled with AuNPs carrying secondary antibodies; (B) Left: detection of labeled E. coli through the hydrogen evolution reaction electrocatalyzed by the AuNP labels. Right: Chronoamperograms registered in 1 M HCl, during the HER applying a constant voltage of 1.0 V for increasing E. coli concentrations (from top to bottom: 0, 102, 5 102, 103, 104 and 105 CFU mL−1); (C) Cyclic voltammograms in 1 M HCl for 0 (red curve) and 105 (blue curve) CFU mL−1; scan rate: 50 mV/s. (D) SEM image for heat-killed E. coli (left) and antibody modified MBs before (center) and after (right) incubation with 105 CFU mL−1 of E. coli (bacteria are pointed by red arrows). Reprinted from [156], Copyright 2015, with permission from Elsevier.
Figure 31
Figure 31
(A) Magnetic beads functionalized with capture aptamers, and transduction using AuNPs-labelled signaling antibodies in a sandwich assay; (B) Corresponding DPVs for different concentrations of EGFR in the range of 1–40 ng mL−1. Reprinted from [162], Copyright 2015, with permission from Elsevier.
Figure 32
Figure 32
(A) PAMAM-based electrochemical immunosensor for detection of α-SYN. (B) Calibration curves obtained with {HRP-Ab2-GNPs}/Ab1/α-SYN/Th/PAMAM-Au/o-ABA/GCE immunosensor for different concentrations of α-SYN. Inset: (a) amperometric responses of the immunosensor in PBS (pH 6.5) to α-SYN at various concentrations of (a) 0, (b) 0.05, (c) 0.1, (d) 0.2, (e) 0.5 ng mL−1; (b) amplification of calibration curve in the low α-SYN concentration. Reprinted from [164], Copyright 2012, with permission from Elsevier. (C) Detection principle of a CEA immunosensor based on a sandwich capture and a HRP-GOx bienzymatic cascade. (D) SWV responses recorded for Au/Cys/Den/AuNP/Th-based CEA immunosensors at (i) blank noise and at various CEA concentrations: (ii) 10, 50, 100 pg mL−1, 0.5, 1.0, 5.0, 10, 50 ng mL−1, 0.1, 0.5 and 1.0 μg mL−1. Reprinted with permission from [165]. Copyright 2013 American Chemical Society.
Figure 32
Figure 32
(A) PAMAM-based electrochemical immunosensor for detection of α-SYN. (B) Calibration curves obtained with {HRP-Ab2-GNPs}/Ab1/α-SYN/Th/PAMAM-Au/o-ABA/GCE immunosensor for different concentrations of α-SYN. Inset: (a) amperometric responses of the immunosensor in PBS (pH 6.5) to α-SYN at various concentrations of (a) 0, (b) 0.05, (c) 0.1, (d) 0.2, (e) 0.5 ng mL−1; (b) amplification of calibration curve in the low α-SYN concentration. Reprinted from [164], Copyright 2012, with permission from Elsevier. (C) Detection principle of a CEA immunosensor based on a sandwich capture and a HRP-GOx bienzymatic cascade. (D) SWV responses recorded for Au/Cys/Den/AuNP/Th-based CEA immunosensors at (i) blank noise and at various CEA concentrations: (ii) 10, 50, 100 pg mL−1, 0.5, 1.0, 5.0, 10, 50 ng mL−1, 0.1, 0.5 and 1.0 μg mL−1. Reprinted with permission from [165]. Copyright 2013 American Chemical Society.
Figure 33
Figure 33
(A) Use of signaling antibodies coupled to dendrimers (PAMAN) containing metal sulfides, and (B) subsequent electroreduction by ASV for detection. This method allows detecting several antibody-antigen complexes. Reprinted from [169], Copyright 2013, with permission from Elsevier.
Figure 34
Figure 34
(A) CEA and AFP immunosensor based on metal NPs and Prussian blue NPs immobilized on IL-modified GO sheets; (B) DPV responses for different concentration of CEA and AFP in PBS, pH 6.5. Reproduced from [172], Copyright 2014, with permission from Elsevier.
Figure 35
Figure 35
(A) PSA immunosensor using AuNPs–PAMAM for signaling and MWCNT/IL/CS as substrate, and transduction with HRP and thionine as immobilized mediator; (B) CVs of the immunosensor after incubation with PSA from O up to 80 ng mL−1 in PBS, pH 7 + 2.5 mM H2O2. Insets, plots of the immunosensor response vs. PSA concentrations; (C) Nyquist curves for 2.5 mM [Fe(CN)6]3−/4− in 0.1 M KCl recorded at anti-PSA/AuNPs–PAMAM-dendrimer/MWCNTs/IL/Chit/GC after incubation with 5, 10, 15, 20 and 25 ng mL−1 PSA. Insets are plot of Rct vs. PSA concentration and the equivalent circuit used to fit the experimental impedance data. On the right, Nyquist curves for the immunosensor in the presence of 15 ng mL−1 PSA and in serum spiked with 15 ng mL−1 PSA. Adapted from [176], Copyright 2014, with permission from Elsevier.
Figure 36
Figure 36
(A) Biosensor’s structure and detection procedure. DENV-2 corresponds to the dengue virus; (B) Differential pulse voltammograms of alumina-modified electrode obtained in 1.0 mM ferrocenemethanol, 0.1 M phosphate buffered saline, pH 7.4 after each step of the biosensor construction procedure, DENV-2 concentration = 102 pfu mL−1; Adapted from [186], Copyright 2012, with permission from Elsevier.
Figure 37
Figure 37
(A) Bode plots for different concentrations of MS2 bacteriophage. (B) It is shown that the smaller pores (73 nm) are less efficient due to compromised accessibility of the walls to viruses when the diameter of the pore is smaller than 3 times that of the virus, while larger pores (97 nm) are not affected. Rsol is the resistance of solution above the membrane, Rpore and Cpore are the resistance and capacitance of the pores in the membrane, and Rox and Cox are the resistance and capacitance of the oxide layer. Adapted with permission from [190]. Copyright 2016 American Chemical Society.
Figure 38
Figure 38
LoDs of electrochemical immunosensors, from 2012 to 2017, using (A) conventional electrode substrates (open squares, enzyme-based sensors; plain square, enzyme-free sensors); (B) carbon nanostructures (open squares, enzyme-based sensors; plain square, enzyme-free sensors); (C) enzyme-free immunosensors with graphene and diffusing redox probe; (D) enzyme-free immunosensors with graphene and immobilized redox probes; (E) enzymatic immunosensors using graphene; (F) enzymatic immunosensors with metal or metal oxide nanoparticles; (G) enzyme-free immunosensors with metal or metal oxide nanoparticles; (H) magnetic nanoparticles; (I) dendrimers; (J) ionic liquids.
Figure 38
Figure 38
LoDs of electrochemical immunosensors, from 2012 to 2017, using (A) conventional electrode substrates (open squares, enzyme-based sensors; plain square, enzyme-free sensors); (B) carbon nanostructures (open squares, enzyme-based sensors; plain square, enzyme-free sensors); (C) enzyme-free immunosensors with graphene and diffusing redox probe; (D) enzyme-free immunosensors with graphene and immobilized redox probes; (E) enzymatic immunosensors using graphene; (F) enzymatic immunosensors with metal or metal oxide nanoparticles; (G) enzyme-free immunosensors with metal or metal oxide nanoparticles; (H) magnetic nanoparticles; (I) dendrimers; (J) ionic liquids.

Similar articles

Cited by

References

    1. Ricci F., Adornetto G., Palleschi G. A review of experimental aspects of electrochemical immunosensors. Electrochim. Acta. 2012;84:74–83. doi: 10.1016/j.electacta.2012.06.033. - DOI
    1. Yang H. Enzyme-based ultrasensitive electrochemical biosensors. Cur. Opin. Chem. Boil. 2012;16:422–428. doi: 10.1016/j.cbpa.2012.03.015. - DOI - PubMed
    1. Hasanzadeh M., Shadjou N., Omidinia E., Eskandani M., de la Guardia M. Mesoporous silica materials for use in electrochemical immunosensing. Trends Anal. Chem. 2012;45:93–106. doi: 10.1016/j.trac.2012.12.017. - DOI
    1. Pei X., Zhang B., Tang J., Liu B., Lai W., Tang D. Sandwich-type immunosensors and immunoassays exploiting nanostructure labels: A review. Anal. Chim. Acta. 2013;758:1–18. doi: 10.1016/j.aca.2012.10.060. - DOI - PubMed
    1. Arduini F., Micheli L., Moscone D., Palleschi G., Piermarini S., Ricci F., Volpe G. Electrochemical biosensors based on nanomodified screen-printed electrodes: Recent applications in clinical analysis. Trends Anal. Chem. 2016;79:114–126. doi: 10.1016/j.trac.2016.01.032. - DOI

LinkOut - more resources