. 2017 Apr 7;18(4):786.
doi: 10.3390/ijms18040786.

Classical and Novel TSPO Ligands for the Mitochondrial TSPO Can Modulate Nuclear Gene Expression: Implications for Mitochondrial Retrograde Signaling

Affiliations

Classical and Novel TSPO Ligands for the Mitochondrial TSPO Can Modulate Nuclear Gene Expression: Implications for Mitochondrial Retrograde Signaling

Nasra Yasin et al. Int J Mol Sci. .

Abstract

It is known that knockdown of the mitochondrial 18 kDa translocator protein (TSPO) as well as TSPO ligands modulate various functions, including functions related to cancer. To study the ability of TSPO to regulate gene expression regarding such functions, we applied microarray analysis of gene expression to U118MG glioblastoma cells. Within 15 min, the classical TSPO ligand PK 11195 induced changes in expression of immediate early genes and transcription factors. These changes also included gene products that are part of the canonical pathway serving to modulate general gene expression. These changes are in accord with real-time, reverse transcriptase (RT) PCR. At the time points of 15, 30, 45, and 60 min, as well as 3 and 24 h of PK 11195 exposure, the functions associated with the changes in gene expression in these glioblastoma cells covered well known TSPO functions. These functions included cell viability, proliferation, differentiation, adhesion, migration, tumorigenesis, and angiogenesis. This was corroborated microscopically for cell migration, cell accumulation, adhesion, and neuronal differentiation. Changes in gene expression at 24 h of PK 11195 exposure were related to downregulation of tumorigenesis and upregulation of programmed cell death. In the vehicle treated as well as PK 11195 exposed cell cultures, our triple labeling showed intense TSPO labeling in the mitochondria but no TSPO signal in the cell nuclei. Thus, mitochondrial TSPO appears to be part of the mitochondria-to-nucleus signaling pathway for modulation of nuclear gene expression. The novel TSPO ligand 2-Cl-MGV-1 appeared to be very specific regarding modulation of gene expression of immediate early genes and transcription factors.

Keywords: 2-Cl-MGV-1; PK 11195; TSPO ligand; cell nucleus; microscopy; mitochondria; mitochondrial 18 kDa translocator protein (TSPO); modulation of nuclear gene expression; retrograde mitochondrial-nuclear signaling pathway.


Conflict of interest statement

The authors declare no conflict of interest.

Figures

Figure 1
Figure 1
Specific elements of the canonical pathway for modulation of gene expression that are activated after 15 min of exposure of U118MG cells to 25 µM of PK 11195, as uncovered by “Regulator Effects” analytic (IPA®). The gene products of the genes WNK1, FOS, SGK, and MYC that are activated by the translocator protein (TSPO) ligand PK 11195 all are part of canonical pathways that converge on the final function of gene expression regulation. Furthermore, the statistically significant enhancements of expressions of the genes WNK1, FOS, SGK, and MYC all peak within one hour of exposure to PK 11195 (see Figure 2).
Figure 2
Figure 2
Effects of PK 11195 exposure on several immediate early genes of U118MG cells. (A) Time course of gene expression for gene products well known to take part in the initiation of modulation of gene expression assayed with microarray. These genes (WNK1, FOS, DUSP1, EGR1, MYC, SGK1) all present a peak of increased expression within half an hour of exposure of U118MG cells to 25 µM of PK 11195. As the data for 15, 30, and 45 min are obtained from one microarray and for 1, 3, and 24 h obtained from another microarray, a bar is placed between 45 and 60 min as a separation between the two. (Each micro array had its own untreated control as detailed in the Methods’ section); (B) Fold change (2−ΔΔCt) of FOS and DUSP1 expression after exposure to PK 11195 is 7.5 and 3.5, respectively, compared to untreated control (vehicle).
Figure 3
Figure 3
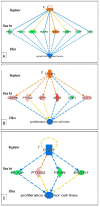
It presents the effects associated with changes in gene expression of 15 min of PK 11195 exposure, as determined with “Regulator Effects” analytic (in IPA®) from Qiagen as indicated in the figure (see also the Methods). The middle tier presents the genes showing significantly changed expression (“Data Set” in the middle tier). The “Effects” presented in the bottom tier indicate that, due to the significant changes in gene expression presented in the “Data Set”, the following general functions can be upregulated: (1) Binding of protein binding site; (2) Transactivation of RNA; (3) Endothelial cell development; (4) Accumulation of cells; and (5) Cell viability. The top tier presents the ‘Regulators’ known to be associated with these “Effects” and the genes of the “Data Set”. The arrows indicate the directions of the pathways, from Regulators, to Data Set, to Effect.
Figure 4
Figure 4
Potential effects on tumorigenicity due to gene expression following 24 h of exposure of U118MG cells to PK 11195 (25 µM). As determined with “Regulator Effects” analytic (IPA®) from Qiagen as indicated in the figure (see also the Methods)., in (AC), individual “Regulators” (given in the upper tiers) are related to specific groups of genes with significantly changed expression (“Data Sets” given in the middle tiers), together with their particular downstream functions (“Effects” in the bottom tiers), namely, suppression of growth of malignant tumor (in (A) and suppression of proliferation of tumor cell lines (in (B,C). Color coding: pink/orange = upregulated, blue/green = down regulated. The configurations in seen in (AC) can be considered assemblies. The arrows indicate the directions of the pathways, from Regulators, to Data Set, to Effect.
Figure 5
Figure 5
Potential effects on programmed cell death due to gene expression following 24 h of exposure of U118MG cells to PK 11195 (25 µM). As analyzed with Regulator Effects analytic (IPA®) from Qiagen as indicated in the figure (see also the Methods), in A,B,C, individual “Regulators” (given in the upper tiers) are related to specific groups of genes with significantly changed expression (“Data Sets” given in the middle tiers), together with their particular downstream functions (“Effects” in the bottom tiers), namely, stimulation of apoptosis of kidney cell lines (in (A), stimulation of apoptosis of epithelial cell lines (in (B)), stimulation of cell death of fibroblast cell lines (in (C). Each mentioned separate set can be considered an assembly of pathways running from 1 or few Regulators via a number of genes to affect not more than 1 or 2 specific functions. Color coding: pink/orange = upregulated, blue/green = down regulated. The configurations in seen in (AC) can be considered assemblies. The arrows indicate the directions of the pathways, from Regulators, to Data Set, to Effect.
Figure 6
Figure 6
Phase contrast microscopic images of U118MG cells labeled for the cell nucleus (DAPI), the mitochondria (Mitotracker Red), and TSPO (immunocytological labeling). The images are indicative of morphological changes due to exposure to the TSPO ligand PK 11195, in association with intracellular TSPO location. In general, as described in the text, the main points are that TSPO does not appear in the cell nuclei, but are always co-localized with mitochondria. The arrow-heads indicate labeling of mitochondria and TSPO evenly distributed throughout the cytoplasm in the vehicle row. In the 45 min row, the arrows point at mitochondria with co-localized TSPO that are present relatively close to the cell nuclei. A more detailed description of the figure follows here: The rows present exposure times to PK 11195 (25 µM), from top to bottom: vehicle (i.e., no exposure), 30, 45 min, 1, and 24 h. In each row from column to column the same cells are shown. Phase contrast micrographs are presented in the first column. The second column shows cell nuclei (stained blue with the aid of DAPI) within the phase contrast images. The third column shows TSPO immune labeling (Alexa fluorR 488, i.e., green) together with the DAPI stained nuclei. Most importantly, the images in the third column show that TSPO labeling is not within the cell nuclei, but in other intracellular areas and cell organelles. In particular, there is no double-labeling of TSPO and DAPI signal. The fourth column shows mitochondrial labeling in the cells outlined by phase contrast. Here it becomes clear that the TSPO labeling in the third column covers intracellular areas occupied by mitochondria. The fifth column shows the results of all signals for the cells in question combined. This presents merged double labeling for mitochondria and TSPO (white to yellow), while phase contrast and nuclear stain is applied for orientation. The DAPI stained nuclei appear purple here due to interference. As a control for this, omission of TSPO labeling i.e., by omitting the primary anti-TSPO anti-body, results in the same nuclear stain (purple) when applying the same microscopic conditions (not shown). As a general remark, omission of TSPO antibody completely prevented the immunocytochemical labeling for TSPO (not shown). The scale bar of 20 µm in the lower left corner of the figure is for all the micrographs in this plate.
Figure 7
Figure 7
Phase contrast microscopic images of U118MG cells labeled for the intracellular location of TSPO. In the left hand images, cells are only viewed for labeling of the cell nucleus (DAPI) and of TSPO (immunocytological labeling). In the right hand images, cells are viewed for labeling of the cell nucleus (DAPI), TSPO (immunocytological labeling), and the mitochondria (Mitotracker Red), within the cells outlined by phase contrast. While TSPO labeling can appear in the same area of view as the cell nucleus, double labeling of TSPO and nucleus does not occur (left hand images). In the right hand images it can be seen that the TSPO labeling overlaying the nucleus double labels with mitochondria, resulting in a yellow-whitish stain. The main points are that TSPO does not appear in the cell nuclei, but are always co-localized with mitochondria. In the vehicle exposed cells (top two images), labeling of mitochondria and TSPO is evenly distributed throughout the cytoplasm, almost completely filling out the cell body. In the cells exposed for 1 h to PK 11195, labeling of mitochondria and TSPO is condensed toward the cell nucleus, with TSPO—mitochondria double labeling appearing relatively close to the nucleus. Toward the periphery of the cell body a relative broad area is devoid of mitochondrial as well as TSPO labeling. The scale bar in the lower left micrograph of the figure is of 20 µm for all the micrographs in the plate.
Figure 8
Figure 8
Scheme of observations presented in Figure 6 and Figure 7. In vehicle control cells (i.e., 0 h of PK 11195 exposure) mitochondria with TSPO (yellow) are spread throughout the cytosol (grey). Shortly after PK 11195 exposure the cell bodies contract, become roundish, and mitochondria with TSPO appear to become more condensed toward the cell nuclei (blue). After 24 h of PK 11195 exposure the cell bodies regain their original polygonal shapes. Nonetheless, after these 24 h, mitochondria with TSPO still remain congregated in areas relatively close to the cell nucleus. Mitochondria not displaying TSPO signal are indicated with (red).
Figure 9
Figure 9
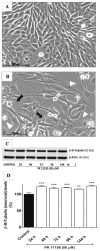
PK 11195 induced neuronal differentiation of rat PC12 cells. (A) Undifferentiated vehicle control cells; (B) Neuronal differentiation due to PK 11195 (50 µM), including differentiating cells (white asterisks), neurite outgrowth (white arrows), growth cones (white arrowheads), and varicosities (black arrows); (C) Representative western blot showing elevated β-III-tubulin expression in rat PC12 cells after exposure times of 24, 48, 72, 96, and 144 h to PK 11195 (50 µM). β-actin is the loading control; (D) Bar chart of Means ± SEM (n = 3) of the relative densities of the blot bands of β-III-Tubulin labeling in C (arbitrary units as% of control. Control = vehicle treated cells. ** p < 0.01, *** p < 0.001. (In (A,B); bars: 100 µm).
Figure 10
Figure 10
Regulation of gene expression by the TSPO ligand PK 11195. It is well known that the classical TSPO ligand PK 11195 can modulate mitochondrial TSPO functions such as Ca2+ release, ATP production, and ROS generation via modulation of mitochondrial proteins such as VDAC, ANT, and complexV (a.k.a. ATP(synth)ase). Ca2+ release, ATP production, and ROS are part of the mitochondrial – nuclear signaling pathway for regulation of nuclear gene expression. In this pathway, calcium sensitive proteins such as calcineurin and calmodulinKIV contribute to induction of expression of immediate early genes. The present study shows that PK 11195 exposure at first induces expression of immediate early genes, as well as other transcription factors (calcineurin, and calmodulinKIV are implicated in these effects), followed by changes in gene expression for enzymes and other proteins. Eventual potential functional implications include cell proliferation, cell migration, cell differentiation, cell death, inflammation, immune response, and tumorigenicity. While it is impossible to include all co-factors and context conditions into this diagram, it should be appreciated that by making small and big variations in the research paradigm, other final effects will become apparent regarding changes in function due to changes in gene expression, for example as a consequence of application of other TSPO ligands, TSPO knockdown, TSPO knockout, TSPO gene insertion, full medium, serum free medium, etc. The (*) and the (**) next to the phenomena modulated by PK 11195 indicate results from our present study (*) and from our previous studies (**). # indicates data from studies by others. (We consider it worthwhile for future studies to pay attention to the calcium sensitive proteins in the context of gene expression regulation via TSPO activities).

References

    1. Gavish M., Bachman I., Shoukrun R., Katz Y., Veenman L., Weisinger G., Weizman A. Enigma of the peripheral benzodiazepine receptor. Pharmacol. Rev. 1999;51:629–650. - PubMed
    1. Veenman L., Gavish M. The peripheral-type benzodiazepine receptor and the cardiovascular system. Implications for drug development. Pharmacol. Ther. 2006;110:503–524. doi: 10.1016/j.pharmthera.2005.09.007. - DOI - PubMed
    1. Veenman L., Gavish M. The role of 18 kDa mitochondrial translocator protein (TSPO) in programmed cell death, and effects of steroids on TSPO expression. Curr. Mol. Med. 2012;12:398–412. doi: 10.2174/1566524011207040398. - DOI - PubMed
    1. Starosta-Rubinstein S., Ciliax B.J., Penney J.B., McKeever P., Young A.B. Imaging of a glioma using peripheral benzodiazepine receptor ligands. Proc. Natl. Acad. Sci. USA. 1987;84:891–895. doi: 10.1073/pnas.84.3.891. - DOI - PMC - PubMed
    1. Kugler W., Veenman L., Shandalov Y., Leschiner S., Spanier I., Lakomek M., Gavish M. Ligands of the mitochondrial 18 kDa translocator protein attenuate apoptosis of human glioblastoma cells exposed to erucylphosphohomocholine. Cell. Oncol. 2008;30:435–450. - PMC - PubMed

MeSH terms