. 2017 Apr 6;169(2):229-242.e21.
doi: 10.1016/j.cell.2017.03.021.

Aneuploidy Causes Non-genetic Individuality

Affiliations

Aneuploidy Causes Non-genetic Individuality

Rebecca R Beach et al. Cell. .

Abstract

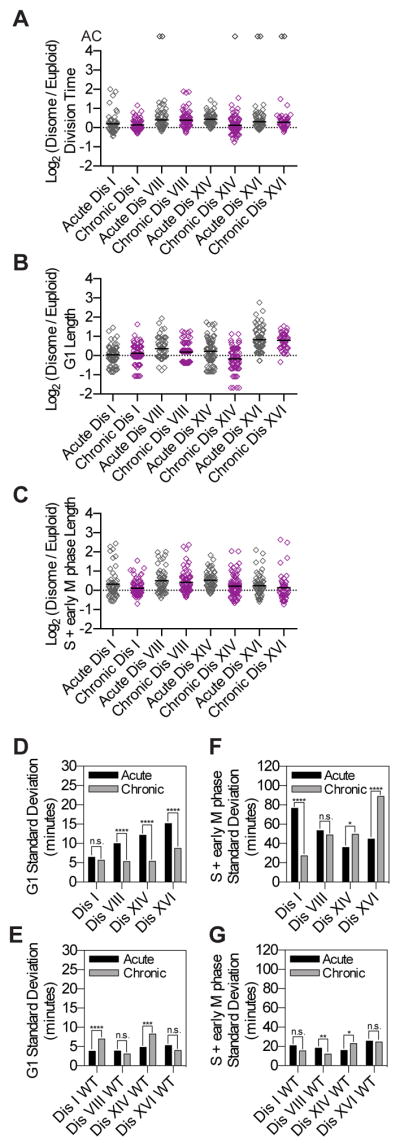
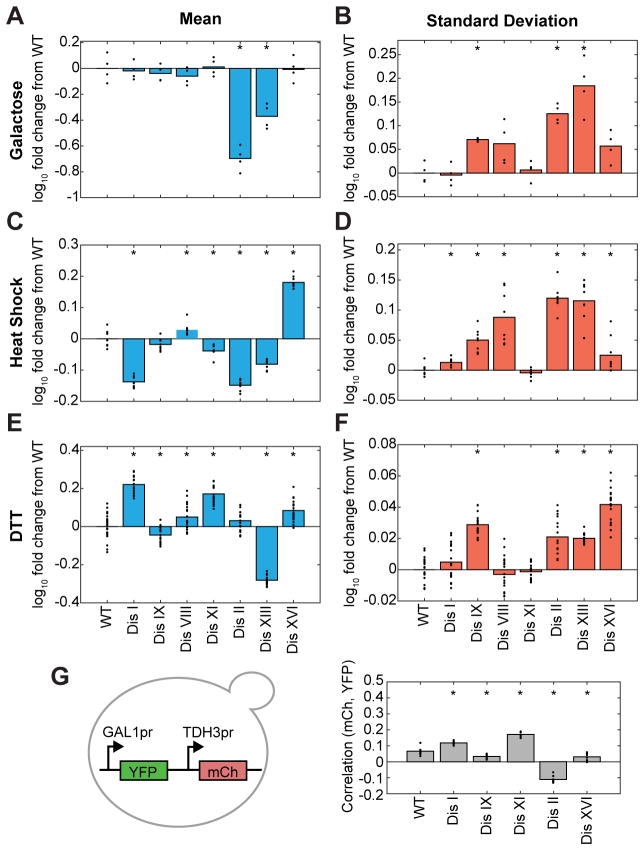
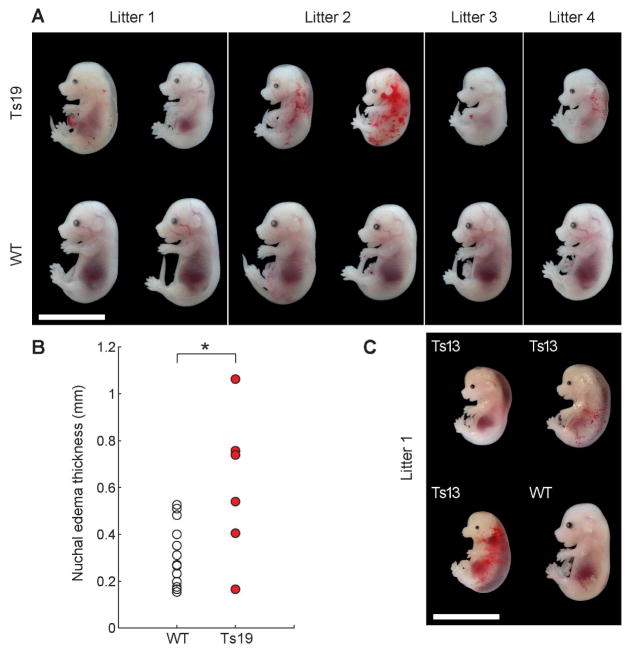
Phenotypic variability is a hallmark of diseases involving chromosome gains and losses, such as Down syndrome and cancer. Allelic variances have been thought to be the sole cause of this heterogeneity. Here, we systematically examine the consequences of gaining and losing single or multiple chromosomes to show that the aneuploid state causes non-genetic phenotypic variability. Yeast cell populations harboring the same defined aneuploidy exhibit heterogeneity in cell-cycle progression and response to environmental perturbations. Variability increases with degree of aneuploidy and is partly due to gene copy number imbalances, suggesting that subtle changes in gene expression impact the robustness of biological networks and cause alternate behaviors when they occur across many genes. As inbred trisomic mice also exhibit variable phenotypes, we further propose that non-genetic individuality is a universal characteristic of the aneuploid state that may contribute to variability in presentation and treatment responses of diseases caused by aneuploidy.

Keywords: Down syndrome; aneuploidy; biological noise; cancer; cell-to-cell variability; gene dosage effects; non-genetic heterogeneity.


Figures

Figure 1
Figure 1. The proteome rapidly adjusts to changes in gene dosage
(A) Log2 ratio of the relative protein abundance of chronic disome (Dis) IV compared to euploid (WT) cells from the 5-hour time-point in (D). (B) Experimental setup to compare proteome 1 (C) and 5 (D) hours following chromosome mis-segregation. (C,D) Log2 ratios of the relative protein abundance of disome IV cells compared to euploid cells 1 (C) and 5 (D) hours following chromosome mis-segregation. Proteins encoded on chromosome (Chr) IV are red in (A), (C) and (D). (E–F) Following chromosome mis-segregation, mother-daughter cell pairs were placed side-by-side on YEP-D plates. Colony area was measured after growth for 40–48 hours. Error bars indicate standard deviation (SD). Linear regressions (m = slope) exclude disome and trisome VI due to lethality of excess TUB2 and only include monosomes with aneuploid to euploid ratios (A/E) > 0.015. Abbreviations: Nul, nullisome; Tri, trisome; Mono, monosome. See also Figure S1.
Figure 2
Figure 2. Chromosome loss leads to cell cycle delays and cell-to-cell variability
(A–F) Following induction of chromosome mis-segregation, cells were imaged every 5 minutes for 8–10 hours. Division time (A) was calculated for monosomes (Mono) and normalized to euploid (WT) cells imaged during the same time-lapse. Log2 aneuploid to euploid ratios are plotted with lines at the mean. “AC” indicates arrested cells. Numbers on the x-axis labels indicate number of open reading frames on the aneuploid chromosome(s). Standard deviations (B–E) were measured and an F-test was used to test for equality of variance between the monosome and the euploid population from the same experiment (** = p≤ 0.01, *** = p ≤ 0.001, **** = p ≤ 0.0001). (F) The number of most slowly dividing cells (as percent of the total population) that need to be excluded from the monosome population to obtain equal variance with the euploid population is shown for G1 and S+early M phase. Note that we did not analyze strains harboring multiple monosomies. Many of these cells only undergo 1–2 cell divisions before arresting, which underreports variability as long-lived proteins have not yet adjusted to the monosomic state and thus have not yet become limiting. See also Figure S2 and Table S1.
Figure 3
Figure 3. Chromosome gain leads to cell-to-cell variability that is partially attenuated by increased ploidy
Cells were grown and imaged and disome (Dis) division times (A) and standard deviations (B,C,I–K) and trisome (Tri) division times (E) and standard deviations (F,G,I–K) were calculated as described in Figure 2 (** = p ≤ 0.01, *** = p ≤ 0.001, **** = p < 0.0001). The number of most slowly dividing cells (as percent of the total population) that need to be excluded from the disome (D) or trisome (H) population to obtain equal variance with the euploid population is shown for G1 and S+early M phase. Plots in I–K show only common aneuploidies between disomes and trisomes (chromosomes I, II, IV, V, X, XI, XII, XIV, and V+X). See also Figure S3 and Table S1.
Figure 4
Figure 4. Cell-to-cell variability is in part due to stochastic DNA damage
Cells were grown and imaged and division time (A), G1 length (B), and S+early M phase length (C) were calculated as described in Figure 2. Standard deviations for euploid (WT; E,G) and aneuploid (monosome, “Mono”; disome, “Dis”; D,F) populations were measured and an F-test was used to test for equality of variance between RAD9 and rad9Δ populations (* = p ≤ 0.05, ** = p ≤ 0.01, *** = p ≤ 0.001, **** = p < 0.0001). The data shown for RAD9 strains are the same as in Figures 2 and 3 and are duplicated here for comparison to rad9Δ. See also Figure S4 and Table S1.
Figure 5
Figure 5. G1 length variability is attenuated in yeast strains harboring chronic disomies
Chronic disomes were grown to mid-log phase in SC-D and imaged as described in Figure 2. Division time (A), G1 length (B), and S+early M phase length (C) were measured as described in Figure 2. Standard deviations for euploid (WT; E,G) and disome (Dis; D,F) populations were measured and an F-test was used to test for equality of variance between the acute and chronic populations (* = p ≤ 0.05, ** = p ≤ 0.01, *** = p ≤ 0.001, **** = p < 0.0001). The data shown for acute disomes are the same as in Figure 3. However, for all strains only data from the second cell division and beyond were included in this analysis to eliminate variation due to the carbon source switch used to induce chromosome mis-segregation in the acute disomes. Chronic disomes did not undergo a carbon source switch. See also Figure S5 and Table S1.
Figure 6
Figure 6. Cell-to-cell variability is increased in disomes in response to environmental perturbations
Mean (A,C,E) and standard deviation (B,D,F) of GAL1pr-YFP (A–B), P4xHSE-YFP (C–D), and P4xUPRE-GFP (E–F) expression at steady-state in conditions that robustly induce each reporter construct (n≥4 replicates). (G) Correlation between GAL1pr-YFP and TDH3pr-mCherry expression in single cells (n=4 experiments). All measurements (A–G) were normalized to SSC to account for differences in cell size. Asterisks (*) in A–G indicate statistical significance between disome (Dis) and euploid (WT) populations by Wilcoxon rank sum test. See also Figures S6, S7 and Table S2.
Figure 7
Figure 7. Non-genetic individuality in trisomic mice
(A) Trisomy 19 (Ts19) embryos and euploid (WT) littermates at gestational stage E15.5. Bar, 10 mm. (B) Nuchal edema thickness in euploid and trisomy 19 E15.5 embryos shown in (A). (C) Trisomy 13 (Ts13) embryos and euploid littermate at E15.5. Bar, 10 mm.

References

    1. Acar M, Mettetal JT, van Oudenaarden A. Stochastic switching as a survival strategy in fluctuating environments. Nat Genet. 2008;40:471–475. - PubMed
    1. Alvaro D, Sunjevaric I, Reid RJD, Lisby M, Stillman DJ, Rothstein R. Systematic hybrid LOH: a new method to reduce false positives and negatives during screening of yeast gene deletion libraries. Yeast Chichester Engl. 2006;23:1097–1106. - PubMed
    1. Anders KR, Kudrna JR, Keller KE, Kinghorn B, Miller EM, Pauw D, Peck AT, Shellooe CE, Strong IJT. A strategy for constructing aneuploid yeast strains by transient nondisjunction of a target chromosome. BMC Genet. 2009;10:36. - PMC - PubMed
    1. Arias AM, Hayward P. Filtering transcriptional noise during development: concepts and mechanisms. Nat Rev Genet. 2006;7:34–44. - PubMed
    1. Axelrod K, Sanchez A, Gore J. Phenotypic states become increasingly sensitive to perturbations near a bifurcation in a synthetic gene network. eLife. 2015:4. - PMC - PubMed