. 2017 Apr 6;169(2):243-257.e25.
doi: 10.1016/j.cell.2017.02.005.

Derivation of Pluripotent Stem Cells with In Vivo Embryonic and Extraembryonic Potency

Affiliations

Derivation of Pluripotent Stem Cells with In Vivo Embryonic and Extraembryonic Potency

Yang Yang et al. Cell. .

Abstract

Of all known cultured stem cell types, pluripotent stem cells (PSCs) sit atop the landscape of developmental potency and are characterized by their ability to generate all cell types of an adult organism. However, PSCs show limited contribution to the extraembryonic placental tissues in vivo. Here, we show that a chemical cocktail enables the derivation of stem cells with unique functional and molecular features from mice and humans, designated as extended pluripotent stem (EPS) cells, which are capable of chimerizing both embryonic and extraembryonic tissues. Notably, a single mouse EPS cell shows widespread chimeric contribution to both embryonic and extraembryonic lineages in vivo and permits generating single-EPS-cell-derived mice by tetraploid complementation. Furthermore, human EPS cells exhibit interspecies chimeric competency in mouse conceptuses. Our findings constitute a first step toward capturing pluripotent stem cells with extraembryonic developmental potentials in culture and open new avenues for basic and translational research. VIDEO ABSTRACT.

Keywords: chimeric ability; embryonic and extraembryonic developmental potentials; interspecies chimeric competency; single-cell derived chimeras.


Figures

Figure 1
Figure 1. Identification of a Chemical Cocktail that Supports hEPS Cell Generation
(A) Strategies used for screening compounds. (B–D) Representative images showing the generation of hEPS cells by conversion of primed hPSCs (B), by de novo derivation from human blastocysts (C), or by somatic reprogramming (D). Scale bars, 100 μm. See also Figure S1.
Figure 2
Figure 2. The LCDM Condition Can Support the Generation of mEPS Cells with Extended Developmental Potency
(A and B) Derivation of mEPS cells from blastocysts (A) and by conversion of mES cells (B). Scale bars, 100 μm. Td, Tdtomato fluorescent signal. (C) Representative images showing the integration of mEPS-derived cells (mc6-1, Tdtomato labeled, left panels) into the embryo, placenta and yolk sac. Conventional mES cells (mc2i-1, Tdtomato labeled, right panels) contribute to the embryo and yolk sac. In each image, samples on the right side are from one un-injected conceptus. Scale bars, 1 mm. (D) Summary of E12.5 chimera assays by multiple cell injection. The bar chart shows the percentages of chimeras (gray, integration into embryonic tissues [Em]; black, integration into both embryonic and E×Em placental tissues [Em & E×Em]) among the recovered E12.5 conceptuses. n indicates numbers of recovered E12.5 conceptuses. (E) Diagrams showing the injection of a single Tdtomato-labeled mEPS cell into an 8C-stage embryo, which was analyzed 48–60 hr later. Scale bar, 20 μm. (F) Summary of chimeric assays of single-cell injection at the 8C embryo stage. The bar chart shows the percentage of chimeras among the recovered blastocysts. ICM & TE, embryos with the integration of mouse cells into both ICM and TE. n indicates numbers of recovered blastocysts. (G) Representative images showing immunostaining of single mEPS-derived chimeric blastocysts with antibodies specific to ICM and TE markers. Td, direct observation of Tdtomato fluorescent signal. White arrow, Tdtomato+/CDX2+ cells (in the upper image) or Tdtomato+/GATA3+ cells (in the lower image); yellow arrows, Tdtomato+/OCT4+ cells (in the upper image) or Tdtomato+/NANOG+ cells (in the lower image). Scale bars, 20 μm. See also Figure S2.
Figure 3
Figure 3. ES and TS Cell Derivation from a Single-mEPS-cell-derived Chimeric Blastocyst
(A) Diagrams showing the injection of single mEPS cells into 8C embryos, which were used for establishing ES and TS cells 48–60 hr later. Representative images showing the derivation of both ES (EPS-ES, upper right panels) and TS (EPS-TS, lower right panels) cells from the same single mEPS-chimerized blastocysts. Td, Tdtomato fluorescent signal. Scale bars, 100 μm. (B) Summary of mEPS-derived ES and TS cell derivation from the same single-mEPS-chimerized embryos. (C) Diagrams showing the injection of multiple mES cells into 8C embryos, which were used for establishing ES and TS cells 48–60 hr later. Representative images showing the derivation of ES (2i-ES) but not TS cells from multiple mES-chimerized blastocysts. Td, Tdtomato fluorescent signal. Scale bars, 100 μm. (D) Representative images showing EPS-ES cells can integrate into E13.5 embryos but not placenta. Scale bar, 1 mm. In the lower panels, the embryo on the right side is from one un-injected conceptus. (E) Representative images showing EPS-TS cells can only integrate into placenta of E13.5 mouse conceptuses. In the right panels, the placentas on the right side are from an un-injected conceptus. Scale bars, 1 mm. See also Figure S3.
Figure 4
Figure 4. Single mEPS-Derived Cells Can Contribute To Both Embryonic and Extraembryonic Lineages In Vivo
(A) Representative FACS analysis of the percentages of single-mEPS-cell derivations (Td, Tdtomato labeled) from the same E10.5 conceptus. NC, samples isolated from an un-injected mouse E10.5 conceptus. (B–D) Representative whole-placenta confocal images showing single mEPS-derived cells (Tdtomato labeled) can contribute to trophoblastic lineages in chimeric E10.5 placentas. Single mES cells were injected as controls. The placentas were stained with anti-CK8 (B), anti-PROLIFERIN (C), and anti-TPBPA (D) antibodies. Td, direct observation of Tdtomato fluorescent signal; dec, decidua layer; gc, giant cell layer; sp, spongiotrophoblast layer; laby, labyrinth layer. The insets are enlargements of the yellow boxes. The pseudo-colors were used. Scale bars, 200 μm. (E) Representative images showing contribution of single mEPS-derived cells (Tdtomato labeled) into both embryo and placenta in E17.5 mouse conceptuses. Images for single mEPS-chimerized placentas shown in the left and right panels are taken from the same placental sample from different sides (front side in the left panel, back side in the right panel). For middle and right panels, samples on the left side in each image are from one un-injected conceptus. Scale bars, 2.5 mm. (F and G) Representative images showing single mEPS-derived chimeras (C1-EPS 19#) (F) and germline transmission of single mEPS cells (G). See also Table S3. (H) A representative image of single mEPS cell-derived mice (C1-EPS 12#) through tetraploid complementation. See also Figure S4.
Figure 5
Figure 5. A Single hEPS Cell Can Chimerize Both ICM and TE in Human-Mouse Interspecies Chimeric Blastocysts
(A and B) Diagrams showing a single fluorescent reporter-labeled hEPS cell was microinjected into one mouse 8C embryo, and the injected embryo was cultured for an additional 48–60 hr (A). Then, the embryos were co-immunostained with anti-OCT4 and anti-CDX2 antibodies (B). mClover, direct observation of mClover fluorescent signal; hN, immunostaining of hN; 488, fluorescent signal from the 488 channel. Primed hPSCs were injected as controls. White arrow, mClover+/CDX2+ cells; yellow arrow, mClover+/OCT4+ cells. Scale bars, 20 μm. (C) Summary of chimeric assays of single-cell injection using hEPS cells at the 8C embryo stage. Contribute into both ICM and TE: embryos with the integration of human cells into both ICM and TE. See also Figure S5.
Figure 6
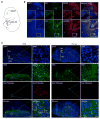
Figure 6. Interspecies Chimerism of hEPS Cells in E10.5 Mouse Conceptuses
(A) Schematic diagram of approximate section planes in hEPS-injected embryos at E10.5. The green and red boxes indicate the sagittal section of brain and heart region respectively. (B) Representative images showing the integration of hEPS-derived cells into mouse E10.5 embryos. Anti-human nuclei (hN) antibody was co-stained with anti-SOX2 (upper panels, the green box in (A)) and anti-GATA4 (lower panels, the red box in (A)) antibodies. The insets are enlargements of the yellow boxes. The pseudo-colors were used. Scale bars, 100 μm. (C) Representative whole-placenta confocal images showing Tdtomato-labeled hEPS derivatives can integrate to the trophoblast layers of the E10.5 chimeric placenta by co-staining with anti-Tdtomato and anti-cytokeratin 8 (CK8) antibodies. Primed hPSCs were injected as controls. Scale bars, 200 μm. The right panels are enlargements of the yellow boxes (scale bars, 20 μm). dec, decidua layer; gc, giant cell layer; sp, spongiotrophoblast layer; laby, labyrinth layer. The pseudo-colors were used. See also Figure S6.
Figure 7
Figure 7. Analyses of Molecular Features of EPS Cells and the Roles of DiM and MiH in Maintaining EPS Developmental Potency
(A and B) PCA analysis of RNA-seq and microarray data from EPS cells and known PSC types. Log2 expression values were normalized to mES cells (A) or primed hPSCs (B) in each study. For (A), data from mEPS cells (this study), mES cells (each study), 2C-like cells (Macfarlan et al. (2012)), and epiblast stem cells (Najm et al. (2011)) were analyzed, and a total of 17,243 genes were selected. For (B), data from hEPS cells (this study), naive hPSCs (Takashima et al. (2014), Chan et al. (2013), Gafni et al. (2013), and Theunissen et al. (2014)), and primed hPSCs (each study) were analyzed, and a total of 15,958 genes were selected. Circles, RNA-seq data; triangles, microarray data. (C and D) Heatmaps showing the presence of EPS-specific gene modules in mEPS (C) and hEPS (D) cells when compared to mES cells (C) and primed hPSCs (D) respectively. Correlations between genes and samples were calculated using Euclidean distance (complete linkage). Log2 expression values were normalized to mES cells (C) or primed hPSCs (D) in each study. hESC, primed hPSCs. To compare EPS cells with embryonic cells from preimplantation stages, data from Tang et al. (2011) (C) and Yan et al. (2013) (D) were analyzed. (E) Analyses of the influence of DiM or MiH substitution and Parp1 knockout on the chimeric ability of mEPS cells. Multiple cells were injected. The bar chart shows the percentage of chimeras among the recovered blastocysts. n indicates numbers of recovered blastocysts. ICM & TE, embryos with the integration of mouse cells into both ICM and TE. (F) Representative images of hEPS colonies after the omission of DiM, MiH or both from the LCDM condition. Scale bar, 100 μm. (G) Representative images of hEPS colonies at passage 7 after DiM or MiH substitution. Scale bars, 100 μm. (H) Analyses of the influence of DiM or MiH substitution on the chimeric ability of hEPS cells. Multiple cells were injected. The bar chart shows the percentage of chimeras among the recovered blastocysts. n indicates numbers of recovered blastocysts. ICM & TE, embryos with the integration of human cells into both ICM and TE. TH, tripelennamine HCL; DES, desloratadine; NAM, nicotinamide. PD, PD 0325901; SB, SB 203580; SP: SP 600125. See also Figure S7.

References

    1. Abad M, Mosteiro L, Pantoja C, Cañamero M, Rayon T, Ors I, Graña O, Megías D, Domínguez O, Martínez D, et al. Reprogramming in vivo produces teratomas and iPS cells with totipotency features. Nature. 2013;502:340–345. - PubMed
    1. Alano CC, Kauppinen TM, Valls AV, Swanson RA. Minocycline inhibits poly(ADP-ribose) polymerase-1 at nanomolar concentrations. Proc Natl Acad Sci USA. 2006;103:9685–9690. - PMC - PubMed
    1. Beddington RS, Robertson EJ. An assessment of the developmental potential of embryonic stem cells in the midgestation mouse embryo. Development. 1989;105:733–737. - PubMed
    1. Brons IG, Smithers LE, Trotter MW, Rugg-Gunn P, Sun B, Chuva de Sousa Lopes SM, Howlett SK, Clarkson A, Ahrlund-Richter L, Pedersen RA, Vallier L. Derivation of pluripotent epiblast stem cells from mammalian embryos. Nature. 2007;448:191–195. - PubMed
    1. Buehr M, Meek S, Blair K, Yang J, Ure J, Silva J, McLay R, Hall J, Ying QL, Smith A. Capture of authentic embryonic stem cells from rat blastocysts. Cell. 2008;135:1287–1298. - PubMed

Publication types