. 2017 Apr 6;169(2):258-272.e17.
doi: 10.1016/j.cell.2017.03.023.

Physiologic Medium Rewires Cellular Metabolism and Reveals Uric Acid as an Endogenous Inhibitor of UMP Synthase

Affiliations

Physiologic Medium Rewires Cellular Metabolism and Reveals Uric Acid as an Endogenous Inhibitor of UMP Synthase

Jason R Cantor et al. Cell. .

Abstract

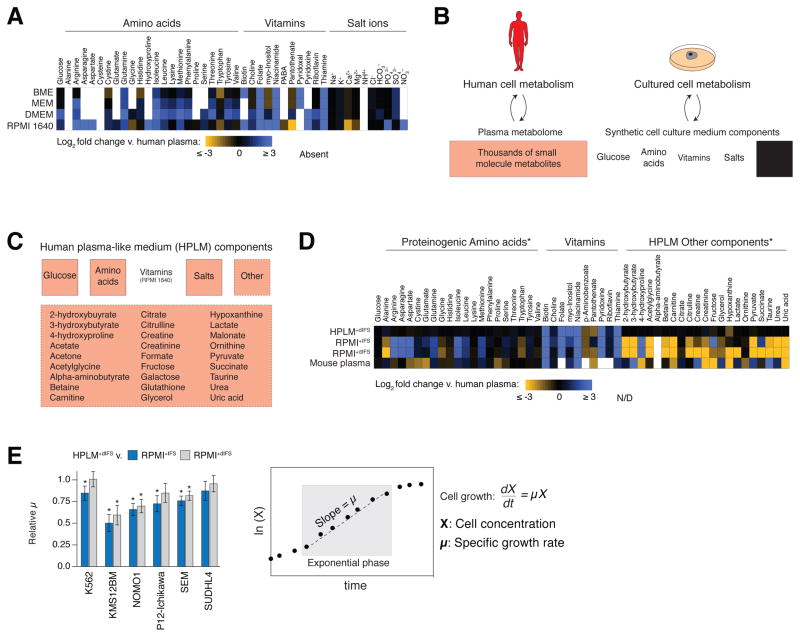
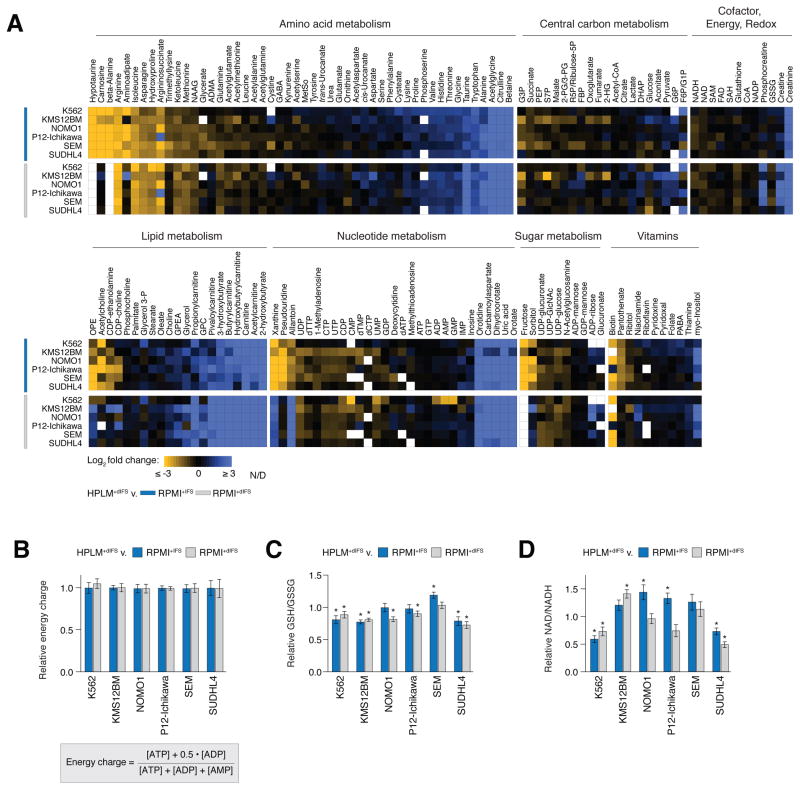
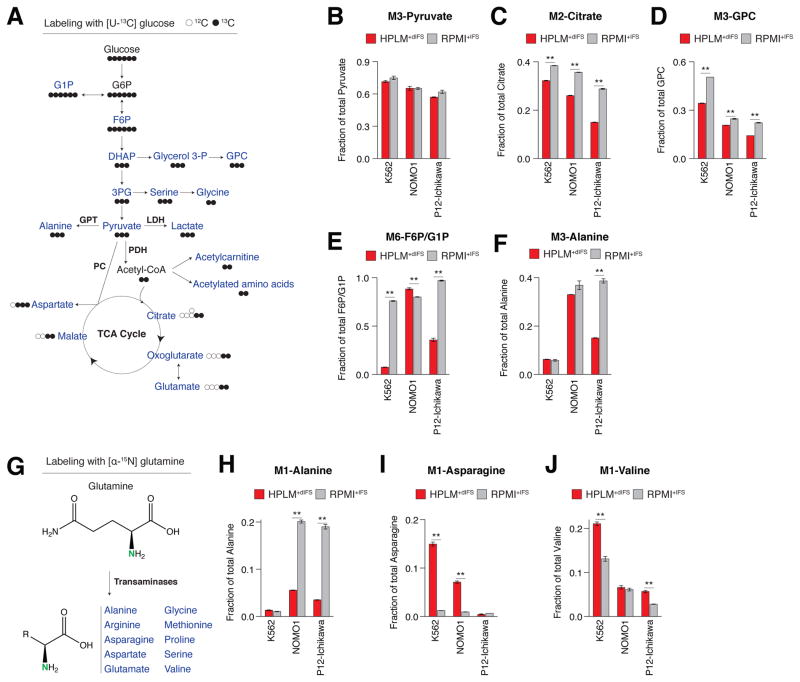
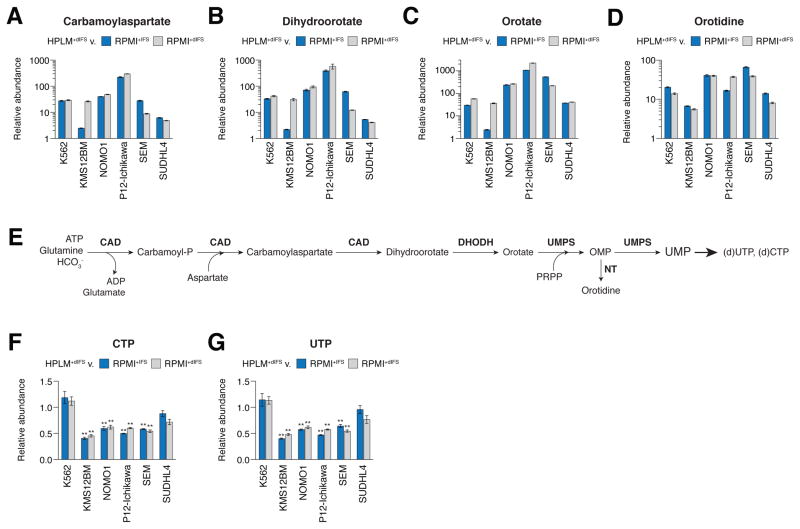
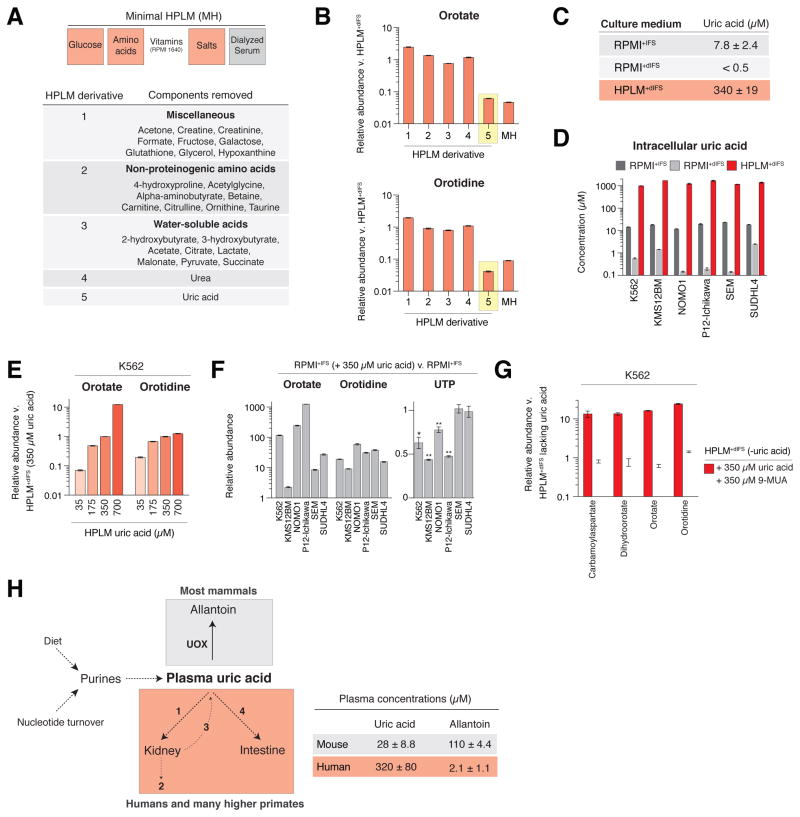
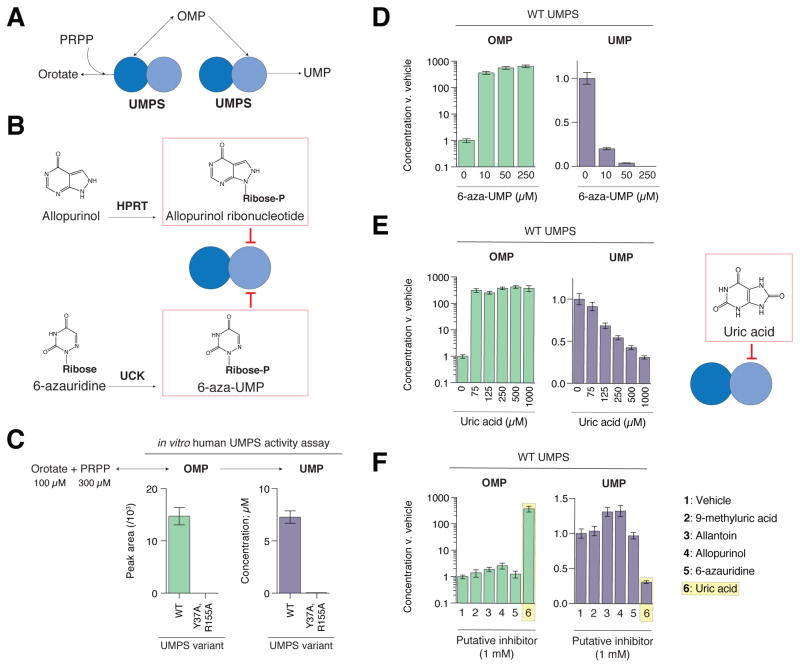
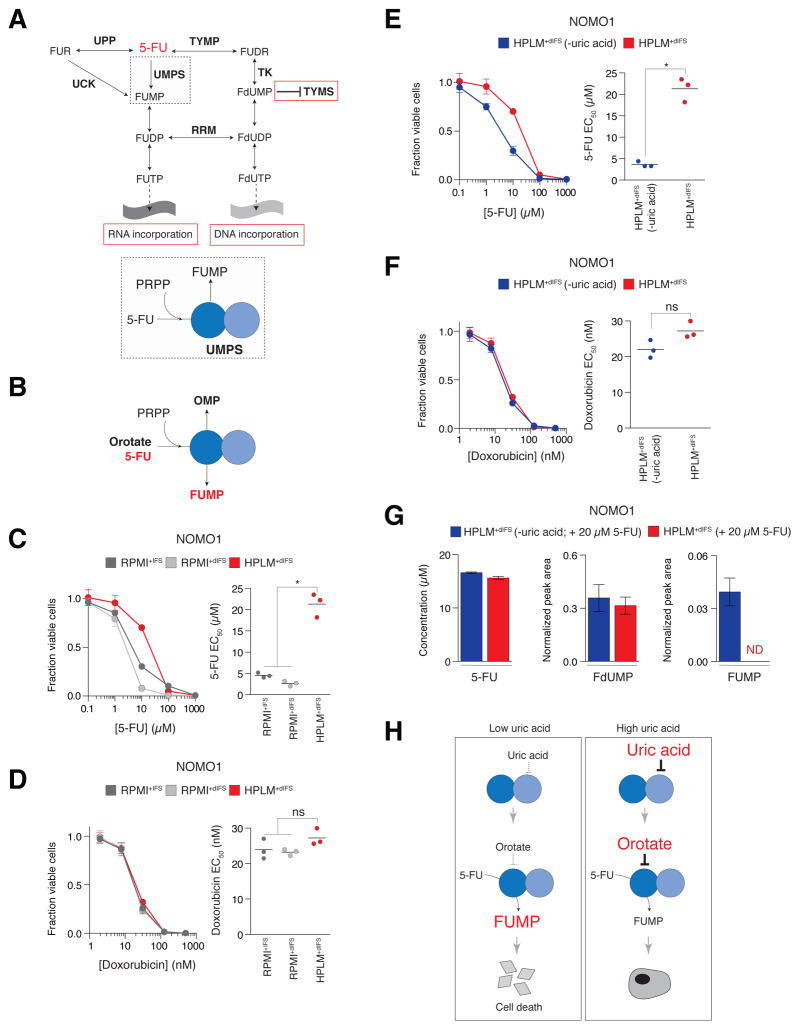
A complex interplay of environmental factors impacts the metabolism of human cells, but neither traditional culture media nor mouse plasma mimic the metabolite composition of human plasma. Here, we developed a culture medium with polar metabolite concentrations comparable to those of human plasma (human plasma-like medium [HPLM]). Culture in HPLM, relative to that in traditional media, had widespread effects on cellular metabolism, including on the metabolome, redox state, and glucose utilization. Among the most prominent was an inhibition of de novo pyrimidine synthesis-an effect traced to uric acid, which is 10-fold higher in the blood of humans than of mice and other non-primates. We find that uric acid directly inhibits uridine monophosphate synthase (UMPS) and consequently reduces the sensitivity of cancer cells to the chemotherapeutic agent 5-fluorouracil. Thus, media that better recapitulates the composition of human plasma reveals unforeseen metabolic wiring and regulation, suggesting that HPLM should be of broad utility.

Keywords: UMPS; cell culture; human-like; metabolism; metabolomics; plasma; pyrimidine synthesis; serum; uric acid.


Figures

Figure 1
Figure 1. Figure 1, see also Figure S1 and Table S1: A cell culture medium that reflects the polar metabolite composition of human plasma
(A) Heatmap of relative concentrations of the indicated components of BME, MEM, DMEM, and RPMI 1640 compared to those in adult human plasma (log2-transformed fold changes). Components not present in a medium are marked as absent. See Table S1 for further detail regarding this heatmap and the concentrations of all metabolites. (B) Schematic depicting the different metabolic milieus to which cells in culture and in vivo are exposed. (C) Components of human plasma-like medium (HPLM). The concentrations of the components depicted by red-colored boxes reflect those in adult human plasma. See Table S1 for the detailed formulation of HPLM. (D) Heatmap of relative concentrations of the indicated components in denoted media and mouse plasma compared to those in human plasma (log2-transformed fold changes). N/D, fold change value could not be determined. See Table S1 for detailed criteria used to generate this heatmap and for the concentrations of all metabolites. RPMI+IFS: RPMI 1640 with 5 mM glucose and 10% IFS. RPMI+dIFS: RPMI 1640 with 5 mM glucose and 10% dialyzed IFS. HPLM+dIFS: HPLM containing 10% dialyzed IFS. *The following metabolites were not readily detected in media samples by the metabolite profiling method used: acetate, acetone, cysteine, formate, galactose, glutathione, and malonate. (E) Relative growth rates of six hematological cancer cell lines cultured in HPLM+dIFS compared to in RPMI+IFS (blue) or in RPMI+dIFS (gray) (mean ± SD, n = 3; *p < 0.05) (left). Specific growth rates (μ) were calculated using natural log-transformed growth curves (right). Cell lines represent the following hematological cancers: K562 (chronic myeloid leukemia), KMS12BM (multiple myeloma), NOMO1 (acute myeloid leukemia), P12-Ichikawa (T-cell acute lymphoblastic leukemia), SEM (B-cell acute lymphoblastic leukemia), SUDHL4 (B-cell lymphoma).
Figure 2
Figure 2. Figure 2, see also Figure S2 and Table S2: Culture of cells in HPLM extensively alters their metabolic landscape
(A) Heatmap of relative intracellular metabolite concentrations following culture in HPLM+dIFS compared to that in RPMI+IFS (top six rows) or to RPMI+dIFS (bottom six rows). Within each group, metabolites are sorted by average log2-transformed fold change of the top six rows (n = 3). N/D, fold change value could not be determined because the metabolite was not readily detected following culture in one or more of the media. To be included in the heatmap, metabolites had to have a fold change measured in at least four of the six cell lines. See Table S2 for detailed criteria used to generate this heatmap, metabolite abbreviations, and the concentrations of all metabolites. (B) Energy charge values, as calculated by the displayed equation, following culture in HPLM+dIFS compared to that in RPMI+IFS (blue) or to RPMI+dIFS (gray) (mean ± SD, n = 3). (C) Intracellular GSH/GSSG ratios following culture in HPLM+dIFS compared to that in RPMI+IFS (blue) or to RPMI+dIFS (gray) (mean ± SD, n = 3, *p < 0.05). (D) Intracellular NAD/NADH ratios following culture in HPLM+dIFS compared to that in RPMI+IFS (blue) or to RPMI+dIFS (gray) (mean ± SEM, n = 3, *p < 0.05).
Figure 3
Figure 3. Figure 3, see also Figure S3 and Table S2: Culture of cells in HPLM+dIFS affects the utilization of glucose carbons and the α-amino nitrogen of glutamine
(A) Schematic depicting the incorporation of 13C from glucose into pathways branching from glycolysis and into pyruvate, and various fates of glucose-derived carbon from pyruvate and Acetyl-CoA, including into the TCA cycle. See Table S2 for 13C labeling patterns for metabolites in blue. G1P: glucose 1-phosphate. G6P: glucose 6-phosphate. F6P: fructose 6-phosphate. DHAP: dihydroxyacetone phosphate. GPC: glycerophosphocholine. PDH: pyruvate dehydrogenase. LDH: lactate dehydrogenase. GPT: alanine aminotransferase. (B) Fraction of pyruvate labeled with three 13C (M3) following culture of cells in HPLM+dIFS (red) or RPMI+IFS (gray) (mean ± SD, n = 3). (C) Fraction of citrate labeled with two 13C (M2) following culture of cells in HPLM+dIFS (red) or RPMI+IFS (gray) (mean ± SD, n = 3; **p < 0.0005). (D) Fraction of GPC labeled with three 13C (M3) following culture of cells in HPLM+dIFS (red) or RPMI+IFS (gray) (mean ± SD, n = 3; **p < 0.0005). (E) Fraction of F6P/G1P labeled with six 13C (M6) following culture of cells in HPLM+dIFS (red) or RPMI+IFS (gray) (mean ± SD, n = 3; **p < 0.0005). (F) Fraction of alanine labeled with three 13C (M3) following culture of cells in HPLM+dIFS (red) or RPMI+IFS (gray) (mean ± SD, n = 3; **p < 0.0005). (G) Schematic depicting the transaminase-mediate transfer of 15N from the α-amino nitrogen of glutamine onto various amino acids. See Table S2 for 15N labeling patterns for amino acids in blue. (H) Fraction of alanine labeled with one 15N (M1) following culture of cells in HPLM+dIFS (red) or RPMI+IFS (gray) (mean ± SD, n = 3; **p < 0.0005). (I) Fraction of asparagine labeled with one 15N (M1) following culture of cells in HPLM+dIFS (red) or RPMI+IFS (gray) (mean ± SD, n = 3; **p < 0.0005). (J) Fraction of valine labeled with one 15N (M1) following culture of cells in HPLM+dIFS (red) or RPMI+IFS (gray) (mean ± SD, n = 3; **p < 0.0005).
Figure 4
Figure 4. Figure 4, see also Figure S4: Culture in HPLM+dIFS greatly affects the intracellular abundances of metabolites involved in pyrimidine metabolism
(A–D) Relative intracellular abundances of carbamoylaspartate (A), dihydroorotate (B), orotate (C), and orotidine (D) following culture of cells in HPLM+dIFS compared to that in RPMI+IFS (blue) or RPMI+dIFS (red) (mean ± SD, n = 3; p < 0.0005 for all bars). (E) Schematic depicting the de novo pyrimidine synthesis pathway. NT: nucleotidase. (F and G) Relative intracellular abundances of CTP (F) and UTP (G) following culture of cells in HPLM+dIFS compared to that in RPMI+IFS (blue) or RPMI+dIFS (gray) (mean ± SD, n = 3, **p < 0.0005).
Figure 5
Figure 5. The uric acid component of HPLM+dIFS mediates the effects of HPLM+dIFS on pyrimidine metabolism
(A) Composition of minimal HPLM (top) and list of components removed from HPLM+dIFS to generate the indicated dropout formulations (bottom). (B) Relative intracellular abundances of orotate (top) and orotidine (bottom) following culture of cells in each HPLM+dIFS derivative or minimal HPLM (MH) compared to that in complete HPLM+dIFS (mean ± SD, n = 3). The number designations of the HPLM+dIFS derivatives correspond to those in panel A. (C) Concentrations of uric acid in RPMI+IFS and HPLM+dIFS as measured by LC/MS-based metabolite profiling (n = 4). Uric acid could not be readily detected in RPMI+dIFS by the metabolite profiling method used. Thus, the indicated concentration for RPMI+dIFS approximately corresponds to that of minimum detection in media samples. (D) Intracellular concentrations of uric acid following culture of cells in RPMI+IFS, RPMI+dIFS, or HPLM+dIFS (mean ± SD, n = 3). (E) Relative intracellular abundances of orotate and orotidine following culture of K562 cells in HPLM+dIFS containing increasing concentrations of uric acid compared to that in standard HPLM+dIFS, which contains 350 μM uric acid (mean ± SD, n = 3). (F) Relative intracellular abundances of orotate, orotidine (left) (mean ± SD, n = 3; p < 0.0005 for all bars), and UTP (mean ± SD, n = 3; *p < 0.005; **p < 0.0005) (right) following culture of cells in RPMI+IFS supplemented with 350 μM uric acid compared to that in RPMI+IFS. (G) Relative intracellular abundances of carbamoylaspartate, dihydroorotate, orotate, and orotidine following culture of K562 cells in HPLM+dIFS containing either 350 μM uric acid (red) or 350 μM uric acid 9-methyluric acid (9-MUA) (white) compared to that in HPLM+dIFS lacking uric acid (mean ± SD, n = 3). (H) Schematic depicting the pathways that influence the plasma concentrations of uric acid; 1: glomerular filtration (70%), 2: secretion (10%), 3: reabsorption (90%), 4: excretion (30%) (Bobulescu and Moe, 2012). In contrast to most mammals, humans and many higher primates lack uricase (UOX) activity, which converts uric acid to allantoin (left). Concentrations of uric acid and allantoin in mouse plasma as measured by metabolite profiling in this study (n = 4). Average concentration of uric acid in human plasma calculated from annotated values in the Human Metabolome Database. Concentration of allantoin in human plasma as reported elsewhere (Kand’ár and Záková, 2008) (right).
Figure 6
Figure 6. Figure 6, see also Figures S5 and S6: Uric acid is a direct inhibitor of UMPS
(A) Schematic depicting the reactions catalyzed by each domain of bifunctional UMP synthase (UMPS). OPRT: orotate phosphoribosyltransferase. ODC: OMP decarboxylase. (B) Schematic depicting competitive inhibition of the ODC domain of UMPS by allopurinol ribonucleotide (top) and 6-aza-UMP (bottom). Hypoxanthine-guanine phosphoribosyltransferase (HPRT) catalyzes the conversion of allopurinol to its ribonucleotide derivative, and uridine-cytidine kinase (UCK) catalyzes that of 6-azauridine to 6-aza-UMP. (C) Quantification of OMP (left) and UMP (right) following incubation of recombinant UMPS (WT or the Y37A, R155A mutant) with its substrates orotate and PRPP at the indicated concentrations (mean ± SD, n = 3). WT: wild-type. (D) Relative abundances of OMP (left) and UMP (right) following addition of increasing concentrations of 6-aza-UMP or vehicle to the UMPS activity assay (mean ± SD, n = 3). (E) Relative abundances of OMP (left) and UMP (middle) following addition of increasing concentrations of uric acid or vehicle to the UMPS activity assay (mean ± SD, n = 3). Schematic depicting competitive inhibition of the ODC domain of UMPS by uric acid (right). (F) Relative abundances of OMP (left) and UMP (right) following addition of 9-methyluric acid, allantoin, allopurinol, 6-azauridine, uric acid, or vehicle to the UMPS activity assay (mean ± SD, n = 3).
Figure 7
Figure 7. Figure 7, see also Figure S7: Uric acid antagonizes the cytotoxicity of 5-fluorouracil
(A) Schematic depicting the metabolism of 5-fluorouracil (5-FU) (top). 5-FU is converted into various fluoronucleotide derivatives that mediate its cytotoxic effects. Fluorouridine triphosphate (FUTP) and fluorodeoxyuridine triphosphate lead to cell death upon misincorporation into RNA and DNA, respectively. Fluorodeoxyuridine monophosphate (FdUMP) leads to cell death by inhibition of thymidylate synthase (TYMS) (Longley et al., 2003). Enzymes depicted are uridine phosphorylase (UPP), uridine-cytidine kinase (UCK), thymidine phosphorylase (TYMP), thymidine kinase (TK), and ribonucleotide reductase (RRM). Other metabolites indicated are fluorouridine (FUR), fluorouridine monophosphate (FUMP), fluorouridine diphosphate (FUDP), fluorodeoxyuridine (FUDR), and fluorodeoxyuridine diphosphate (FdUDP). The OPRT domain of UMPS catalyzes the direct conversion of 5-FU to FUMP (bottom). (B) Schematic showing that the OPRT domain of UMPS catalyzes the conversions of orotate to OMP and 5-FU to FUMP. (C and D) Dose-response of NOMO1 cells to 5-FU (C) or doxorubicin (D) when cultured in RPMI+IFS (dark gray), RPMI+dIFS (light gray), or HPLM+dIFS (red) (mean ± SD, n = 9). Data points are the average of three independent biological experiments that each consisted of three technical replicates (left). EC50 of 5-FU (C) or doxorubicin (D) in NOMO1 cells when cultured in RPMI+IFS (dark gray), RPMI+dIFS (light gray), or HPLM+dIFS (red). Horizontal bar indicates the mean of three independent biological experiments; * p < 0.001; ns: not significant (right). (E and F) Dose-response of NOMO1 cells to 5-FU (E) or doxorubicin (F) when cultured in HPLM+dIFS (green) or HPLM+dIFS lacking uric acid (blue) (mean ± SD, n = 9). Data points are the average of three independent biological experiments that each consisted of three technical replicates (left). EC50 of 5-FU (C) or doxorubicin (D) in NOMO1 cells when cultured in HPLM+dIFS (red) or HPLM+dIFS lacking uric acid (blue). Horizontal bar indicates the mean of three independent biological experiments; * p < 0.001; ns: not significant (right). (G) Intracellular abundances of 5-FU (left), FdUMP (middle), and FUMP (right) in NOMO1 cells treated with 20 μM 5-FU and cultured for 24 hr in HPLM+dIFS (red) or HPLM+dIFS lacking uric acid (blue) (mean ± SD, n = 3). ND: not detected. (H) Proposed mechanism of uric acid-mediated antagonism of cytotoxicity caused by 5-FU. As either the OPRT domain of UMPS or the sequential actions of UPP and UCK can convert 5-FU to FUMP, the influence of uric acid on 5-FU sensitivity likely depends on the extent that a given cell type generates FUMP via OPRT-mediated synthesis.

References

    1. Adelman R, Saul RL, Ames BN. Oxidative damage to DNA: relation to species metabolic rate and life span. Proc Natl Acad Sci U S A. 1988;85:2706–2708. - PMC - PubMed
    1. Atkinson DE. Energy charge of the adenylate pool as a regulatory parameter. Interaction with feedback modifiers. Biochemistry. 1968;7:4030–4034. - PubMed
    1. Álvarez-Lario B, Macarrón-Vicente J. Uric acid and evolution. Rheumatology. 2010;49:2010–2015. - PubMed
    1. Bailey CJ. Orotic aciduria and uridine monophosphate synthase: A reappraisal. J Inherit Metab Dis. 2009;32:227–233. - PubMed
    1. Birsoy K, Possemato R, Lorbeer FK, Bayraktar EC, Thiru P, Yucel B, Wang T, Chen WW, Clish CB, Sabatini DM. Metabolic determinants of cancer cell sensitivity to glucose limitation and biguanides. Nature. 2014;508:108–12. - PMC - PubMed

MeSH terms