. 2017 Apr 6;169(2):286-300.e16.
doi: 10.1016/j.cell.2017.03.020.

ESCRT-III Acts Downstream of MLKL to Regulate Necroptotic Cell Death and Its Consequences

Affiliations

ESCRT-III Acts Downstream of MLKL to Regulate Necroptotic Cell Death and Its Consequences

Yi-Nan Gong et al. Cell. .

Abstract

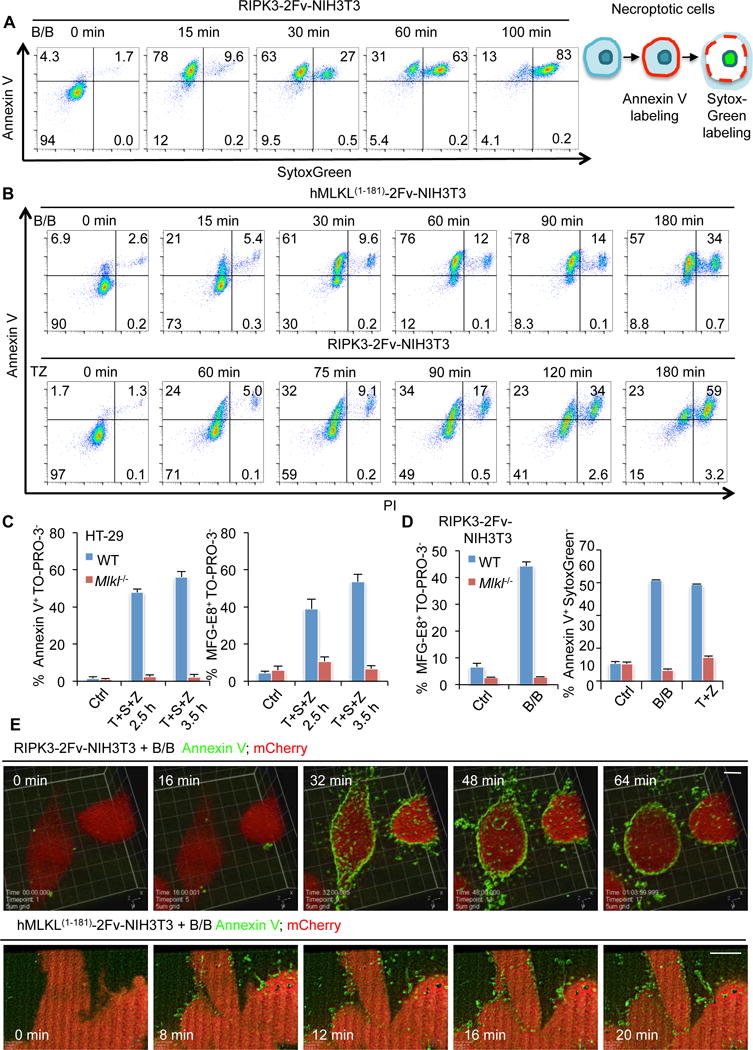
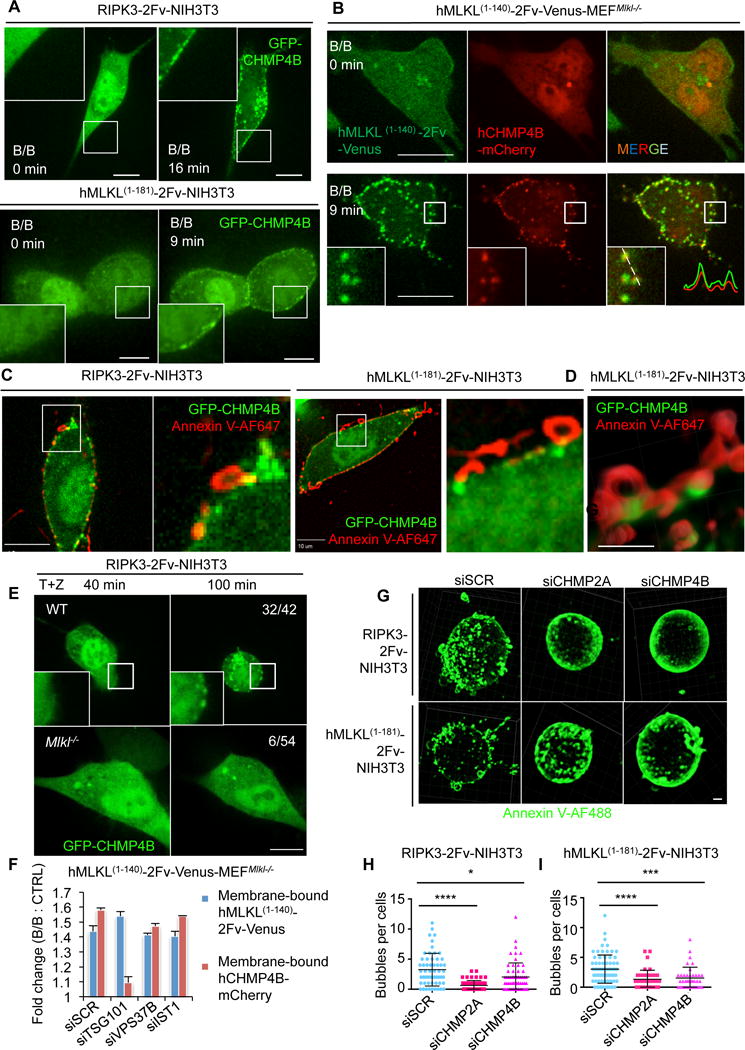
The activation of mixed lineage kinase-like (MLKL) by receptor-interacting protein kinase-3 (RIPK3) results in plasma membrane (PM) disruption and a form of regulated necrosis, called necroptosis. Here, we show that, during necroptosis, MLKL-dependent calcium (Ca2+) influx and phosphatidylserine (PS) exposure on the outer leaflet of the plasma membrane preceded loss of PM integrity. Activation of MLKL results in the generation of broken, PM "bubbles" with exposed PS that are released from the surface of the otherwise intact cell. The ESCRT-III machinery is required for formation of these bubbles and acts to sustain survival of the cell when MLKL activation is limited or reversed. Under conditions of necroptotic cell death, ESCRT-III controls the duration of plasma membrane integrity. As a consequence of the action of ESCRT-III, cells undergoing necroptosis can express chemokines and other regulatory molecules and promote antigenic cross-priming of CD8+ T cells.

Keywords: ESCRT-III; MLKL; annexin-V; necroptosis; phosphatidylserine; plasma membrane repair.


Figures

Figure 1
Figure 1. PS externalization occurs prior to loss of plasma membrane integrity during necroptosis
(A) Flow cytometric analysis of 100 nM B/B dimerizer-treated RIPK3-2Fv-NIH3T3 cells stained with SytoxGreen and AnnV-APC at the indicated time points. (B) Flow cytometric analysis of hMLKL1–181-2Fv-NIH3T3 cells treated with 100 nM B/B dimerizer (upper panels) or RIPK3-2Fv-NIH3T3 cells treated with 20 ng/mL TNFα plus 100 μM zVAD (TZ) (lower panels). Cells were stained with AnnV-APC and PI at the indicated time points. (C) HT-29 cells (WT or Mlkl−/) were treated with 50 ng/mL TNFα, 10 μM Lcl-161, and 100 μM zVAD (TSZ) for the indicated times. PS exposure was assessed by AnnV-FITC and TO-PRO-3 or MFG-E8-FITC and TO-PRO-3 staining before analysis by flow cytometry. (D) RIPK3-2Fv-NIH3T3 cells (WT or Mlkl−/) were treated with 100 nM B/B for 30 min or TZ for 90 min. PS exposure was assessed as in (C). (E) Time lapsed, Z-stacked confocal images of 100 nM B/B treated and AnnV-FITC (green) stained RIPK3-2Fv-NIH3T3 (upper panel) or hMLKL1–181-2Fv-NIH3T3 (lower panel) cells. Cells express mCherry (red) to demarcate cell body. Scale bar=5 μm (upper panel) and 10 μm (lower panel).
Figure 2
Figure 2. Shedding of PS-exposed plasma membrane bubbles during necroptosis
(A) Quantification of bubble formation. Z-stacked confocal images of DiI stained necroptotic RIPK3-2Fv-NIH3T3 (WT or Mlkl−/) cells were analyzed and bubbles ≥0.5 μm were counted. Each point represents one cell analyzed. **** p < 0.0001, Student unpaired t-test. (B) Doxycycline (Dox) inducible hMLKL(1–140)-2Fv-Venus-MEF Mlkl−/− cells were treated with 2 μg/mL Dox overnight, followed by addition of 25 nM B/B and AnnV-AF647 (red). Time lapsed images were recorded by confocal microscopy. Scale bar=10 μm. (C) Enlarged, time lapsed images of the two regions indicated in (B). Scale bar=1 μm. (D) Images of B/B treated RIPK3-2Fv-NIH3T3 cells processed for TEM. (E) Confocal microscope images of hMLKL1–181-2Fv-NIH3T3 (upper panel) and RIPK3-2Fv-NIH3T3 (lower panel) cells, treated with 100 nM B/B. Cells expressed mCherry (red) and were stained with AnnV-AF488 (green) and 10 kD Dextran-NH2-AF647 (violet). Scale bar=10 μm.
Figure 3
Figure 3. The ESCRT-III machinery mediates plasma membrane shedding during necroptosis
(A) Confocal microscope images of 100 nM B/B treated, GFP-CHMP4B expressing RIPK3-2Fv-NIH3T3 or hMLKL1–181-2Fv-NIH3T3 cells. Scale bar=10 μm. (B) Dox-inducible hMLKL(1–140)-2Fv-Venus (green) in Mlkl−/− MEF, transiently transfected with hCHMP4B-mCherry (red), were treated with 2 μg/mL Dox overnight, followed by 25 nM B/B. Time lapsed images were recorded by confocal microscopy. Scale bar=10 μm. Insets: (lower left) enlargement of indicated box, (lower right) fluorescent intensities along the dashed line. (C–D) Confocal microscope images of GFP-CHMP4B-expressing RIPK3-2Fv-NIH3T3 (left panel of C) and hMLKL1–181-2Fv-NIH3T3 (right panel of C and D), treated with 100 nM B/B and stained with AnnV-AF647 (red). Enlargements of the boxed areas are shown in the images on the right. Scale bar=10 μm. D shows a Z-stacked rendering. Scale bar=1 μm. (E) Confocal microscope images of GFP-CHMP4B-expressing RIPK3-2Fv-NIH3T3 (WT and Mlkl−/−) cells treated with TZ. Scale bar=10 μm. Values are (cells with translocated CHMP4B)/(total cell). (F) Persistence of hCHMP4B-mCherry and hMLKL(1–140)-2Fv-Venus in digitonin-treated cells, following MLKL activation. Dox-inducible hMLKL(1–140)-2Fv-Venus in mlkl−/− MEF were silenced with the indicated siRNA and treated as in (B). 100 nM B/B was added (30 min), and cells were treated with digitonin before FACS analysis. MFI for Venus and mCherry were compared with and without B/B. An MFI ratio fold-change of the B/B-treated/control cells of 1 indicates no difference in the persistence of the fluorescent signal. (G–I) Z-stack confocal microscope images of RIPK3-2Fv-NIH3T3 (upper panel) and hMLKL1–181-2Fv-NIH3T3 (lower panel), transfected with the indicated siRNA (72 h), followed by addition of B/B (100 nM, 30 min). Cells were stained with AnnV-AF488. Scale bar=1 μm. For the quantification of bubbles (H and I), bubbles ≥0.5 μm were counted in Z-stacked confocal images. Each point represents one cell analyzed. (*p < 0.05, *** p < 0.001, **** p < 0.0001, unpaired Student’s t-test).
Figure 4
Figure 4. ESCRT-III antagonizes necroptotic cell death
(A) Incucyte images of SytoxGreen stained RIPK3-2Fv-NIH3T3 and hCHMP2A-expressing RIPK3-2Fv-NIH3T3 cells transfected with the indicated siRNA for 72h. Values are the percentage of SytoxGreen+ cells (determined by flow cytometry). Scale bar=100 μm. (B) Flow cytometric quantification of SytoxGreen+ RIPK3-2Fv-NIH3T3 cells transfected with the indicated siRNA for 72 h. (C–D) Representative Incucyte images at 90 hrs (C) and quantification over time (D) of SytoxGreen stained L929 cells transfected with the indicated siRNA. Scale bar=100 μm. (E) Incucyte quantification of SytoxGreen+ L929 and L929 Mlkl−/− cells transfected with the indicated siRNA. MLKL deletion was confirmed by western blot. (F) Incucyte quantification of SytoxGreen+ L929 cells transfected with the indicated siRNA in the presence or absence of 60 μM Nec-1s. Nec-1s was added at 50 h post siRNA transfection. (G) Incucyte quantification of SytoxGreen+ L929 cells with indicated siRNA in the presence or either 15 μg/mL control rat IgG or anti-TNF IgG (α-TNF). Antibodies were added at 48 h post siRNA transfection. (H–L) Incucyte quantification of SytoxGreen+ L929 cells transfected with the indicated siRNA. Cells were treated with control media (H), 20 ng/mL TNFα (I), 20 ng/mL TNFα plus 60 μM Nec-1s (J), 50 μM zVAD (K, necroptosis) or 20 ng/mL TNFα, 60 μM Nec-1s, or 10 μg/mL Cycloheximide (L, apoptosis). Treatments were added 68h post transfection. (M) Confocal quantification of survival time of GCaMP3-expressing hMLKL1–181-2Fv-NIH3T3 cells treated with 100 nM B/B. Each point indicates one cell. “Survival time” is the time from GCaMP3 fluorescence (Ca++ influx) to loss of plasma membrane integrity. (**p < 0.01, unpaired Student’s t-test). For all Incucyte quantification, data are presented as mean of at least triplicate samples. For all FACS quantification, data are presented as mean of triplicate samples. In all cases, error bars are s.d.
Figure 5
Figure 5. ESCRT-III allows necroptotic cells to signal
(A) qRT-PCR quantification of transcriptional induction of CXCL10 and CXCL1 in hMLKL1–181-2Fv-NIH3T3 cells following the addition of 100 nM B/B addition. Data are mean of triplicate samples ± s.d. (B–C) ELISA measurement of CXCL10 (B) and CXCL1 (C) secretion in hMLKL1–181-2Fv-NIH3T3 cells stimulated with 100 nM B/B. Data are mean of at least triplicate samples ± s.d. (D–E) Representative Incucyte images (D) and quantification (E) of SytoxGreen+ RIPK3-2Fv-iMacs (immortalized macrophages) cells stimulated with 100 nM B/B. Scale bar=100 um. For Incucyte quantification (E), data are mean of triplicate samples ± s.d. (F) IL-1α, IL-1β, IL-6, CXCL10 and TNFα secretion of the cells in (D, 20 h post B/B addition), measured by Luminex. Data are mean of triplicate samples ± s.d. ND, non-detectable. (pg/mL) (G) TNFα secretion, measured by ELISA, of the RIPK3-2Fv-iMacs cells stimulated with 5 ug/mL LPS for 4.5 h. Data are mean of triplicate samples ± s.d. (pg/mL) (H–I) ESCRT-III controls the efficiency of induction of T cell cross-priming by necroptotic cells. Each point represents one lymph node (H) or the mean value of two lymph nodes from the same mouse (I). Color indicates lymph nodes from the same mice (H). Transferrin receptor ovalbumin fusion protein (TfR-OVA) was either transiently (H) or stably (I) expressed in RIPK3-2Fv-NIH3T3 cells. Cells were treated with the indicated siRNA for 72 hrs, followed by exposure to B/B (100 nM for 25 min) and injected into mice i.d. After 9 days, Pentamer+ CD8+ T cells were assessed by FACS. (ns—not statistically significant, * p < 0.05, ** p < 0.01, *** p < 0.001, one-way ANOVA with Tukey test).
Figure 6
Figure 6. Cells with active MLKL can be resuscitated
(A) Sorting strategy for AnnV+ and SytoxGreen RIPK3-2Fv-NIH3T3 cells. Cells in the red gate were sorted for the following experiments. (B–C) The sorted cells from (A) were then treated with B/B (20 nM), control media or washout ligand (3 uM) for 7 h and analyzed by FACS. “Resuscitated” cells are circled in red. Quantification of cell resuscitation is shown in (C). (D) Clonogenic survival of the cells from (C). (E) Representative Incucyte imaging of RIPK3-2Fv-NIH3T3 cell resuscitation. Cells were treated with 20 nM B/B for 45 min before the direct addition of 3 μM washout ligand. (F) Immunoblotting of phosphorylated MLKL (pMLKL) and total MLKL in cells from (C). (G) Incucyte quantification of SytoxGreen+ parental RIPK3-2Fv-NIH3T3 cells and the recovered RIPK3-2Fv-NIH3T3 cells from (C), after treatment with 100 nM B/B. (H–I) FACS plots and quantification of cell resuscitation of RIPK3-2Fv-iMacs treated as in (A–C). Cell death was induced by 20 nM B/B for 2 h, followed by cell sorting (red box) and addition of washout agent. Resuscitated cells are circled in red. (J–K) HT-29 cells were treated with TSZ and AnnV+ SytoxGreen (red box) were sorted. Cells were then cultured with 5 μM NSA. Cell resuscitation was assessed as in (A and B). Quantification is shown in (K). (L) Clonogenic survival of the cells from (J). (M) Immunoblotting of phosphorylated MLKL (pMLKL) and total MLKL of the cells from (J). (N) Incucyte quantification of SytoxGreen+ parental HT-29 cells and the recovered HT-29 from (J), following treatment with TSZ. For all FACS quantification, data are mean of triplicate samples ± s.d. (ns—not statistically significant, ** p < 0.01, unpaired Student’s t-test). For all Incucyte quantification, data are mean of at least triplicate samples ± s.d.
Figure 7
Figure 7. ESCRT machinery preserves cell survival in cells with active MLKL
(A–B) Cells transfected with the indicated siRNA were treated and resuscitated as in Figure 6 (A–C). Shown are representative FACS plots (A) and quantification (B). (C) HT-29 cells were transfected with the indicated siRNA and resuscitated as in Figure 6 (J). Quantification of resuscitation was assessed by flow cytometry. (D) The effect of silencing of assorted ESCRT machinery components on the efficiency of RIPK3-2Fv-NIH3T3 cell resuscitation. (E) Xenograft tumor growth of RIPK3-2Fv-NIH3T3 cells, treated with the indicated siRNA, followed by B/B and resuscitation. Cells were treated with B/B for 45 min, AnnV+ SytoxGreen cells were sorted, followed by treatment with washout ligand for 45 min in vitro before intra-dermal injection. Tumor volume was assessed after 2 weeks. (ns—not statistically significant, * p < 0.05, one-way ANOVA with Tukey test). (F–G) A clone of RIPK3-2Fv-iMacs cells (noted as RIPK3-2Fv-iMacs*) was stimulated with 100 nM B/B for 20 h. Shown in (F) are representative Incucyte images and the percentage of SytoxGreen+ cells. Data are mean of triplicate samples ± s.d. Clonogenic survival of the cells from (F) is shown in (G). (H) Phospho-MLKL in B/B (2.5 h)-treated RIPK3-2Fv-iMacs* cells, determined by western blot. (I–K) Sections of matched pairs of pre-transplant and post-transplant human renal biopsies were stained with human pMLKL (S358). Note that in the post-transplant section, the endothelial cells with pMLKL staining had an intact plasma membrane. Quantification is shown in (J) (n=7) (*** p < 0.001, paired Student’s t-test). (K) RNA-seq data from the matched pairs of pre-transplant and post-transplant biopsies in (I). (n=10) (*p < 0.05, *** p < 0.001, paired Student’s t-test). For all FACS quantification, data are mean of triplicate samples ± s.d. (ns—not statistically significant, ** p < 0.01, unpaired Student’s t-test).

Comment in

  • ESCRTing Necroptosis.
    Guo H, Kaiser WJ. Guo H, et al. Cell. 2017 Apr 6;169(2):186-187. doi: 10.1016/j.cell.2017.03.030. Cell. 2017. PMID: 28388403
  • Cell death: ESCRTing dying cells back to life.
    Strzyz P. Strzyz P. Nat Rev Mol Cell Biol. 2017 Jun;18(6):342-343. doi: 10.1038/nrm.2017.46. Epub 2017 Apr 21. Nat Rev Mol Cell Biol. 2017. PMID: 28429789 No abstract available.
  • Necroptosis: (Last) Message in a Bubble.
    Vandenabeele P, Riquet F, Cappe B. Vandenabeele P, et al. Immunity. 2017 Jul 18;47(1):1-3. doi: 10.1016/j.immuni.2017.07.002. Immunity. 2017. PMID: 28723543

References

    1. Albert ML, Sauter B, Bhardwaj N. Dendritic cells acquire antigen from apoptotic cells and induce class I-restricted CTLs. Nature. 1998;392:86–89. - PubMed
    1. Andrews NW, Almeida PE, Corrotte M. Damage control: cellular mechanisms of plasma membrane repair. Trends Cell Biol. 2014;24:734–742. - PMC - PubMed
    1. Carlton J. The ESCRT machinery: a cellular apparatus for sorting and scission. Biochem Soc Trans. 2010;38:1397–1412. - PubMed
    1. Choudhuri K, Llodra J, Roth EW, Tsai J, Gordo S, Wucherpfennig KW, Kam LC, Stokes DL, Dustin ML. Polarized release of T-cell-receptor-enriched microvesicles at the immunological synapse. Nature. 2014;507:118–123. - PMC - PubMed
    1. Christ L, Raiborg C, Wenzel EM, Campsteijn C, Stenmark H. Cellular Functions and Molecular Mechanisms of the ESCRT Membrane-Scission Machinery. Trends Biochem Sci. 2017;42:42–56. - PubMed

Publication types