. 2017 Apr 6;169(2):338-349.e11.
doi: 10.1016/j.cell.2017.03.028.

Multidimensional Tracking of GPCR Signaling via Peroxidase-Catalyzed Proximity Labeling

Affiliations

Multidimensional Tracking of GPCR Signaling via Peroxidase-Catalyzed Proximity Labeling

Jaeho Paek et al. Cell. .

Abstract

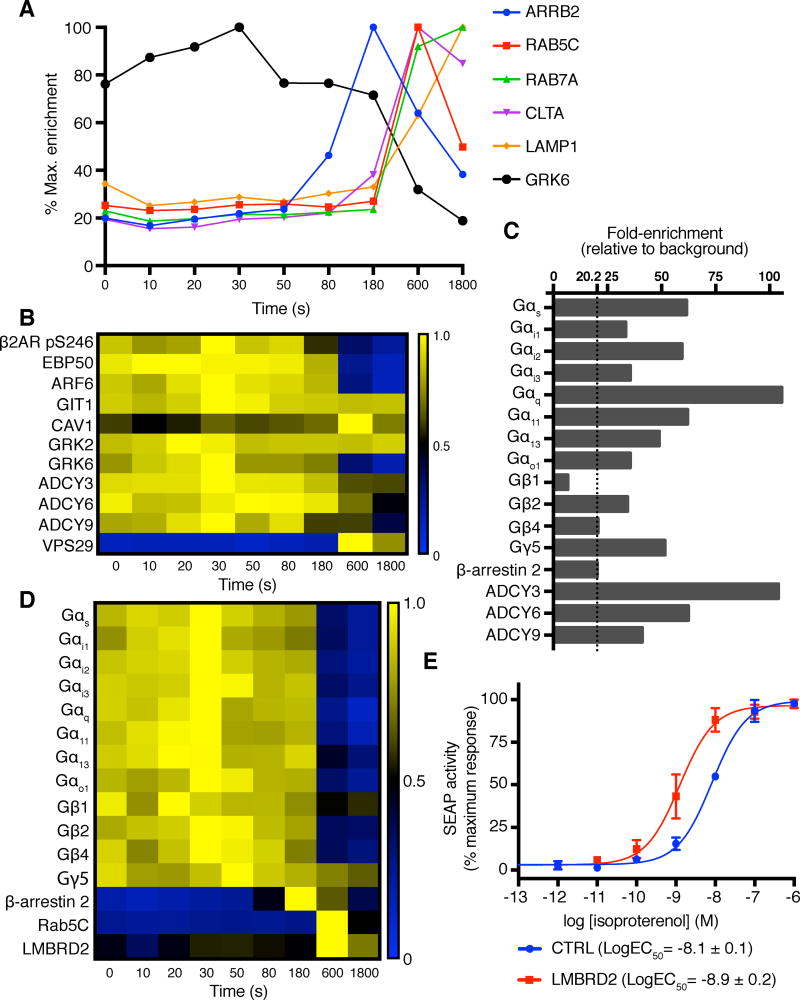
G-protein-coupled receptors (GPCRs) play critical roles in regulating physiological processes ranging from neurotransmission to cardiovascular function. Current methods for tracking GPCR signaling suffer from low throughput, modification or overexpression of effector proteins, and low temporal resolution. Here, we show that peroxidase-catalyzed proximity labeling can be combined with isobaric tagging and mass spectrometry to enable quantitative, time-resolved measurement of GPCR agonist response in living cells. Using this technique, termed "GPCR-APEX," we track activation and internalization of the angiotensin II type 1 receptor and the β2 adrenoceptor. These receptors co-localize with a variety of G proteins even before receptor activation, and activated receptors are largely sequestered from G proteins upon internalization. Additionally, the two receptors show differing internalization kinetics, and we identify the membrane protein LMBRD2 as a potential regulator of β2 adrenoceptor signaling, underscoring the value of a dynamic view of receptor function.

Keywords: APEX; G-protein-coupled receptor; GPCR; isobaric tagging; mass spectrometry; proximity labeling; signal transduction.


Figures

Figure 1
Figure 1. Design and experiment procedure of proximity-labeling by AT1R-APEX
(A) Schematic of APEX2-mediated protein labeling. The angiotensin receptor (AT1R) fused to APEX2 at its carboxy-terminus via a glycine-serine linker biotinylates proteins in proximity (< 20 nm) to the receptor in an unbiased manner, allowing identification and quantification of interactions between the receptor and its effectors at distinct time points after ligand treatment. (B) Proximity-labeling and mass spectrometric analysis workflow for AT1R-APEX. Four different pairs of biological replicates were prepared to assess reproducibility of labeling/proteomic analysis in both short and long time points for agonist/antagonist treatment. Biotin-labeled proteins were purified by TCA precipitation followed by denaturing streptavidin pull-down and tandem mass tag labeling to allow quantitative mass spectrometric analysis of 10 different samples in parallel. See also Figure S1.
Figure 2
Figure 2. Analysis of AT1R-APEX experiment reproducibility and changes in biotinylated proteome upon agonist-mediated receptor activation
(A) Biotinylated proteins from a proximity-labeling experiment analyzed by streptavidin-HRP blot. Clear changes in band patterns were observed for agonist-treated samples in comparison to antagonist-treated/ligand-free samples. (B) Representative linear regression analysis of biologically independent replicates treated with angiotensin II for 2 minutes. This analysis confirms high reproducibility in protein abundance measurements. (C) Fold-enrichment of detected G-protein subunits and β-arrestin 2 relative to the background levels measured in H2O2-untreated cells. β-arrestin 2 is included as a reference to assess significant enrichment levels over background. (D) Linear regression analysis of protein abundances in losartan-treated samples vs. ligand-free sample. No distinct change in biotinylated proteome was observed. Errors shown as means ± SEM for two biological replicates. (E) Enrichment of selected factors in angiotensin II-treated samples relative to the ligand-free sample. Data shown as means ± SEM for two biological replicates. (F) Volcano plots for 2 minute agonist vs. antagonist-treatment. Select proteins with effect size greater than 4 are marked based on gene ontology. Higher effect size represents higher enrichment upon angiotensin-treatment. P-values were Benjamini-Hochberg corrected (Hochberg and Benjamini, 1990). See also Figure S2 and Table S1.
Figure 3
Figure 3. AT1R-APEX timecourse experiment with the balanced full agonist angiotensin II
(A) Schematic of proximity-labeling experiment protocol for timecourse experiment (B) Timecourse of AT1R internalization revealed by relative abundances of proximal proteins following agonist treatment. β-arrestin 2 (ARRB2), clathrin (CLTA), and early endosomal marker Rab5 (RAB5C) maximally enrich at 180 s, followed by maximum enrichments of late endosomal Rab7 (RAB7A) and lysosomal (LAMP1) markers. (C) Enrichment pattern heatmap of G protein subunits, β-arrestin 2, and Rab5. Following internalization and the β-arrestin 2 enrichment peak at 180 s, receptor-proximal G protein levels drop substantially. Each protein’s enrichment level across different time points is normalized to its maximum enrichment signal. (D) Linear plot of G alpha and beta subunits detected during short time points (0 – 80 s), showing initial drop in enrichment followed by a slow rise and then fall. (E) Enrichment pattern heatmap of endosomal marker transferrin receptor (TFRC) and components of retromer complex VPS29 and SNX1. See also Figure S3 and Table S2.
Figure 4
Figure 4. AT1R-APEX timecourse experiment with β-arrestin biased agonist TRV 027
(A) Linear plot tracing receptor internalization and trafficking following TRV027 treatment. As in angiotensin II timecourse experiments, β-arrestin 2, clathrin, and Rab5 enrichment levels peak at 180 s, followed thereafter by maximal recruitment of late endosomal markers: Rab7 and V-type proton ATPase catalytic subunit A (ATP6V1A). (B) Enrichment pattern heatmap of G protein subunits, β-arrestin 2, and Rab5. As in angiotensin II treatment, the recruitment of β-arrestin 2 and receptor internalization occurs commensurate with a loss of receptor-proximal G proteins. Each protein’s enrichment level across different time points is normalized to its maximum enrichment signal. (C) Linear plot of G protein subunits detected during short time points (0 – 80 s). (D) Enrichment pattern heatmap of endosomal marker transferrin receptor (TFRC) and components of retromer complex VPS29 and SNX1. See also Figure S3 and Table S2.
Figure 5
Figure 5. β2AR-APEX timecourse experiment with extremely potent β2AR agonist BI 167107
(A) Internalization kinetics of β2AR (class A GPCR) are different from those of AT1R (class B GPCR). β-arrestin is recruited with the peak at 180 s, but clathrin recruitment is delayed to 600 s. Also, Rab5 enrichment peak is at 600 s, indicating arrestin-receptor complex formation and endosomal entry do not occur simultaneously. Late endosomal marker Rab7 and lysosomal marker LAMP1 enrichment peaks appear afterward. (B) Enrichment pattern heatmap of selected proteins. Each protein’s enrichment level across different time points is normalized to its maximum enrichment signal. Receptor internalization results in a loss of receptor-proximal EBP50, ARF6, and GRK6. However, ARF6 activator GIT1, GRK2, and adenylyl cyclase 3 (ADCY3) enrichment levels remained constant. Adenylyl cyclases 6 and 9 (ADCY6 and ADCY9) show moderate decrease in enrichment levels upon receptor internalization. However, significant portion of these proteins remained in proximity of β2AR (>40% of maximum enrichment levels). Gs/adenylyl cyclase signaling attenuator caveolin-1 (CAV1) and retromer component VPS29 highly enrich during internalization (600 s). Heatmap of β2AR S246 phosphorylation level shows a drop in phosphorylation commensurate with receptor internalization. (C) Fold-enrichment of detected G protein subunits, β-arrestin 2, and adenylyl cyclases prior to ligand treatment. Fold enrichment in each case is relative to levels in control samples that are not treated with hydrogen peroxide (background). β-arrestin 2 is included as a reference to assess significant enrichment levels over background. (D) Heatmap of all G protein subunits detected shows almost all G proteins are excluded from endosomes regardless of their subtypes. (E) β2AR signaling assay to examine LMBRD2 knockdown. HEK293T cells transfected with LMBRD2 siRNA showed a statistically significant difference (decrease) in EC50 in comparison to control siRNA-transfected cells (P < 0.0001). Data points for ligand-free cells are not shown. All measurements were performed in triplicate and data are representative of three independent experiments. Data shown as means ± SEM, with EC50 values reported as LogEC50 ± 95% confidence interval for the experiment shown here. See also Figure S4, Figure S5, and Table S3.

References

    1. Allen JA, Jiang ZY, Dave RH, Bhatnagar A, Roth BL, Rasenick MM. Caveolin-1 and lipid microdomains regulate Gs trafficking and attenuate Gs/adenylyl cyclase signaling. Mol Pharmacol. 2009;76:1082–1093. - PMC - PubMed
    1. Beausoleil SA, Villén J, Gerber SA, Rush J, Gygi SP. A probability-based approach for high-throughput protein phosphorylation analysis and site localization. Nature biotechnology. 2006;24:1285–1292. - PubMed
    1. Cao TT, Deacon HW, Reczek D, Bretscher A, von Zastrow M. A kinase-regulated PDZ-domain interaction controls endocytic sorting of the β2-adrenergic receptor. Nature. 1999;401:286–290. - PubMed
    1. Claing A, Chen W, Miller WE, Vitale N, Moss J, Premont RT, Lefkowitz RJ. β-Arrestin-mediated ADP-ribosylation Factor 6 Activation and β2-Adrenergic Receptor Endocytosis. Journal of Biological Chemistry. 2001;276:42509–42513. - PubMed
    1. Gilman AG. G Proteins and Regulation of Adenylate Cyclase (Nobel Lecture) Angewandte Chemie International Edition in English. 1995;34:1406–1419.

MeSH terms