. 2017 Apr 6;169(2):350-360.e12.
doi: 10.1016/j.cell.2017.03.022.

An Approach to Spatiotemporally Resolve Protein Interaction Networks in Living Cells

Affiliations

An Approach to Spatiotemporally Resolve Protein Interaction Networks in Living Cells

Braden T Lobingier et al. Cell. .

Abstract

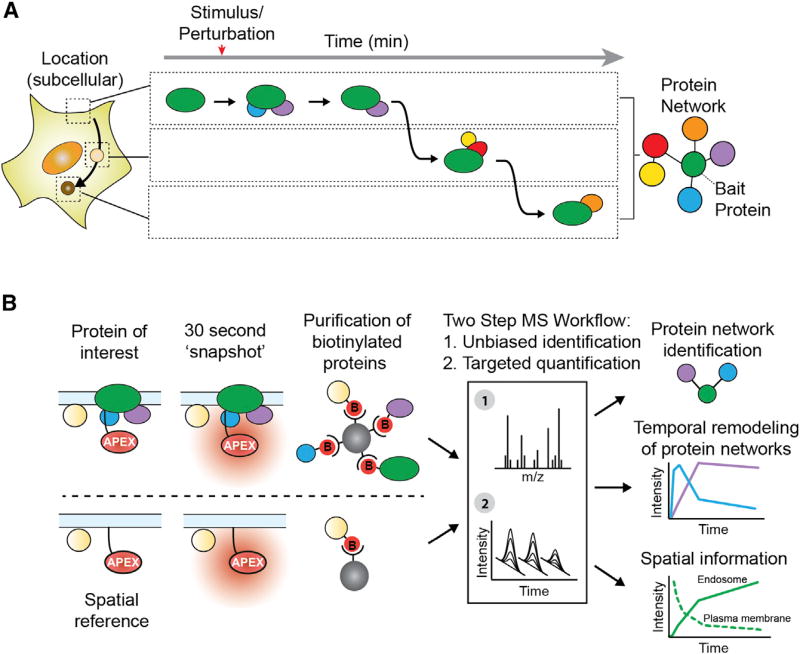
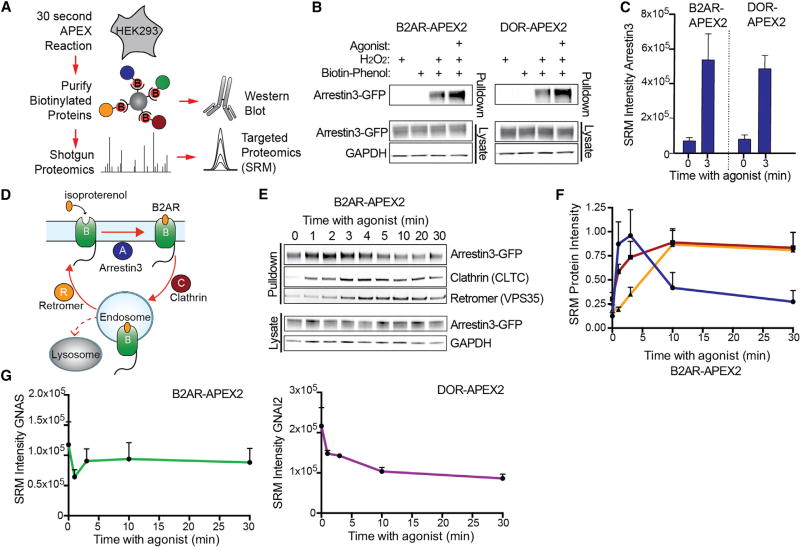
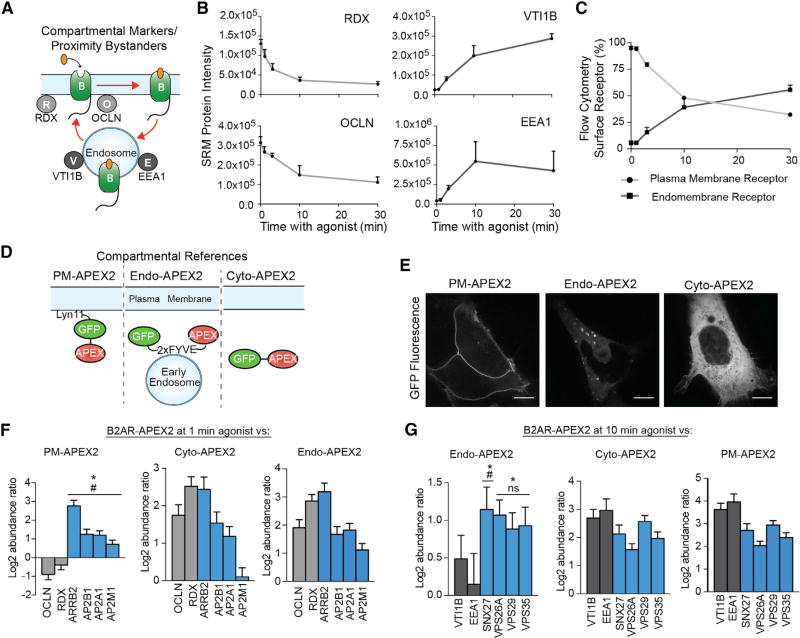
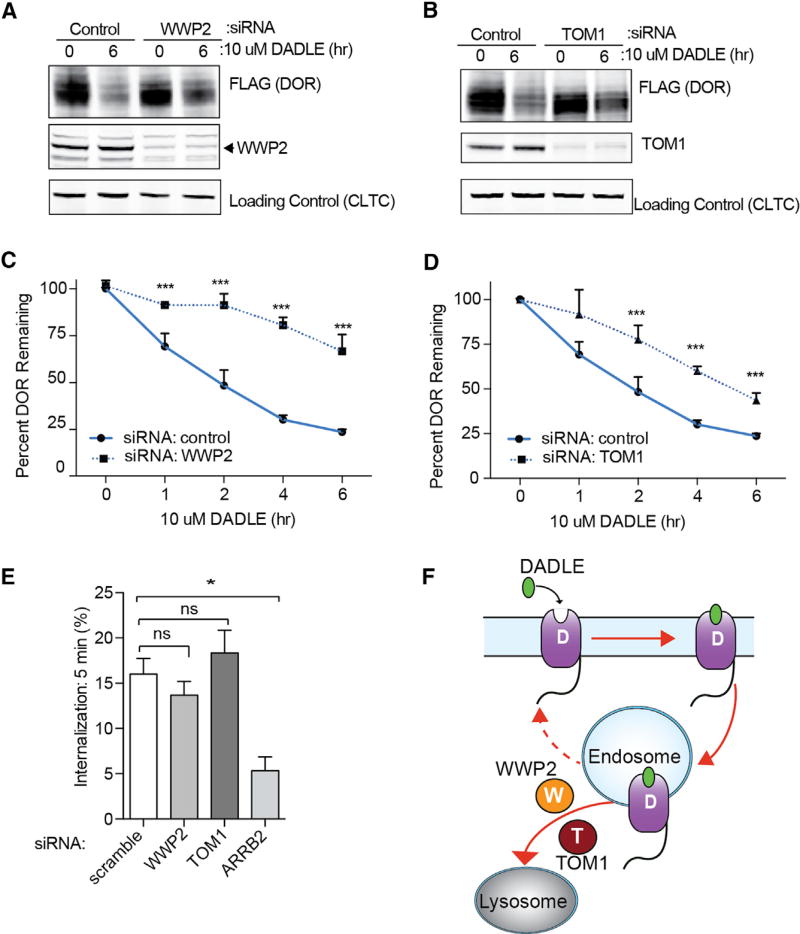
Cells operate through protein interaction networks organized in space and time. Here, we describe an approach to resolve both dimensions simultaneously by using proximity labeling mediated by engineered ascorbic acid peroxidase (APEX). APEX has been used to capture entire organelle proteomes with high temporal resolution, but its breadth of labeling is generally thought to preclude the higher spatial resolution necessary to interrogate specific protein networks. We provide a solution to this problem by combining quantitative proteomics with a system of spatial references. As proof of principle, we apply this approach to interrogate proteins engaged by G-protein-coupled receptors as they dynamically signal and traffic in response to ligand-induced activation. The method resolves known binding partners, as well as previously unidentified network components. Validating its utility as a discovery pipeline, we establish that two of these proteins promote ubiquitin-linked receptor downregulation after prolonged activation.

Keywords: APEX; GPCR; adrenergic receptor; mass spectrometry; opioid receptor; proximity labeling.


Figures

Figure 1
Figure 1. Time-Resolved Proximity Labeling with Spatially Specific Deconvolution to Identify Local Protein Interaction Networks and Subcellular Location
(A) Spatiotemporal dynamics of a theoretical protein interaction network responding to a stimulus/perturbation. (B) Workflow for identifying local protein network composition and subcellular location: (1) 30-s APEX labeling for time-resolved “snapshots” of the local proteome; (2) APEX-tagged spatial references to deconvolve compartment bystanders from pathway-specific protein interaction networks; and (3) a two-step mass spectrometric workflow to compare relative abundances of proteins biotinylated by the target and spatial references.
Figure 2
Figure 2. APEX Captures GPCR Protein Interaction Networks
(A) APEX workflow for western blot or mass spectrometric analysis of known GPCR protein interaction network components. (B) Western blot analysis of arrestin3-GFP biotinylation captured by streptavidin agarose showing negative controls, unstimulated cells, or cells stimulated with agonist for 3 min before 30-s APEX labeling. (C) Targeted proteomics comparison of endogenous arrestin3 biotinylation captured by streptavidin agarose between unstimulated cells or agonist-stimulated cells. Data from four independent experiments are presented as mean + SEM. (D) Graphical representation of location- and time-specific functions of arrestin3 (blue), clathrin (red), and Retromer (orange) with B2AR (“B”; green). (E) Western blot analysis of agonist-dependent biotinylation by B2AR-APEX2 of arrestin3-GFP, clathrin heavy chain (CLTC), and Retromer complex (subunit VPS35). Pull-down on streptavidin agarose. (F) Targeted proteomics analysis of agonist-dependent biotinylation by B2AR-APEX2 of endogenous arrestin3 (blue), CLTC (red), and VPS35 (yellow). Data from four independent experiments are presented as mean + SEM. (G) Targeted proteomics analysis of agonist-dependent biotinylation of GNAS (green; by B2AR-APEX2) or GNAI2 (purple; by DOR-APEX2). Data from four independent experiments are presented as mean + SEM. See also Figure S1 and Tables S1, S5, and S6.
Figure 3
Figure 3. Spatially Specific References Allow GPCR Interactors to be Differentiated from General Compartmental Proteins
(A) Compartmental bystanders along the agonist-stimulated B2AR (“B”) trafficking route: RDX and OCLN at the plasma membrane and EEA1 and VTI1B at endosomes. (B) Targeted proteomics analysis of compartmental protein bystanders biotinylated in B2AR-APEX2 cells in unstimulated cells or cells stimulated with isoproterenol for the noted times prior to biotinylation. Data from four independent experiments are presented as mean + SEM. (C) Flow cytometric measurements of agonist induced B2AR-APEX2 trafficking. Data from three independent experiments are presented as mean + SEM. (D) APEX-tagged constructs targeting APEX2 to the plasma membrane, early endosome, or cytoplasm. (E) Micrographs of PM-APEX2, Endo-APEX2, and Cyto-APEX2 using live-cell confocal imaging (scale bar, 10 µm). (F and G) Relative protein abundance of biotinylated receptor-specific protein complexes (blue bars) or plasma membrane bystanders (light gray bars) comparing B2AR-APEX2 after (F) 1 min agonist stimulation or (G) 10 min agonist stimulation to PM-APEX2, Cyto-APEX2, or ENDO-APEX2 measured by targeted proteomics analysis. Statistical significance was calculated using one-way ANOVA (alpha = 0.05) with multiple comparisons correction. Differences in protein abundance between receptor-specific protein complexes and bystanders noted as (F) OCLN (#) and RDX (*) or (G) VTI1B (#), and EEA1 (*). Data from four independent experiments are presented as mean + SEM. See also Figures S2 and S3 and Tables S2 and S5.
Figure 4
Figure 4. Time-Resolved Proximity Labeling with Spatially Specific Deconvolution Identifies Interacting Partners for the Delta Opioid Receptor
(A) Spatially specific APEX proximity-profiling using shotgun proteomics and SAINT scoring to identify candidate DOR interaction network components and subsequent targeted proteomics for abundance quantification and hierarchical clustering of their temporal profiles. (B) SAINT confidence scoring of the shotgun proteomics data for DOR-APEX2 compared to time-specific combined spatial references, false discovery rate (FDR), and fold change (FC) plotted. All proteins with an FDR of zero were given a value of 0.001 for plotting. Proteins passing the selected SAINT FDR cutoff (< 0.05) are colored in red as candidates. Proteins previously observed to be enriched in the plasma membrane proteome or endosome proteomes (Figure S3B) are colored in blue or green, respectively. All other proteins are shown in gray. Data from three independent experiments are presented as mean. (C) Relative abundance quantification of SAINT hits using targeted proteomics. Abundance ratio was calculated comparing DOR and the time-specific combined spatial reference for each time point after agonist. Proteins significantly more abundant in the DOR sample (p < 0.05) than the spatial reference are colored in red, and all others are in gray. Data from four independent experiments are presented as mean + SEM. (D) Hierarchical clustering for DOR interaction network proteins using the normalized abundance from targeted proteomics analysis. The non-reference controlled LAMP1 cluster was removed (see Figure S4D for full cluster). See also Figure S4 and Tables S3, S4, and S5.
Figure 5
Figure 5. Identification of WWP2 or TOM1 as Ubiquitin Network Components Required for DOR Trafficking to Lysosomes
(A and B) Western blots for DOR (FLAG), WWP2, TOM1, or loading control (CLTC) from HEK293 cells stably expressing FLAG-DOR (no APEX2 tag) and treated with scramble or siRNAs to WWP2 (A) or TOM1 (B) for 72 hr. Cells were either untreated (0 hr) or agonist stimulated (6 hr). (C and D) Quantification of FLAG-DOR in HEK293 cells treated with scramble or siRNAs to WWP2 (C) or TOM1 (D) for 72 hr. Cells were either untreated or agonist stimulated for the noted time. Data from three independent experiments are presented as mean + SEM. (E) Flow cytometric measurements of agonist induced DOR internalization in either cells treated with scramble or siRNAs to WWP2 or TOM1 for 72 hr. Data from three independent experiments are presented as mean + SEM. (F) Model of TOM1 and WWP2 function in endosomal sorting of DOR. See also Figure S5.

References

    1. Aoh QL, Castle AM, Hubbard CH, Katsumata O, Castle JD. SCAMP3 negatively regulates epidermal growth factor receptor degradation and promotes receptor recycling. Mol Biol Cell. 2009;20:1816–1832. - PMC - PubMed
    1. Ashburner M, Ball CA, Blake JA, Botstein D, Butler H, Cherry JM, Davis AP, Dolinski K, Dwight SS, Eppig JT, et al. The Gene Ontology Consortium. Gene ontology: tool for the unification of biology. Nat. Genet. 2000;25:25–29. - PMC - PubMed
    1. Bernatchez PN, Acevedo L, Fernandez-Hernando C, Murata T, Chalouni C, Kim J, Erdjument-Bromage H, Shah V, Gratton J-P, McNally EM, et al. Myoferlin regulates vascular endothelial growth factor receptor-2 stability and function. J. Biol. Chem. 2007;282:30745–30753. - PubMed
    1. Bisson N, James DA, Ivosev G, Tate SA, Bonner R, Taylor L, Pawson T. Selected reaction monitoring mass spectrometry reveals the dynamics of signaling through the GRB2 adaptor. Nat. Biotechnol. 2011;29:653–658. - PubMed
    1. Brangwynne CP. Phase transitions and size scaling of membrane-less organelles. J. Cell Biol. 2013;203:875–881. - PMC - PubMed

Publication types