. 2017 Apr 6;20(4):505-517.e6.
doi: 10.1016/j.stem.2017.03.010.

Aberrant DNA Methylation in Human iPSCs Associates with MYC-Binding Motifs in a Clone-Specific Manner Independent of Genetics

Affiliations

Aberrant DNA Methylation in Human iPSCs Associates with MYC-Binding Motifs in a Clone-Specific Manner Independent of Genetics

Athanasia D Panopoulos et al. Cell Stem Cell. .

Abstract

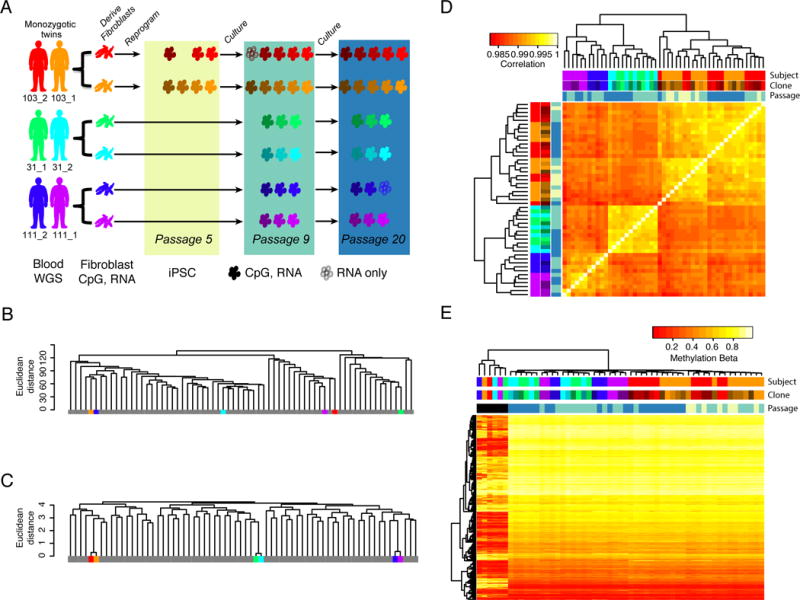
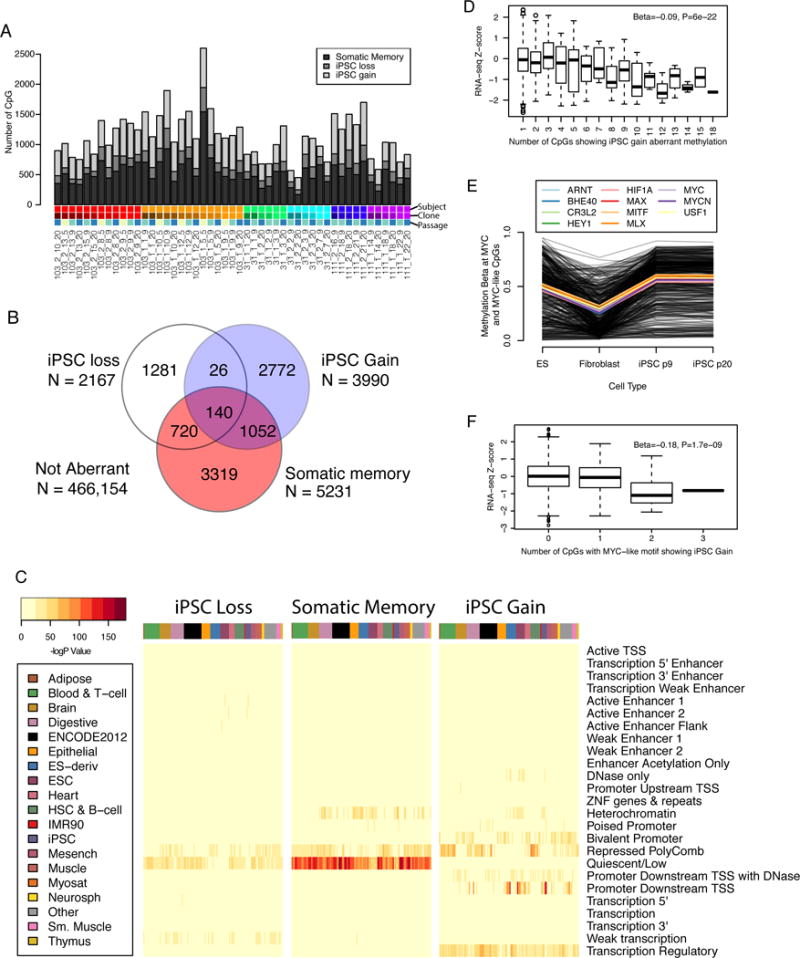
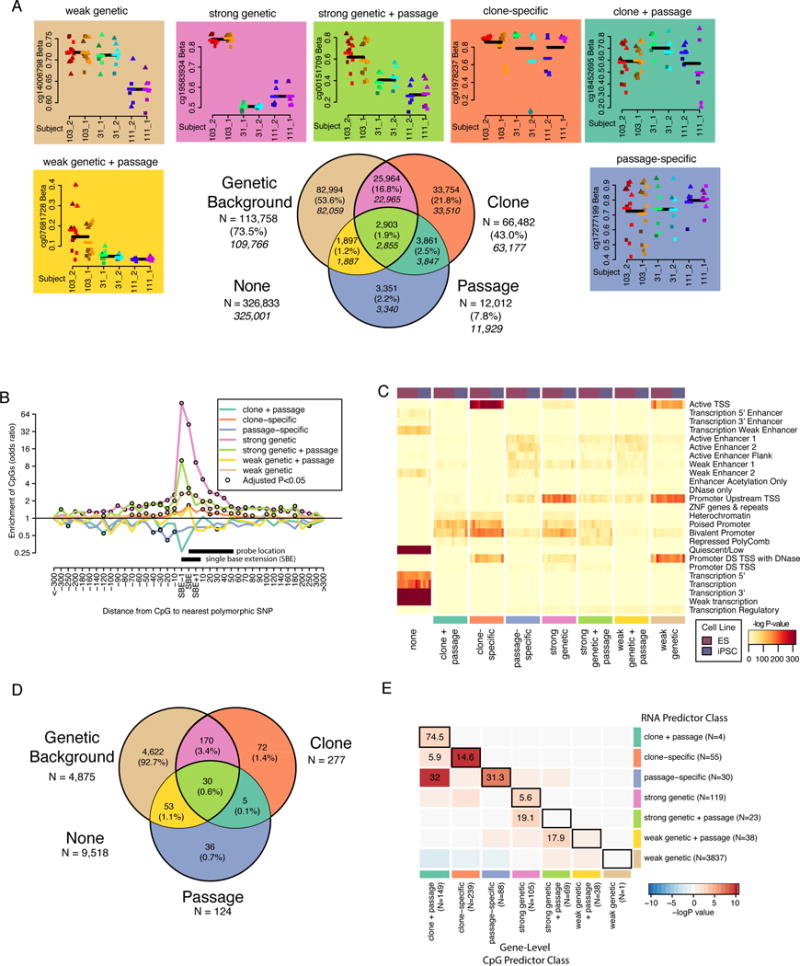
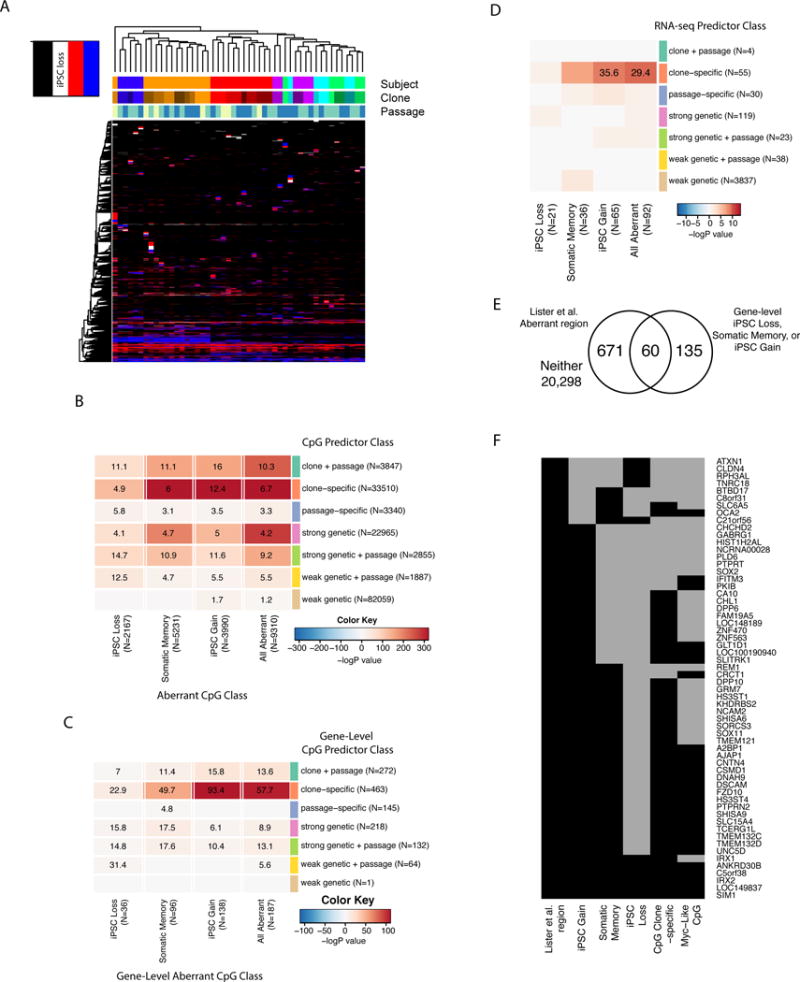
Induced pluripotent stem cells (iPSCs) show variable methylation patterns between lines, some of which reflect aberrant differences relative to embryonic stem cells (ESCs). To examine whether this aberrant methylation results from genetic variation or non-genetic mechanisms, we generated human iPSCs from monozygotic twins to investigate how genetic background, clone, and passage number contribute. We found that aberrantly methylated CpGs are enriched in regulatory regions associated with MYC protein motifs and affect gene expression. We classified differentially methylated CpGs as being associated with genetic and/or non-genetic factors (clone and passage), and we found that aberrant methylation preferentially occurs at CpGs associated with clone-specific effects. We further found that clone-specific effects play a strong role in recurrent aberrant methylation at specific CpG sites across different studies. Our results argue that a non-genetic biological mechanism underlies aberrant methylation in iPSCs and that it is likely based on a probabilistic process involving MYC that takes place during or shortly after reprogramming.

Keywords: MYC binding motifs; NHLBI NextGen; aberrant methylation; genetic background; iPSC; iPSCORE; induced pluripotent stem cells; methylation variation; reprogramming.


Figures

Figure 1
Figure 1. DNA methylation in iPSCs is associated with genetic background, clone and passage (see also Figure S1)
A) Study design indicating the fibroblast and iPSC samples derived from each subject in the three twin sets (103_2,103_1; 31_1,31_2; 111_2,111_1). iPSC clones are colored by shades of the subject’s color code and the colored rectangles depict indicated passages. Color codes are consistent throughout the paper. Blood samples were used for whole genome sequencing (WGS), while fibroblast and iPSC samples were used for DNA methylation (CpG) and RNA-seq (RNA) analyses. iPSCs indicated by filled cells have both methylation and RNA-seq data, while those indicated by outlines only have RNA-seq data. B) Dendrogram showing clustering of genome-wide methylation data of fibroblast samples from this study (color-coded) with data from 62 previously published fibroblast samples (grey) showing that fibroblasts do not cluster by genetic background. C) Dendrogram showing clustering at 65 SNPs present on the methylation arrays showing that twins cluster together based on genetic information. D) Hierarchical clustering and heat map of correlation of genome-wide methylation patterns of iPSC samples showing clustering by subject (genetic background), clone and passage (colored based on rectangle shades in 1A). E) Hierarchical clustering and heat map of methylation levels at 3,270 CpGs that have been shown to distinguish pluripotent and somatic cell types and also passed QC in our analysis. The fibroblasts (labeled black in passage annotation, six left most columns) randomly cluster whereas iPSC cluster by genetic background, clone and passage.
Figure 2
Figure 2. Aberrant DNA methylation in iPSCs (see also Tables S1A, S1B, S2, S3A, and Figure S2)
A) Barplot showing the number of aberrant methylation sites in each of the 49 samples, broken down into aberrant types. iPSC lines are color coded by subject, clone, and passage (Figure 1A). B) Venn diagram showing the classification of CpG sites aberrant in one or more samples. C) Heat maps showing enrichment −log P-value for hypergeometric association between ROADMAP regulatory regions (25 states) in 127 reference epigenomes and CpG sites associated with each aberrant classification. D) Boxplot showing the RNA-seq normalized expression values according to the number of aberrantly methylated iPSC gain CpGs annotated to the gene. Each data point that goes into the box plot corresponds to the expression value of a single gene in a single sample considering the number of neighboring aberrant CpGs. Beta and P-values derive from linear regression of raw data after including sample name as a covariate. E) Average methylation Beta values for CpGs that carry MYC or MYC-like motifs (identified as enriched in iPSC gain sites by CentriMo) and show iPSC gain. Each black line indicates an individual CpG and the colored lines indicate the average expression value for all CpGs associated with each motif type. F) Boxplot as in D, but restricted to the CpGs carrying the MYC and MYC-like motifs that showed at least 1 iPSC gain in 1 individual.
Figure 3
Figure 3. Methylation variation predictor classification has functional significance (see also Tables S1B, S2, S3B, S4, and Figure S3)
A) Venn diagram showing the overlap of CpG sites associated with genetic background, clone, and passage by ANOVA (FDR < 0.05). Percentages are of the total number of CpGs associated with one or more factor and the italicized numbers indicate the number of CpGs in each group after removal of SBE sites. Plots above and next to the Venn diagram show examples of CpGs that fall into each of the seven categories of the Venn diagram and are colored according to their classification. Within each plot, points are colored according to clone and shapes indicate passage (circle = P5, square = P9, triangle = P20). Black lines indicate the mean of all samples with the same genetic background and colored lines indicate mean of all samples from the same individual. B) Line plot showing odds ratios (OR) of the relationship between a CpG being associated with genetic background and harboring a polymorphic genetic variant at a given distance from the probe for each CpG predictor class from Figure 2A. CpGs are grouped according to distance from SBE site (e.g. −10 includes −2 to −10 and 10 includes +2 to +10). Open black circles indicate that the association was significant at FDR < 0.05. X-axis indicates distance from SBE site. Y-axis is on a log scale. Black bars indicate the position of the assay probe or bases considered to be SBE variants. C) Heat maps showing enrichment –log P-value for hypergeometric association between ROADMAP regulatory regions (25 states) in 8 ES and 5 iPSC reference epigenomes and CpG sites associated with each predictor classification. D) Venn diagram showing the number of genes associated with each RNA predictor class by ANOVA (FDR < 0.01). E) Heatmap showing OR’s for the overlap between gene-level CpG predictor class (columns) and RNA predictor class (rows). Black boxes surround comparisons where the same predictor classification group was compared between methylation and gene expression. Cells are colored according to −logP-value. Inf corresponds to “infinite” and reflects a positive association when an OR cannot be calculated due to a missing cell value.
Figure 4
Figure 4. Association of aberrant methylation with clone-specific effects (see also Tables S1A, S1B, and S3A, and Figure S4)
A) Heat map showing hierarchical clustering of 9,310 aberrant CpGs, cells are colored according to whether they are not aberrant (None), iPSC loss, somatic memory, or iPSC gain in each of the 49 samples. B) Heatmap showing odds ratios (ORs) from Fisher’s exact test of overlap between CpGs in aberrant CpG classes (columns) and those in CpG predictor classes. For CpG predictor classes, the reference is sites not associated with any category (the “None” category). For aberrant CpG classes, the reference is sites showing no aberrant methylation in any sample (the “Not Aberrant” category). Cells are colored according to −logP-value with positive values indicating over-enrichment and negative indicating under-enrichment. Cells with non-significant results (FDR > 0.05) do not have an OR reported. C) Heatmap showing ORs for the overlap between gene-level aberrant CpG classes and gene-level CpG predictor classes. Cells are colored according to −logP-value. D) OR’s for the overlap of genes enriched for aberrant classification (columns) and genes where the expression values from RNA-seq were associated with each predictor classification (rows). Cells are colored according to −logP-value. (E) Venn diagram showing the intersection of genes in aberrant regions in Lister et al. and genes aberrantly methylated in this study. F) List of 60 genes that show overlap in aberrant methylation between Lister et al. and this study. Genes are annotated by whether they showed gene-level aberrant methylation for iPSC gain, somatic memory, iPSC loss, or gene-level clone-specific enrichment. MYC-like CpG indicates the gene carried one or more iPSC gain CpGs associated with a MYC or MYC-like binding site. Cells are black if the variable is present (overlaps a Lister et al region; shows gene-level enrichment for iPSC gain, somatic memory, or iPSC loss; shows gene-level enrichment for the clone-specific CpG predictor class, or carries at least one CpG with a predicted Myc bindings site), and grey if absent.

References

    1. Bailey TL. DREME: motif discovery in transcription factor ChIP-seq data. Bioinformatics. 2011;27:1653–1659. - PMC - PubMed
    1. Bailey TL, Machanick P. Inferring direct DNA binding from ChIP-seq. Nucleic Acids Res. 2012;40:e128. - PMC - PubMed
    1. Bendix Carstensen MP, Laara Esa, Hills Michael. Epi: A Package for Statistical Analysis in Epidemiology. R package version 20 2016
    1. Benetatos L, Vartholomatos G, Hatzimichael E. DLK1-DIO3 imprinted cluster in induced pluripotency: landscape in the mist. Cell Mol Life Sci. 2014;71:4421–4430. - PMC - PubMed
    1. Benjamini Y, Hochberg Y. Controlling the False Discovery Rate: A Practical and Powerful Approach to Multiple Testing. Journal of the Royal Statistical Society Series B (Methodological) 1995;57:289–300.

Publication types

MeSH terms

Substances