. 2017 Apr 6;20(4):558-570.e10.
doi: 10.1016/j.stem.2017.03.017.

Large, Diverse Population Cohorts of hiPSCs and Derived Hepatocyte-like Cells Reveal Functional Genetic Variation at Blood Lipid-Associated Loci

Affiliations

Large, Diverse Population Cohorts of hiPSCs and Derived Hepatocyte-like Cells Reveal Functional Genetic Variation at Blood Lipid-Associated Loci

Evanthia E Pashos et al. Cell Stem Cell. .

Abstract

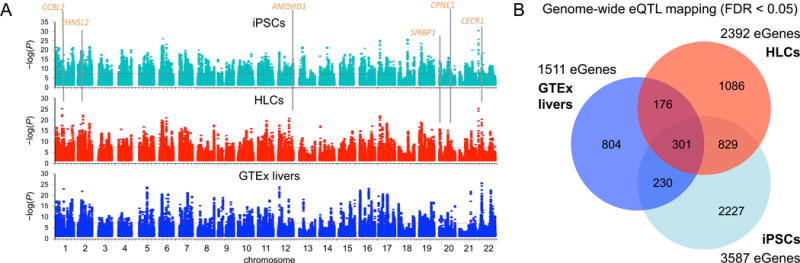
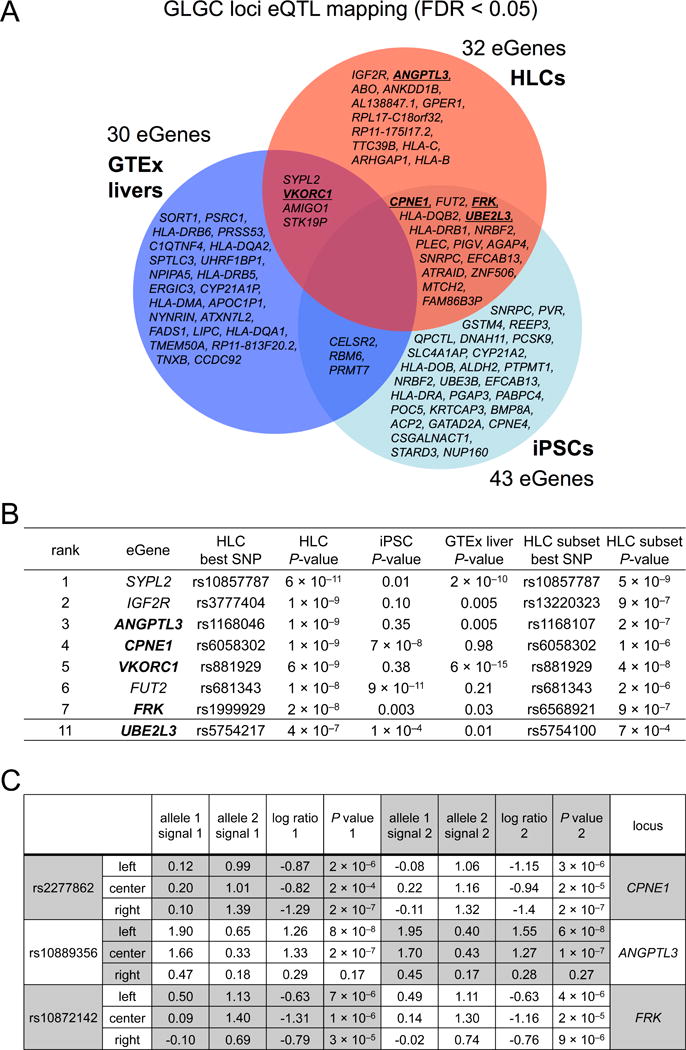
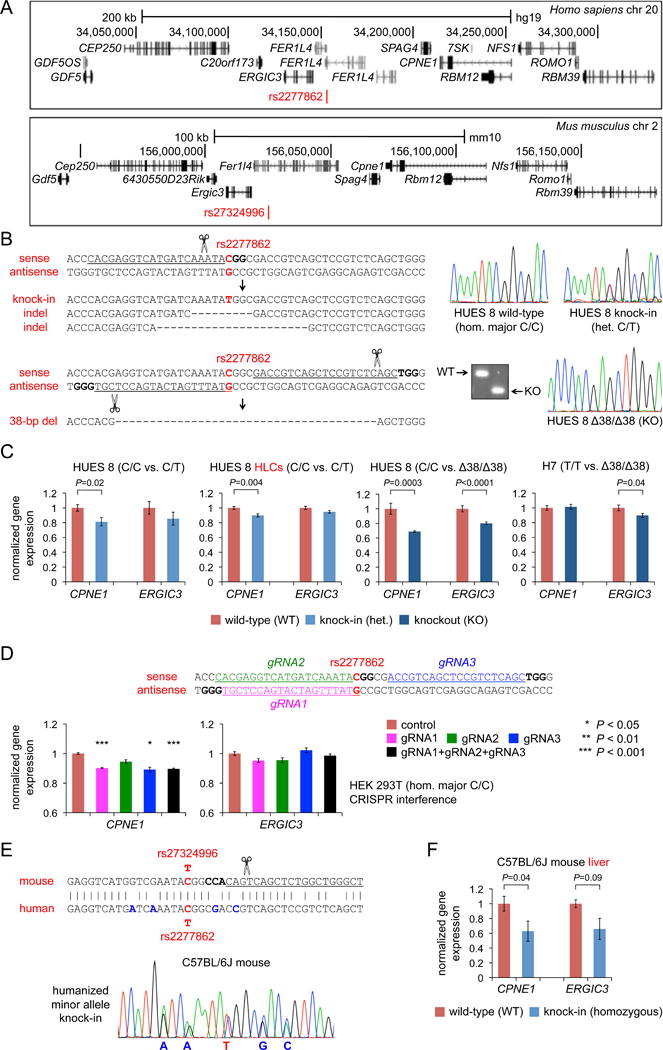
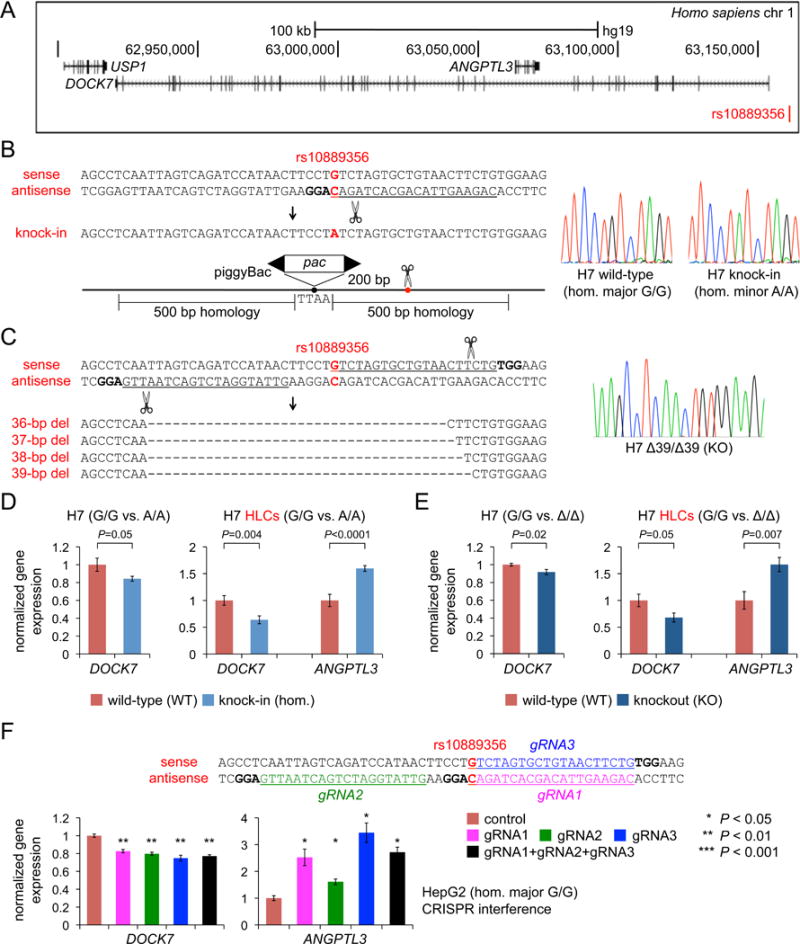
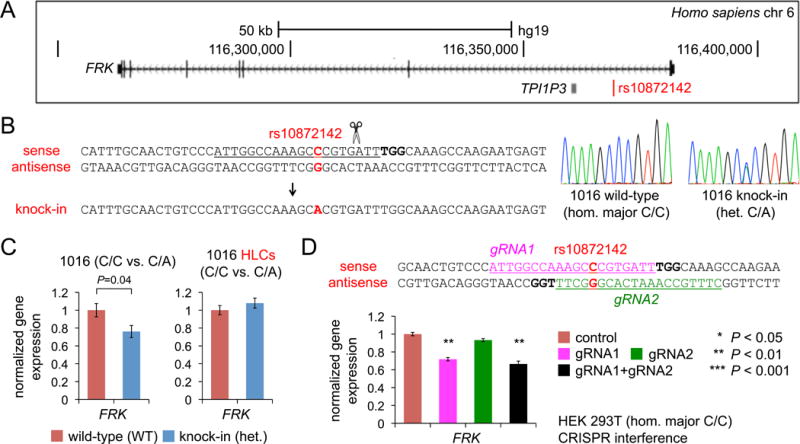
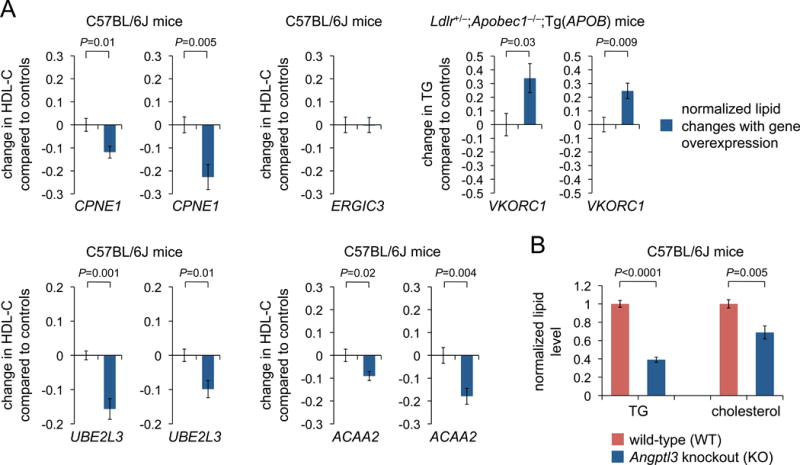
Genome-wide association studies have struggled to identify functional genes and variants underlying complex phenotypes. We recruited a multi-ethnic cohort of healthy volunteers (n = 91) and used their tissue to generate induced pluripotent stem cells (iPSCs) and hepatocyte-like cells (HLCs) for genome-wide mapping of expression quantitative trait loci (eQTLs) and allele-specific expression (ASE). We identified many eQTL genes (eGenes) not observed in the comparably sized Genotype-Tissue Expression project's human liver cohort (n = 96). Focusing on blood lipid-associated loci, we performed massively parallel reporter assays to screen candidate functional variants and used genome-edited stem cells, CRISPR interference, and mouse modeling to establish rs2277862-CPNE1, rs10889356-DOCK7, rs10889356-ANGPTL3, and rs10872142-FRK as functional SNP-gene sets. We demonstrated HLC eGenes CPNE1, VKORC1, UBE2L3, and ANGPTL3 and HLC ASE gene ACAA2 to be lipid-functional genes in mouse models. These findings endorse an iPSC-based experimental framework to discover functional variants and genes contributing to complex human traits.

Keywords: CRISPR; Cas9; expression quantitative trait loci; genetics; genome-wide association studies; genomics; induced pluripotent stem cells.


Figures

Figure 1
Figure 1. Genome-wide Mapping of Expression Quantitative Trait Loci (eQTLs)
(A) Overview of the single-tissue cis-eQTL mapping results. Representative HLC eGenes are indicated. (B) Venn diagram of mapped eGenes with a stringent cutoff of FDR < 5%. See also Figures S1, S2, and S3.
Figure 2
Figure 2. HLC eGenes and Candidate Functional Variants from MPRAs
(A) Venn diagram of mapped eGenes at GLGC loci with a stringent cutoff of FDR < 5% (also see Table S7). In bold and underlined are eGenes for which functional studies were performed. (B) Top-ranked GLGC HLC eGenes. The displayed SNP in the third column is the GWAS SNP (or one of a set of GWAS SNPs in perfect LD in the cohort) in the locus that displayed the strongest association with the eGene. The displayed SNP in the seventh column is the GWAS SNP in the locus that displayed the strongest association in a sensitivity analysis with 63 higher-quality HLC samples. In bold are eGenes for which functional studies were performed. (C) MPRAs identified rs2277862, rs10889356, and rs10872142 as the SNPs with the greatest allele-specific regulatory activity in the CPNE1, ANGPTL3, and FRK loci, respectively (also see Table S9). Each candidate SNP was represented on a 145-bp tile that was either left-shifted, centered, or right-shifted relative to the SNP, in order to increase the probability of capturing the correct regulatory context for that SNP. For each tile, the individual signals for the two alleles are shown for two independent experiments (where signal refers to the log of median barcode counts for the given tile divided by median barcode counts for all tiles). In the final two columns, a log-ratio of the signals of the two alleles is calculated, along with a P-value (Mann-Whitney U test) for the null hypothesis that the two alleles generate equal signals.
Figure 3
Figure 3. Evidence for rs2277862-CPNE1 as a Functional SNP-Gene Set
(A) Schematics of human chromosome 20q11 locus showing the relative positions of rs2277862, CPNE1, and ERGIC3 and mouse chromosome 2qH1 locus showing the relative positions of rs27324996, Cpne1, and Ergic3. (B) Top panels: heterozygous knock-in of rs2277862 minor allele with a single-strand DNA oligonucleotide. Representative indels in non-knock-in clones are also shown. Bottom panels: homozygous 38-bp deletions (“knockout” or Δ38/Δ38) encompassing rs2277862 using a dual gRNA approach. A representative agarose gel of PCR amplicons is shown. The protospacers are underlined, the PAMs are bolded, and the SNP position is indicated in red. (C) Left panels: gene expression in undifferentiated HUES 8 cells (n = 2 wild-type clones and 1 knock-in clone; 6 wells per clone) and differentiated HUES 8 HLCs (n = 2 wild-type clones and 1 knock-in clone; 6 wells per clone) normalized to mean expression level in wild-type clones. Right panels: gene expression in undifferentiated HUES 8 cells (n = 10 wild-type and 10 knockout clones, 3 wells per clone) and undifferentiated H7 cells (n = 8 wild-type and 6 knockout clones, 3 wells per clone) normalized to mean expression level in wild-type clones. (D) CRISPR interference at the rs2277862 site. The three gRNA protospacers are underlined, the PAMs are bolded, and the SNP position is indicated in red. The graphs show gene expression, normalized to mean expression level in control cells, in HEK 293T cells transfected with catalytically dead Cas9 (dCas9) with the gRNAs (either singly or in combination, 3 wells per condition). Control cells were transfected with dCas9 without an accompanying gRNA. (E) The noncoding rs2277862 site is well conserved in mouse, including allelic variants of the SNP itself, with the murine equivalent being rs27324996. The SNP position is indicated in red, non-conserved nucleotides are indicated in blue, the gRNA protospacer used to generate the knock-in mouse is underlined, and the PAM is bolded. The electropherogram is from a mouse in which the minor allele of rs2277862/rs27324996 (T) has been knocked into one chromosome, along with four non-conserved nucleotides to “humanize” the site. (F) Gene expression in liver from littermates of the C57BL/6J background (n = 18 wild-type mice and 10 homozygous knock-in mice), normalized to mean expression level in wild-type mice. Data are displayed as means and s.e.m. P-values were calculated with two-tailed Welch’s t-tests.
Figure 4
Figure 4. Evidence for rs10889356-DOCK7 and rs10889356-ANGPTL3 as Functional SNP-Gene Sets
(A) Schematic of human chromosome 1p31 locus showing the relative positions of rs10889356, DOCK7, and ANGPTL3. (B) Homozygous knock-in of rs10889356 minor allele using a targeting vector with puromycin resistance encoded within a scarless-excision piggyBac transposon. The protospacer is underlined, the PAM is bolded, and the SNP position is indicated in red. (C) Homozygous 36- to 39-bp deletions (“knockout” or Δ/Δ) encompassing rs10889356 using a dual gRNA approach. The protospacer is underlined, the PAM is bolded, and the SNP position is indicated in red. (D) Gene expression in undifferentiated H7 cells (n = 12 wild-type and 10 homozygous knock-in clones, 6 wells per clone) and differentiated H7 HLCs (n = 6 wild-type and 4 homozygous knock-in, 3 wells per clone), normalized to mean expression level in wild-type clones. (E) Gene expression in undifferentiated H7 cells (n = 12 wild-type and 8 knockout clones, 3 wells per clone) and differentiated H7 HLCs (n = 4 wild-type and 4 knockout clones, 2 wells per clone). (F) CRISPR interference at the rs10889356 site. The three gRNA protospacers are underlined, the PAMs are bolded, and the SNP position is indicated in red. The graphs show gene expression, normalized to mean expression level in control cells, in HepG2 cells transfected with dCas9 with the gRNAs (either singly or in combination, 3 wells per condition). Data are displayed as means and s.e.m. P-values were calculated with two-tailed Welch’s t-tests.
Figure 5
Figure 5. Evidence for rs10872142-FRK as a Functional SNP-Gene Set
(A) Schematic of human chromosome 6q22 locus showing the relative positions of rs10872142 and FRK. (B) Heterozygous knock-in of rs10872142 minor allele with a single-strand DNA oligonucleotide. The protospacer is underlined, the PAM is bolded, and the SNP position is indicated in red. (C) Gene expression in undifferentiated 1016 cells (n = 3 wild-type and 3 heterozygous clones, 3 wells per clone) and differentiated 1016 HLCs (n = 3 wild-type and 3 heterozygous clones, 4 wells per clone), normalized to mean expression level in wild-type clones. (D) CRISPR interference at the rs10872142 site. The two gRNA protospacers are underlined, the PAMs are bolded, and the SNP position is indicated in red. The graphs show gene expression, normalized to mean expression level in control cells, in HEK 293T cells transfected with dCas9 with the gRNAs (either singly or in combination, 6 wells per condition). Data are displayed as means and s.e.m. P-values were calculated with two-tailed Welch’s t-tests.
Figure 6
Figure 6. Interrogation of candidate genes for effects on blood lipid levels in mice
(A) Proportional changes in blood TG or HDL-C levels before versus after AAV8-mediated gene overexpression in liver, normalized to mice that received control AAV8 vectors (n = 7 mice per group). Two independent experiments are shown for each gene except ERGIC3. (B) Blood triglyceride and cholesterol levels in wild-type versus Angptl3 knockout mice (n = 17 wild-type and 6 knockout mice), normalized to mean expression levels in wild-type mice. Data are displayed as means and s.e.m. P-values were calculated with two-tailed Welch’s t-tests.

References

    1. Andrews S. FastQC: a quality control tool for high throughput sequence data. 2010 Available online at: http://www.bioinformatics.babraham.ac.uk/projects/fastqc.
    1. Aguet F, Brown AA, Castel S, Davis JR, Mohammadi P, Segre AV, Zappala Z, Abell NS, Fresard L, Gamazon ER, et al. Local genetic effects on gene expression across 44 human tissues. bioRxiv. 2016 doi: https://doi.org/10.1101/074450. - DOI
    1. Bass AJ, Storey JD, Dabney A, Robinson D. qvalue: Q-value estimation for false discovery rate control. 2015 Available online at: http://github.com/jdstorey/qvalue.
    1. Benjamini Y, Hochberg Y. Controlling the false discovery rate: a practical and powerful approach to multiple testing. J R Stat Soc Series B Stat Methodol. 1995;57:289–300.
    1. Burkhardt R, Toh SA, Lagor WR, Birkeland A, Levin M, Li X, Robblee M, Fedorov VD, Yamamoto M, Satoh T, et al. Trib1 is a lipid- and myocardial infarction-associated gene that regulates hepatic lipogenesis and VLDL production in mice. J Clin Invest. 2010;120:4410–4414. - PMC - PubMed

Publication types

MeSH terms

LinkOut - more resources