. 2017 Apr 7;13(4):e1005481.
doi: 10.1371/journal.pcbi.1005481. eCollection 2017 Apr.

Dose-response relationships for environmentally mediated infectious disease transmission models

Affiliations

Dose-response relationships for environmentally mediated infectious disease transmission models

Andrew F Brouwer et al. PLoS Comput Biol. .

Erratum in

Abstract

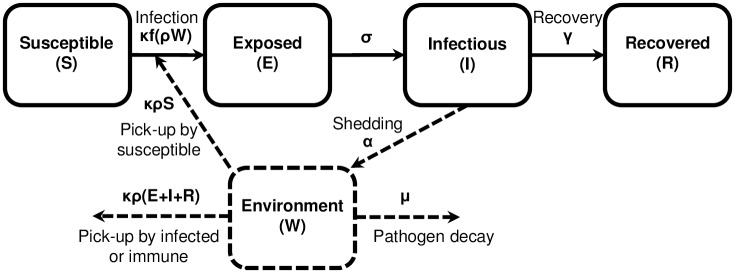
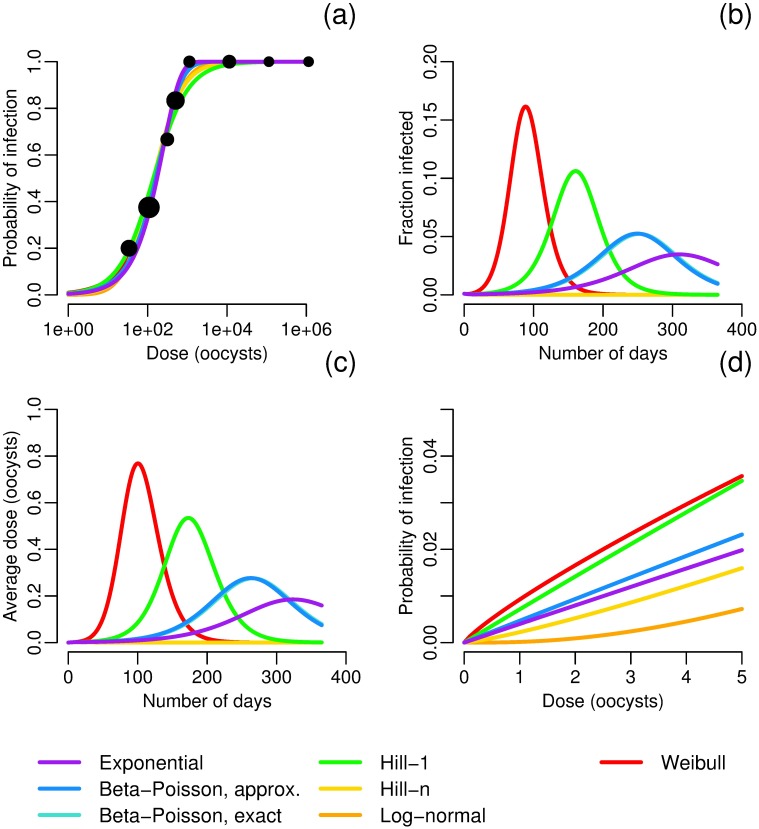
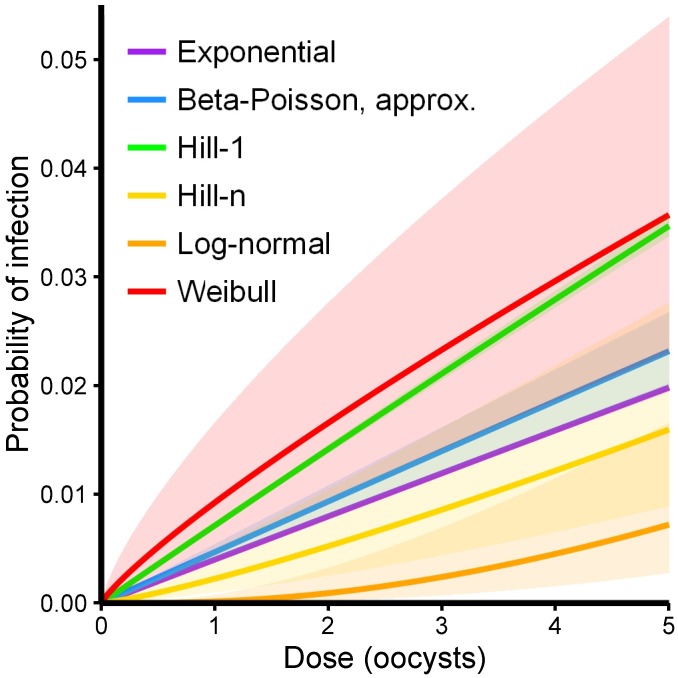
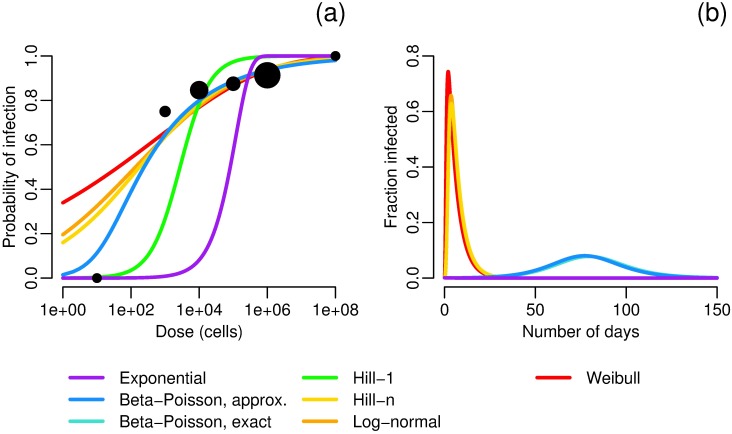
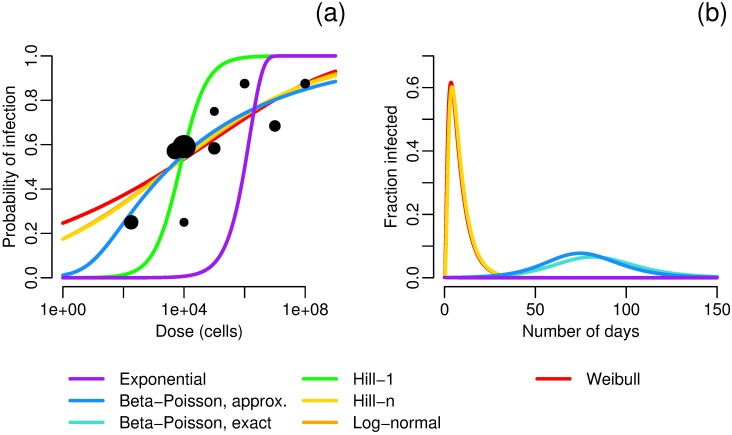
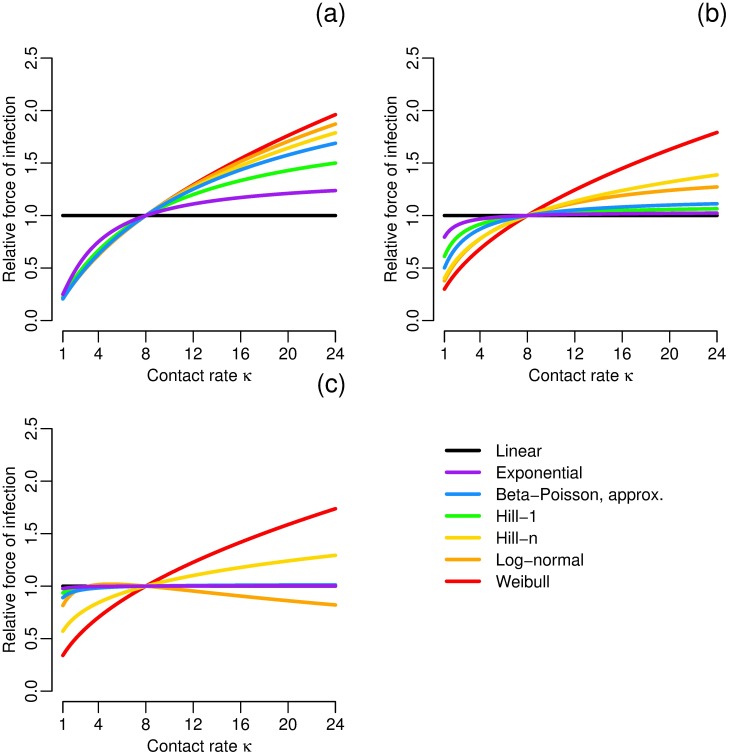
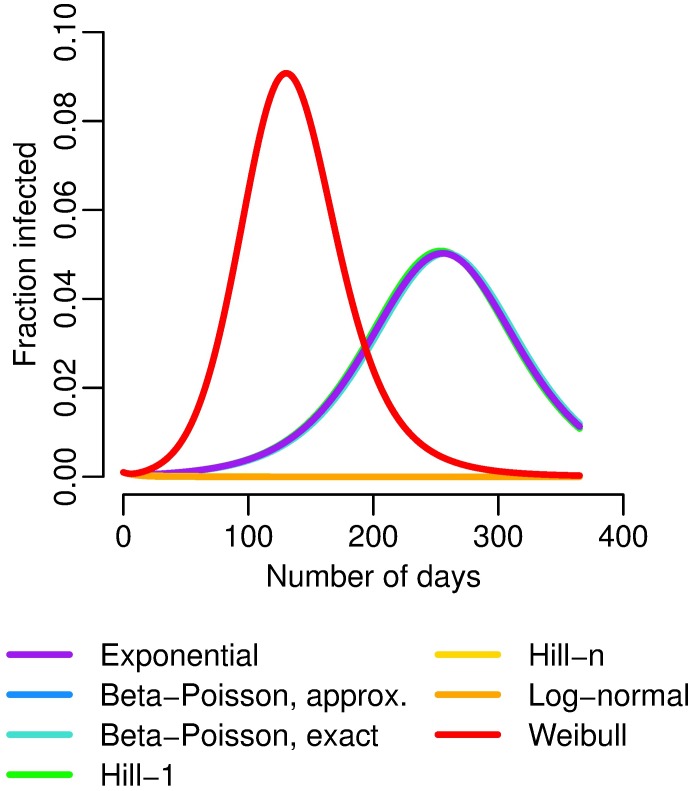
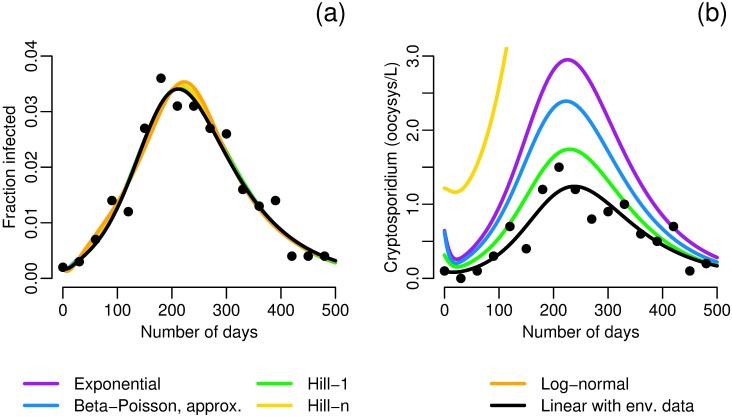
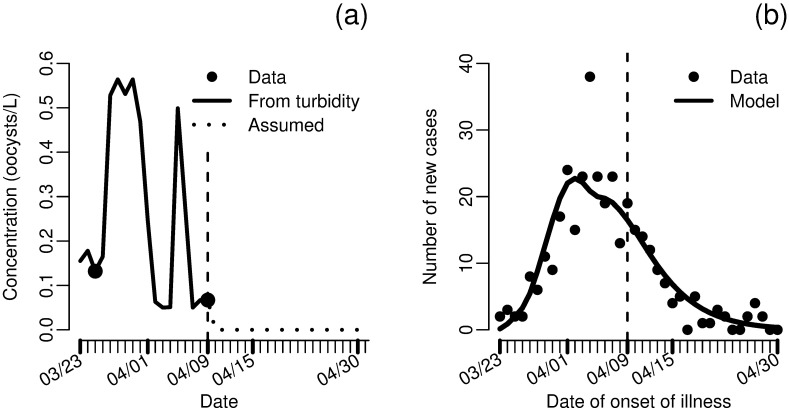
Environmentally mediated infectious disease transmission models provide a mechanistic approach to examining environmental interventions for outbreaks, such as water treatment or surface decontamination. The shift from the classical SIR framework to one incorporating the environment requires codifying the relationship between exposure to environmental pathogens and infection, i.e. the dose-response relationship. Much of the work characterizing the functional forms of dose-response relationships has used statistical fit to experimental data. However, there has been little research examining the consequences of the choice of functional form in the context of transmission dynamics. To this end, we identify four properties of dose-response functions that should be considered when selecting a functional form: low-dose linearity, scalability, concavity, and whether it is a single-hit model. We find that i) middle- and high-dose data do not constrain the low-dose response, and different dose-response forms that are equally plausible given the data can lead to significant differences in simulated outbreak dynamics; ii) the choice of how to aggregate continuous exposure into discrete doses can impact the modeled force of infection; iii) low-dose linear, concave functions allow the basic reproduction number to control global dynamics; and iv) identifiability analysis offers a way to manage multiple sources of uncertainty and leverage environmental monitoring to make inference about infectivity. By applying an environmentally mediated infectious disease model to the 1993 Milwaukee Cryptosporidium outbreak, we demonstrate that environmental monitoring allows for inference regarding the infectivity of the pathogen and thus improves our ability to identify outbreak characteristics such as pathogen strain.


Conflict of interest statement

The authors have declared that no competing interests exist.

Figures

Fig 1
Fig 1. Schematic of an environmentally mediated infectious disease transmission model with dose–response and exposed compartment.
Solid lines represent people and dashed lines represent pathogens. Variables and parameters are defined in Table 2.
Fig 2
Fig 2. Cryptosporidium dose–response and dynamics.
a) Maximum-likelihood estimates of dose–response functions for Cryptosporidium. Data from [45]; sizes of data points correspond to sample size. Best-fit parameters are given in Table 3. b) Modeled fraction of infected people under different dose–response relationships. Model parameters are N = 1000, S0 = 999, I0 = 1, W0 = 0, σ = 1/7 [46], γ = 1/10 [46], κ = 8 and ρ = 0.15 so that κρ = 1.2 L [47], V = 4E8 L, α = 1E6/V (taken from a range [48]), μ = 0.069 (taken from a range [49]). Model results using the exact and approximate beta–Poisson functions lie nearly on top of each other, and those using the Hill-n and log-normal functions have no outbreak. c) Average pathogen dose over time for different dose–response relationships. Model parameters are as in Fig 2b. d) Low dose behavior of the dose–response functions given in Fig 2a. Confidence intervals are given in Fig 3.
Fig 3
Fig 3. Low-dose regime of the Cryptosporidium dose–response functions (see Fig 2d) with 95% confidence intervals determined by likelihood-based confidence regions for the underlying parameters.
Fig 4
Fig 4. Vibrio cholerae dose–response and dynamics.
a) Maximum-likelihood estimates of dose–response functions for buffered Inaba strain of Vibrio cholerae. Buffering was used in this experiment to approximate eating contaminated food, as food buffers stomach acid; because Vibrio cholerae does not tolerate gastric acidity, a buffered strain is more infectious. Data from [50]; sizes of data points correspond to sample size. Best-fit parameters are given in Table 3. b) Modeled fraction of infected people under different Vibrio cholerae dose–response relationships. Model parameters are N = 1000, S0 = 999, I0 = 1, W0 = 0, σ = 5/2 [51], γ = 1/5 [9], κ = 8 and ρ = 0.15 so that κρ = 1.2 L [47], V = 4E8, α = 2E6/V, μ = 0.23 [9]. Model results using the exact and approximate beta–Poisson functions lie nearly on top of each other, and those using the Hill-1 and exponential functions have no outbreak.
Fig 5
Fig 5. Shigella flexneri dose–response and dynamics.
a) Maximum-likelihood estimates of dose–response functions for Shigella flexneri. Data from [52, 53]; sizes of data points correspond to sample size. Best-fit parameters are given in Table 3. b) Modeled fraction of infected people under different Shigella flexneri dose–response relationships. Model parameters are N = 1000, S0 = 999, I0 = 1, W0 = 0, σ = 2/3 [54], γ = 1/6 [54], κ = 8 and ρ = 0.15 so that κρ = 1.2 L [47], V = 4E8, α = 4E7/V, μ = 5 [55, 56]. Model results using the Weibull, log-normal, and Hill-n functions lie nearly on top of each other, and those using the Hill-1 and exponential functions have no outbreak.
Fig 6
Fig 6. Force of infection changes with dose aggregation.
Force of infection κf(ρW) relative to that when the contact rate is κ = 8 for constant daily dose κρE, i.e. κf(ρW)/(8f(κρW/8)), for each dose–response model parameterized to have an ID50 of 1E6 (comparable to influenza) at a) high, b) medium, and c) low total doses. Any parameters not constrained by the median dose were chosen from the best-fit influenza parameters (see S1 Appendix).
Fig 7
Fig 7. Cryptosporidium dose–response and dynamics with the fixed stochastic R0.
Modeled number of infected people under different dose–response relationships, where α is adjusted so that R0*=2 for each simulation. The exponential, exact and approximate beta–Poisson, and Hill-1 functions lie nearly on top of each other, and the Hill-n and lognormal functions have no outbreak.
Fig 8
Fig 8. Simulated data and model fits for an outbreak of Cryptosporidium.
In both plots the colored lines are model fits for environmentally mediated infectious disease transmission models with dose–response relationships (Eq (3)), fit only to case data, that use the indicated dose–response function. The black line is the environmentally mediated infectious disease transmission model with linear infectivity (Eq (4)), fit to both case and environmental data. a) Case data and model fits. b) Environmental data and model fits (assuming κ = 8, and ρ = 0.15 [47] in order to estimate W in those models that do not observe the environmental data). The environmental estimate of the log-normal model, with an initial condition of 8.4 oocysts/L, is outside of the scale of the plot. Additional simulation details are given in S1 Appendix.
Fig 9
Fig 9. Data and model fits for the 1993 Milwaukee cryptosporidosis outbreak.
a) Concentration of Cryprosporidium in treated water from data and estimated from turbidity. b) Fit of the environmentally mediated infectious disease model (forced by estimated Cryptosporidium concentration and incorporating two exposed compartments) to incidence of new cases of diarrhea. Parameters πκρ = 0.0507 and σ = 0.134 were estimated in the model fit. Additional simulation details are given in S1 Appendix.

References

    1. Codeço CT. Endemic and epidemic dynamics of cholera: the role of the aquatic reservoir. BMC Infectious Diseases. 2001;1:1 10.1186/1471-2334-1-1 - DOI - PMC - PubMed
    1. Capasso V, Paveri-Fontana SL. A mathematical model for the 1973 cholera epidemic in the European Mediterranean region. Revue d’épidémiologie et de santé publique. 1979;27(2):121–32. - PubMed
    1. Hartley DM, Morris JG, Smith DL. Hyperinfectivity: A critical element in the ability of V. cholerae to cause epidemics? PLOS Medicine. 2006;3(1):63–69. - PMC - PubMed
    1. Bertuzzo E, Azaele S, Maritan A, Gatto M, Rodriguez-Iturbe I, Rinaldo A. On the space-time evolution of a cholera epidemic. Water Resources Research. 2008;44(1):1–8. 10.1029/2007WR006211 - DOI
    1. Bertuzzo E, Casagrandi R, Gatto M, Rodriguez-Iturbe I, Rinaldo A. On spatially explicit models of cholera epidemics. Journal of the Royal Society Interface. 2010;7(43):321–333. 10.1098/rsif.2009.0204 - DOI - PMC - PubMed

Publication types

LinkOut - more resources