

Hospitalizations for heat-stress illness varies between rural and urban areas: an analysis of Illinois data, 1987-2014
- PMID: 28388909
- PMCID: PMC5384150
- DOI: 10.1186/s12940-017-0245-1
Hospitalizations for heat-stress illness varies between rural and urban areas: an analysis of Illinois data, 1987-2014
Abstract
Background: The disease burden due to heat-stress illness (HSI), which can result in significant morbidity and mortality, is expected to increase as the climate continues to warm. In the United States (U.S.) much of what is known about HSI epidemiology is from analyses of urban heat waves. There is limited research addressing whether HSI hospitalization risk varies between urban and rural areas, nor is much known about additional diagnoses of patients hospitalized for HSI.
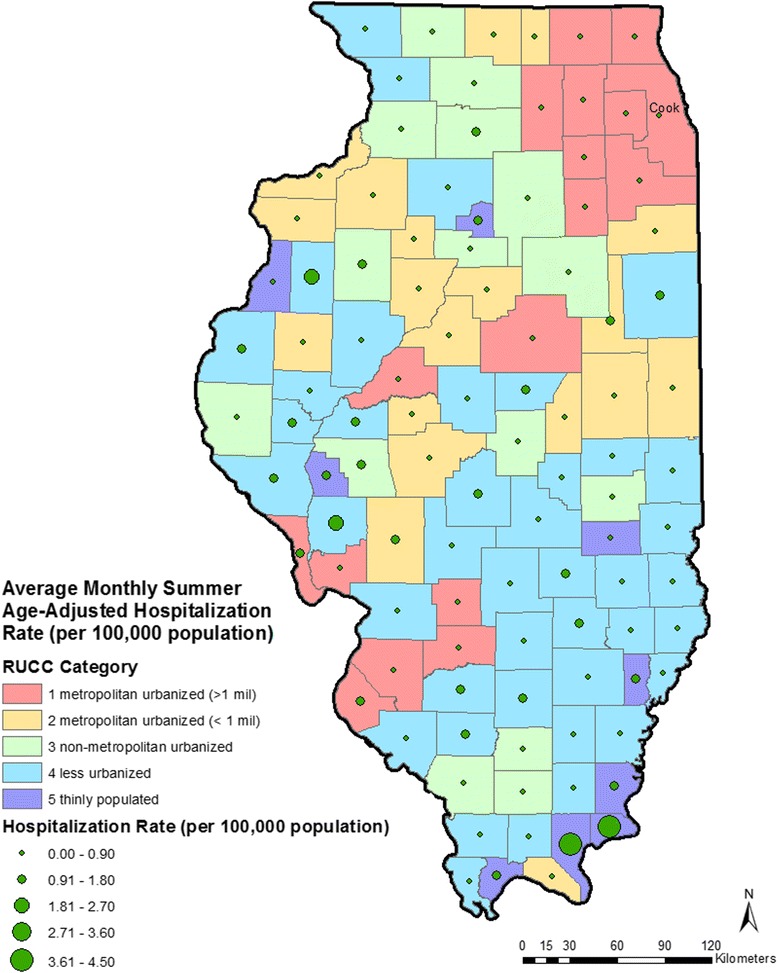
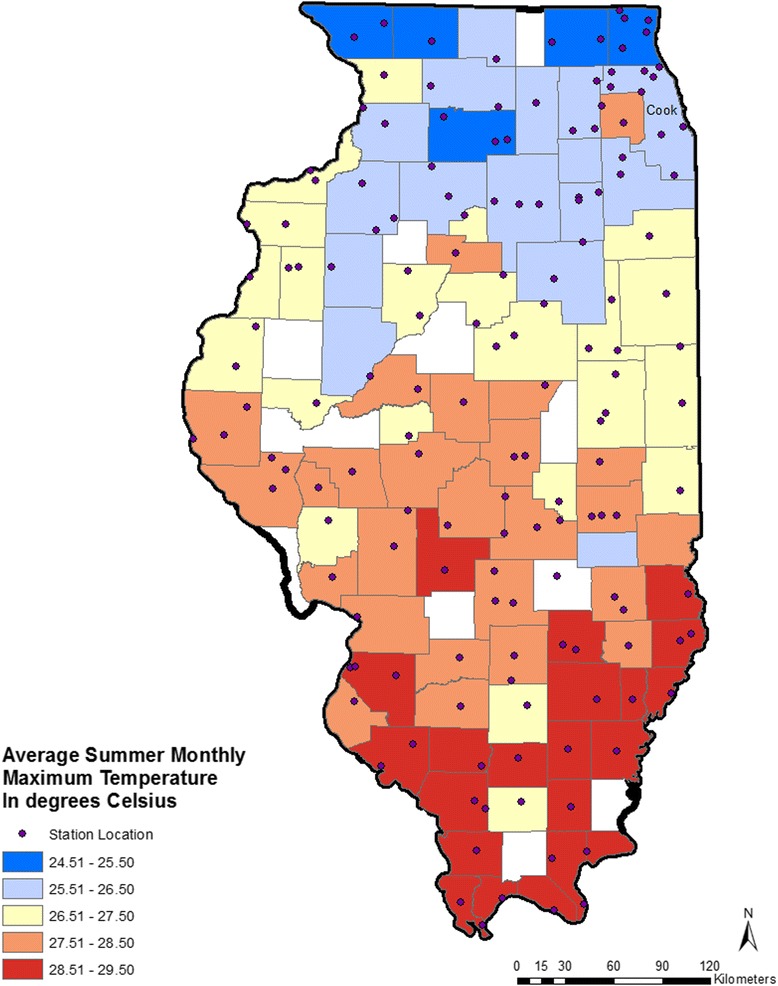
Methods: Hospitalizations in Illinois for HSI (ICD-9-CM codes 992.x or E900) in the months of May through September from 1987 to 2014 (n = 8667) were examined. Age-adjusted mean monthly hospitalization rates were calculated for each county using U.S. Census population data. Counties were categorized into five urban-rural strata using Rural Urban Continuum Codes (RUCC) (RUCC1, most urbanized to RUCC5, thinly populated). Average maximum monthly temperature (°C) was calculated for each county using daily data. Multi-level linear regression models were used, with county as the fixed effect and temperature as random effect, to model monthly hospitalization rates, adjusting for the percent of county population below the poverty line, percent of population that is Non-Hispanic Black, and percent of the population that is Hispanic. All analyses were stratified by county RUCC. Additional diagnoses of patients hospitalized for HSI and charges for hospitalization were summarized.
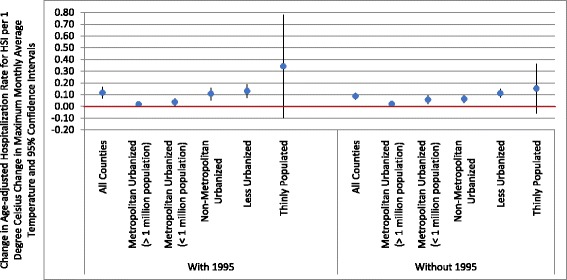
Results: Highest rates of HSI hospitalizations were seen in the most rural, thinly populated stratum (mean annual summer hospitalization rate of 1.16 hospitalizations per 100,000 population in the thinly populated strata vs. 0.45 per 100,000 in the metropolitan urban strata). A one-degree Celsius increase in maximum monthly average temperature was associated with a 0.34 increase in HSI hospitalization rate per 100,000 population in the thinly populated counties compared with 0.02 per 100,000 in highly urbanized counties. The most common additional diagnoses of patients hospitalized with HSI were dehydration, electrolyte abnormalities, and acute renal disorders. Total and mean hospital charges for HSI cases were $167.7 million and $20,500 (in 2014 US dollars).
Conclusion: Elevated temperatures appear to have different impacts on HSI hospitalization rates as function of urbanization. The most rural and the most urbanized counties of Illinois had the largest increases in monthly hospitalization rates for HSI per unit increase in the average monthly maximum temperature. This suggests that vulnerability of communities to heat is complex and strategies to reduce HSI may need to be tailored to the degree of urbanization of a county.
Keywords: Climate change; Heat stress illness; Temperature; Temperature-heat stress illness relationship; Urban-rural differences.
Figures
References
-
- Heat wave: a major summer killer. http://www.nws.noaa.gov/os/brochures/heat_wave.shtml. Accessed 16 Jan 2016.
Publication types
MeSH terms
Grants and funding
LinkOut - more resources
Full Text Sources
Other Literature Sources
Medical
