. 2017 May 15;425(2):208-222.
doi: 10.1016/j.ydbio.2017.03.032. Epub 2017 Apr 4.

Brachyury drives formation of a distinct vascular branchpoint critical for fetal-placental arterial union in the mouse gastrula

Affiliations

Brachyury drives formation of a distinct vascular branchpoint critical for fetal-placental arterial union in the mouse gastrula

Adriana M Rodriguez et al. Dev Biol. .

Abstract

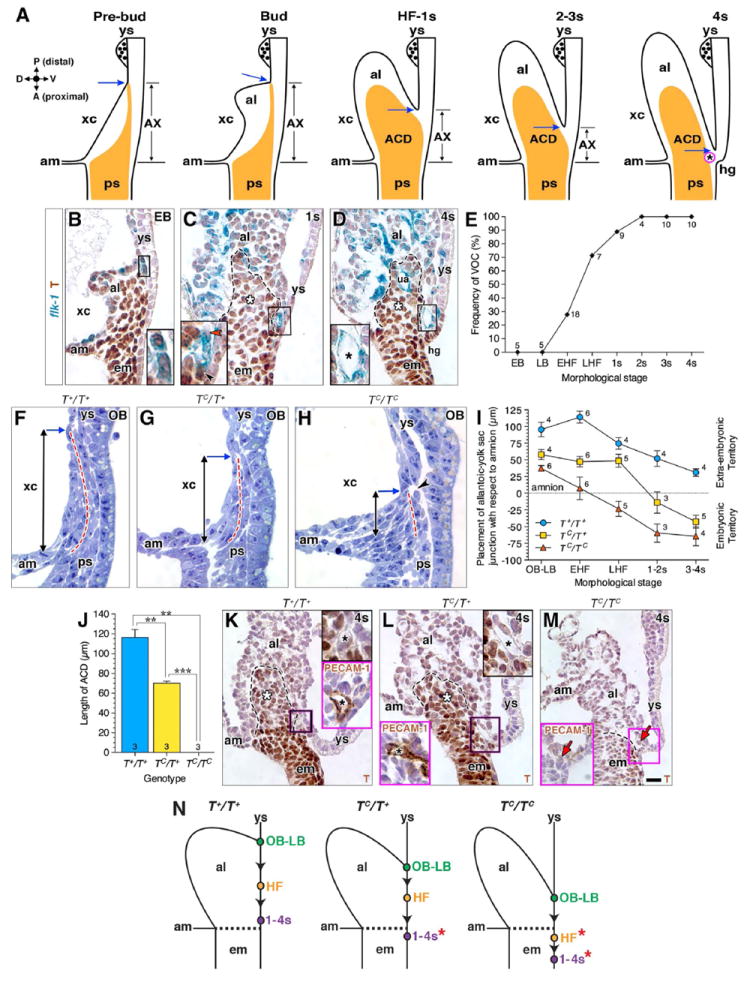
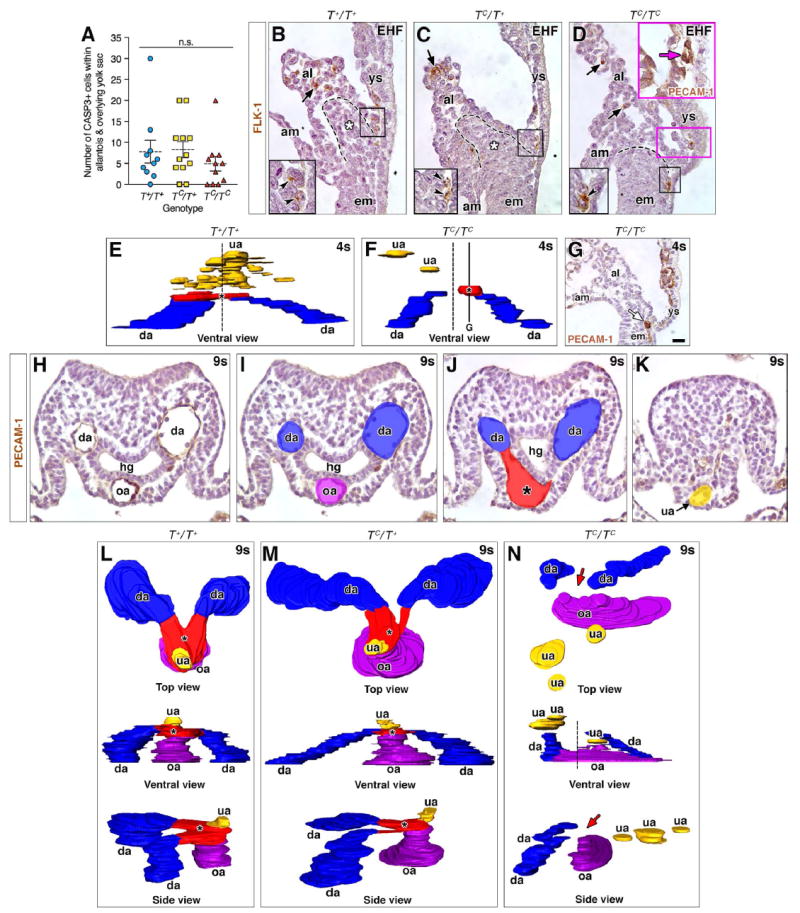
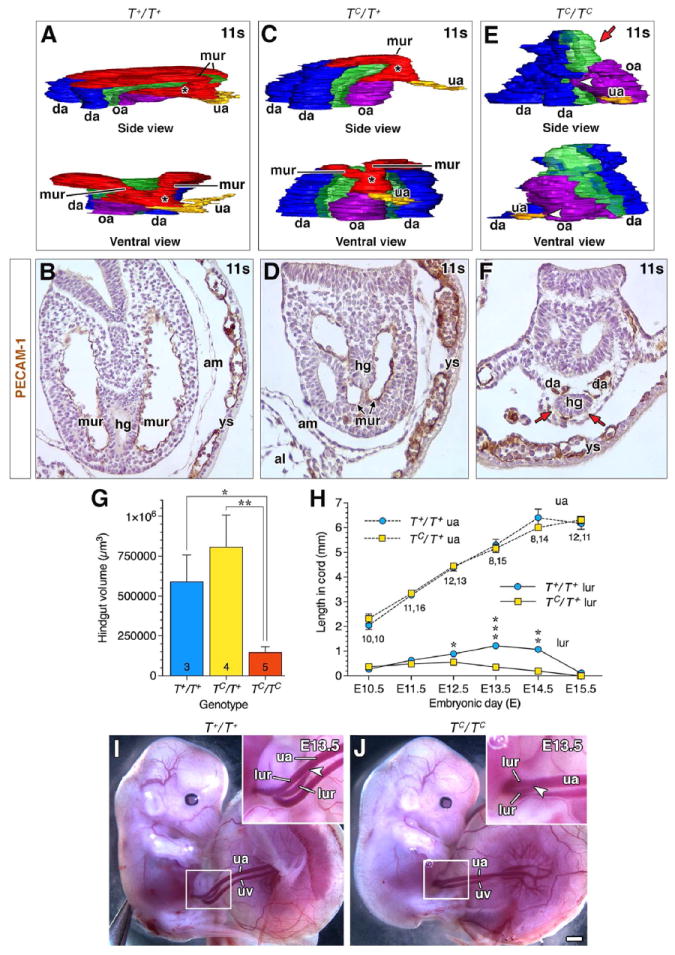
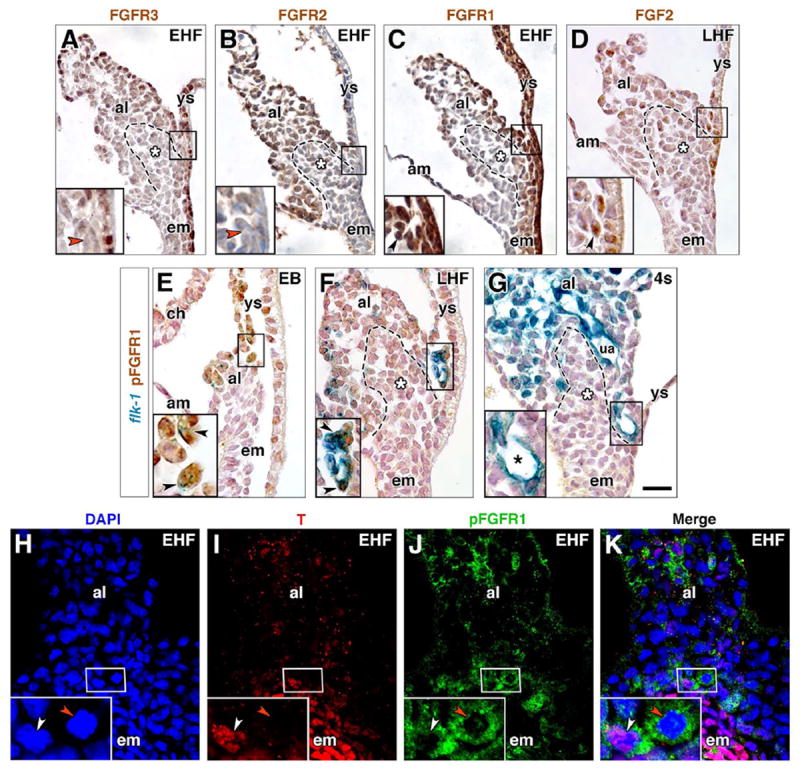
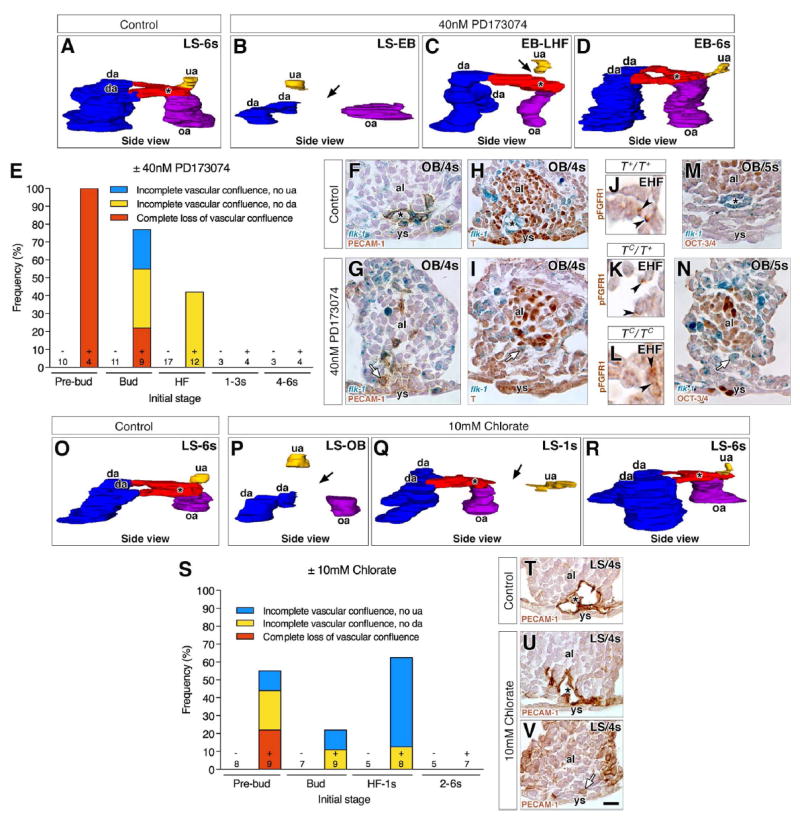
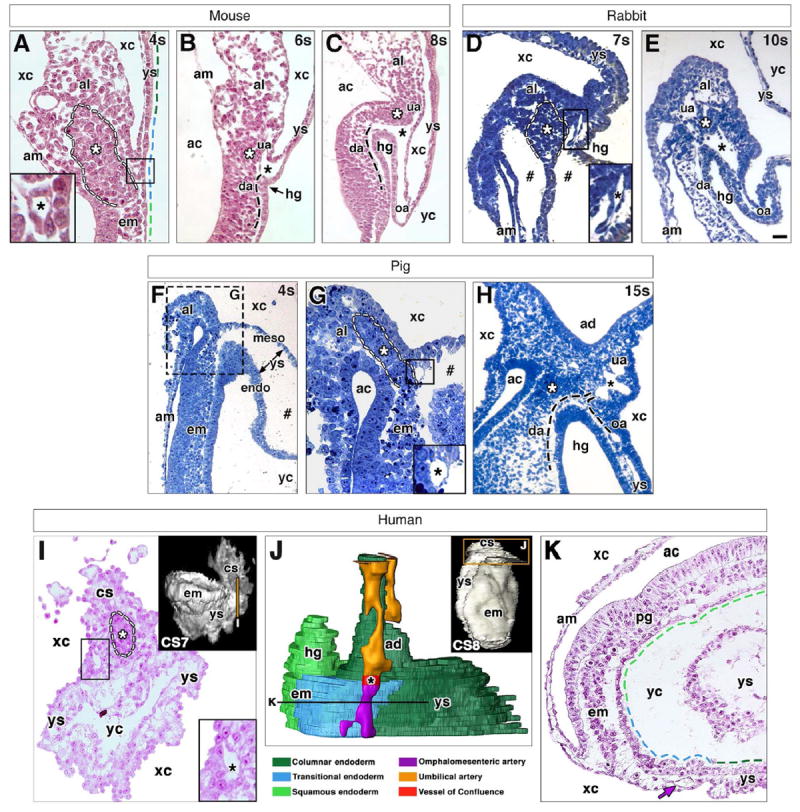
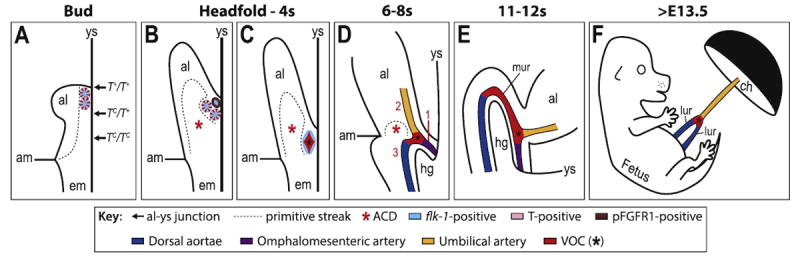
How the fetal-placental arterial connection is made and positioned relative to the embryonic body axis, thereby ensuring efficient and directed blood flow to and from the mother during gestation, is not known. Here we use a combination of genetics, timed pharmacological inhibition in living mouse embryos, and three-dimensional modeling to link two novel architectural features that, at present, have no status in embryological atlases. The allantoic core domain (ACD) is the extraembryonic extension of the primitive streak into the allantois, or pre-umbilical tissue; the vessel of confluence (VOC), situated adjacent to the ACD, is an extraembryonic vessel that marks the site of fetal-placental arterial union. We show that genesis of the fetal-placental connection involves the ACD and VOC in a series of steps, each one dependent upon the last. In the first, Brachyury (T) ensures adequate extension of the primitive streak into the allantois, which in turn designates the allantoic-yolk sac junction. Next, the streak-derived ACD organizes allantoic angioblasts to the axial junction; upon signaling from Fibroblast Growth Factor Receptor-1 (FGFR1), these endothelialize and branch, forming a sprouting VOC that unites the umbilical and omphalomesenteric arteries with the fetal dorsal aortae. Arterial union is followed by the appearance of the medial umbilical roots within the VOC, which in turn designate the correct axial placement of the lateral umbilical roots/common iliac arteries. In addition, we show that the ACD and VOC are conserved across Placentalia, including humans, underscoring their fundamental importance in mammalian biology. We conclude that T is required for correct axial positioning of the VOC via the primitive streak/ACD, while FGFR1, through its role in endothelialization and branching, further patterns it. Together, these genetic, molecular and structural elements safeguard the fetus against adverse outcomes that can result from vascular mispatterning of the fetal-placental arterial connection.

Keywords: Allantoic core domain (ACD); Brachyury (T); Fibroblast Growth Factor Receptor 1 (FGFR1); Primitive streak; Vascular patterning; Vessel of confluence (VOC).


Figures

Fig. 1
Fig. 1. Positioning the allantoic-yolk sac junction and vessel of confluence requires T
Unless otherwise indicated, histological sections in this (B-D, K-M: paraffin wax preparation; F-H: plastic preparation) and all subsequent figures are mid-sagittal with orientation as depicted by compass in A (A, anterior (proximal); D, dorsal; P, posterior (distal); V, ventral). (A) Schematic diagram through the mid-sagittal plane of the posterior embryonic-extraembryonic interface over time; data are from previous reports (see text) regarding the allantois-associated visceral endoderm (AX), the primitive streak’s extraembryonic extension/ACD (orange), and the VOC (magenta; black asterisk). The posterior limit of the primitive streak coincides with the posterior limit of the allantoic bud’s ventral connection to the single layer of yolk sac mesoderm, called here the “allantoic-yolk sac junction” (blue arrow). (B-D) Genesis of the VOC and localization of T in the flk-1: lacZ reporter mouse strain; black dashed lines outline ACD (C, D, white asterisk). Insets are enlarged box regions in main panels. (B) T-positive angioblasts clustering at the allantoic-yolk sac junction; (C) a mixture of T-positive angioblasts (black arrowhead) and T-negative endothelializing angioblasts (red arrowhead) as the cluster matures; (D) the fully mature T-negative VOC (black asterisk). (E) Graph showing that the appearance of the endothelialized VOC begins at the early headfold stage, and is invariably present by 2s. Sample sizes are indicated at each data point. (F-H) Comparison, amongst TC littermates, of the primitive streak’s extension into the extraembryonic region (dashed red line); vertical arrows indicate the distance of this extension measured from the amnion to the allantoic-yolk sac junction (blue arrow). Arrowhead (H) indicates that the extraembryonic streak may be fragmenting. (I) Placement of the allantoic-yolk junction decreases over time amongst all TC genotypes. The mean distance ± SEM (error bars) measured vertically from the amnion, shown in (F-H) (y=0, embryonic-extraembryonic boundary); sample sizes per stage and genotype are indicated for each data point. (J) Length of ACD, depicted as mean ± SEM (error bars) with sample sizes indicated at the base of each bar; asterisk, significant P-value (Student t-Test: T+/T+ vs TC/T+, P=0.0051; T+/T+ vs TC/TC, P=0.0047; TC/T+ vs TC/TC, P=0.0009). (K-M) T immunostaining in main panels; upper right insets (K, L) are enlarged from the boxed region of the main panel, showing the VOC (black asterisk). Magenta-boxed insets (K-M) show PECAM-1 immunostaining of mid-sagittal sections through the VOC (K, L), or where the VOC should be, but is missing (red arrow, M). Black dashed lines outline the posteriormost extension of the primitive streak, which extends into the allantois (ACD, white asterisk) in K and L, but is limited to the embryo in M. (N) Schematic representation of how placement of the allantoic-yolk sac junction (color-filled dots along yolk sac) drops (arrowheads) anteriorly (proximally) over time in each genotype. Dashed line indicates embryonic-extraembryonic boundary, red asterisk highlights aberrant embryonic placement of the junction in the TC/T+ and TC/TC mutants, also indicated in (I). Scale bar (M): 10 μm (K, L magenta insets); 18 μm (B-D, F-H, K, L, M magenta inset); 25 μm (M). al, allantois; am, amnion; em, embryo; hg, hindgut; ps, primitive streak; ua, umbilical artery; xc, exocoelomic cavity; ys, yolk sac.
Fig. 2
Fig. 2. Placement of the VOC, umbilical artery, and OUA connection is dose-dependent on T
(A) Dot-box plot of CASP3+ cells in allantois and overlying yolk sac (EB-6s stages); means (dashed line), SEM (error bars); n.s., not significant (Student t-Test; T+/T+ vs TC/T+, P=0.8912; T+/T+ vs TC/TC, P=0.3714; TC/T+ vs TC/TC, P=0.2134). (B-D) Immunostaining for FLK-1 amongst TC genotypes. Black boxed insets, lower left: enlarged prospective VOC of black-boxed region in main panels. Black arrows (main panels) and arrowheads (insets): correctly patterned FLK-1 angioblasts within distal allantois and prospective VOC. Dashed lines, posteriormost extension of primitive streak (B-D); white asterisk, ACD (B, C). Magenta inset (D): a misplaced PECAM-1-positive (magenta arrow) vessel within the yolk sac near its junction with the allantois, the region of which is indicated by the magenta box in the main panel (see text). (E, F) 3D models (frontal ventral views) reconstructed from PECAM-1-immunostained nascent arterial vessels at the posterior embryonic-extraembryonic interface; dashed vertical line (E, F) marks the axial midline. Color key: blue, dorsal aortae (da); red, VOC (asterisk); yellow, umbilical artery (ua). (G) TC/TC mutant specimen immunostained for PECAM-1, sagittal section, lateral to the midline, equivalent to the solid horizontal line in F. White arrow indicates a vessel forming at the allantoic-yolk sac junction off the midline. (H-K) Examples of tissue sections used for the 3D reconstructions in (L-N). (H) PECAM-1-immunostained transverse section showing the paired da on either side of the hindgut (hg), and the omphalomesenteric artery (oa) at the ventral midline. (I-K) Colorized transverse sections from the level of the oa (H, I) and proceeding posteriorly (distally), to capture the VOC (J) and ua (K). All reconstructed sections were PECAM-1 immunostained. (L-N) Top, ventral (frontal) and side views (posterior, right) of the OUA connection in all three T genotypes, colored as described above with addition of purple for the oa. Red arrows (N) indicate missing OUA connection; vertical dashed line indicates the axial midline and the site where the VOC (red, located off center) should be located. Scale bar (G): 10 μm (D magenta inset); 20 μm (B-D, H-K), 25 μm (G). al, allantois; am, amnion; em, embryo; ys, yolk sac.
Fig. 3
Fig. 3. Downstream consequences on vascular remodeling of the OUA connection as a result of earlier misplacement of the VOC
(A, C, E) 3D models reconstructed from PECAM-1-immunostained arterial vessels and associated hindgut at the posterior embryonic-extraembryonic interface in TC littermates during vascular remodeling of the OUA connection (11s stage). Color key as described in Fig. 2, with the addition of green for the hindgut. mur, medial umbilical roots, missing in panel E (red arrow); white arrowhead (E), partial arterial union. Side views, posterior to the right. See text for further details. (B, D, F) Transverse PECAM-1-immunostained histological sections taken at the same level in each of the three T genotypes to illustrate the fully extended mur in the wildtype (B), reduced mur in the heterozygotes (D), and the absence of the mur (red arrows) in the homozygotes (F). (G) Volume of hindgut (7–10s) in TC littermates, depicted as mean ± SEM (error bars) with sample sizes indicated at the base of each bar; asterisk, significant P-values (Student t-Tests; T+/T+ vs TC/TC, P=0.0078; TC/T+ vs TC/TC, P=0.0005). (H) Average length of umbilical artery (upper data points) and lateral umbilical roots (lur; lower data points) as a function of nominal days postcoitum (“embryonic day, E”). Data plotted as mean ± SEM (error bars) with sample sizes for each stage and genotype (T+/T+, TC/T+) displayed below each data point; asterisk, significant P-values (Student t-Tests; E12.5 T+/T+ lur vs TC/T+ lur, P=0.0122; E13.5 T+/T+ lur vs TC/T+ lur, P=0.0002; E14.5 T+/T+ lur vs TC/T+ lur, P=0.0062). (I, J) Fetalplacental unit, ~E13.5, proximal portion of umbilical cord, i.e. closest to the fetus, is boxed and enlarged in insets. Arrowheads indicate the posterior extent of lateral umbilical roots in the umbilical cord. Scale bar (J): 22 μm (B, D, F); 1 mm (I, J). uv, umbilical vein.
Fig. 4
Fig. 4. Localization of FGF members within the nascent VOC
(A-G) Immunostaining for FGFR3 (A), FGFR2 (B), FGFR1 (C), FGF2 (D), all at the headfold stages, and pFGFR1 (E-G) in EB through 4s stage flk-1: lacZ reporter specimens. Boxed region in main panels is the prospective VOC (A-E) or endothelialized VOC (F, G) region, enlarged in insets, lower left. Dashed outline, posteriormost (distalmost) extension of the primitive streak, and white asterisk, ACD (A-D, F, G). Red arrowheads (A, B), FGFR-3- and FGFR-2-negative cells. Black arrowhead (C), FGFR1-positive rosette. Black arrowhead (D), FGF2-positive cell. Black arrowheads (E, F), flk-1-positive/pFGFR1-positive angioblasts. Black asterisk (G), flk-1-positive/pFGFR1-negative mature VOC. (H-K) EHF stage, frontal (ventral) optical section through ventral allantoic and embryonic tissue stained with DAPI (H), T (I), pFGFR1 (J); channels merged (K). Insets are enlargements of prospective VOC, boxed in main panels. White arrowhead, T-positive/pFGFR1-positive angioblast; red arrowhead, pFGFR1-positive/T-negative angioblast. Scale bar (G): 20 μm (A-K). al, allantois; am, amnion; ch, chorion; em, embryo; ua, umbilical artery; ys, yolk sac.
Fig. 5
Fig. 5. Stage-specific failure of formation of the vascular confluence in PD173074- or chlorate- treated specimens
“Control” indicates untreated conceptuses that were cultured alongside pharmacologically-treated ones until 7–8s stage. Transverse histological sections (F-I, M, N, T-V) are oriented with ventral toward the bottom. Black asterisk indicates the VOC (A, C, D, F, H, M, O, Q, R, T, U). (A-D, O-R) 3D models, in side view (posterior to the right), reconstructed from post-culture PECAM-1-immunostained arterial vessels at the posterior embryonic-extraembryonic interface of control (A, O), PD173074-treated (B-D) or chlorate-treated (P-R) conceptuses (initial stages, upper right). Color key as in Fig. 2. Black arrows indicate missing arterial connections due to loss of the VOC (B, P) or to incomplete branching of the VOC (C, Q). (E, S) Frequency of anomalies observed in the vascular confluence in post-culture specimens from PD173074 (E) or chlorate (S) experiments by their initial stage, sample size and group’s treatment (± PD173074 or chlorate). (F, G) Transverse sections in the flk-1: lacZ reporter showing the PECAM-1-positive endothelialized VOC in the control (F), but non-endothelialized angioblasts in the prospective VOC of PD173074-treated specimens (G, white arrow). (H, I) Transverse sections in the flk-1: lacZ reporter showing down-regulation of T in the endothelialized control VOC (H) and in nonendothelialized angioblasts of the prospective VOC in PD173074-treated specimens (white arrow) (I). (J-L) Histological sections through the prospective VOC showing that pFGFR1 is unaffected in the three TC genotypes. (M, N) Transverse sections in the flk-1: lacZ reporter showing down-regulation of OCT-3/4 in the endothelialized VOC of untreated controls (M) and in non-endothelialized angioblasts of the prospective VOC in PD173074-treated specimens (N, white arrow). (T-V) Transverse histological sections showing the PECAM-1-positive endothelialized VOC in a control (T) and a chlorate-treated specimen (U), and non-endothelialized angioblasts in the prospective VOC of another chlorate-treated specimen (V, white arrow). Scale bar (V): 6 μm (J-L); 25 μm (F-I, M, N, T-V). al, allantois; da, dorsal aortae; omphalomesenteric artery, oa; umbilical artery; ys, yolk sac.
Fig. 6
Fig. 6. Conserved features at the posterior embryonic-extraembryonic interface of placental mammals
For all panels: black asterisk (A-E, G-I) indicates VOC; white asterisk (A-E, G-I) and dashed outline (A, D, G, I) indicate dense allantoic core; black dashed line (B, C, H) indicates arterial vessels out of sectional plane; colored dashed lines (A, K) indicate distinct region of visceral endoderm with color key below J; and hash mark (D, F, G) indicates artifactual spaces produced by fixation. (A-C) Posterior embryonicextraembryonic interface of a mouse conceptus at the 4s (A), 6s (B) and 8s (C) stage. VOC in A is boxed and enlarged in inset. (D, E) Posterior embryonic-extraembryonic interface of a rabbit conceptus at the 7s (D) and 10s (E) stages. VOC in D is boxed and enlarged in inset. (F-H) Posterior embryonic-extraembryonic interface of a pig conceptus at the 4s (F, G) and 15s (H) stages. (G) Enlargement of hashed region in F; VOC is boxed in main panel and enlarged in inset. (I-K) Posterior embryonic-extraembryonic interface of a human conceptus at Carnegie stages 7 (I) and 8 (J,K). Volume-rendered models (insets I, J) with transverse sections (I, K) oriented ventral toward the bottom and taken at the level of vertical line (inset I) and horizontal line (J). 3D model (J, color key below), reconstructed from nascent arterial vessels and endoderm (boxed region, inset J). VOC in I is boxed and enlarged in inset. Purple arrow (K) indicates omphalomesenteric artery (oa). Scale bar (E): 20 μm (A, B, I); 40 μm (C, D, G); 90 μm (F); 100 μm (E, H); 300 μm (Insets I, J); 400 μm (K). ac, amniotic cavity; ad, allantoic diverticulum; am, amnion; al, allantois; cs, connecting stalk; da, dorsal aorta; em, embryo; endo, endoderm; hg, hindgut; meso, mesoderm; pg, primitive groove; ua, umbilical artery; xc, exocoelomic cavity; yc, yolk cavity; ys, yolk sac.
Fig. 7
Fig. 7. The primitive streak and VOC collaborate to drive fetal-placental union in the mouse via T and pFGFR1
Schematics in A-C are depicted entirely through the midsagittal plane, while the embryonic component in D, E is slightly lateral, to visualize one of the paired dorsal aortae. (A) As the allantoic bud (al) emerges (~E7.25), the T-positive primitive streak (dashed outline) has extended into the extraembryonic region, positioning the allantoic-yolk sac junction (arrows), where prospective VOC angioblasts (colored ovals) exhibit flk-1 (light blue), pFGFR1 and T (alternating brown and pink, respectively). T-dosage, i.e., the number of normal copies of T present, regulates extension of the primitive streak and thus, correct axial placement of the allantoic-yolk sac junction according to TC genotype (arrows) along the anteroposterior axis. (B) As the al elongates (~E7.75), the streak (dashed outline) expands into the ACD (red asterisk), where it ensures that the prospective VOC angioblasts (colored ovals), which are now beginning to lose T (pink), are organized to the midline. (C) By 2s (~E8.25), angioblasts have endothelialized (light blue flattenedovals) as a result of FGFR1 signaling to form the VOC (red, black asterisk), which now lacks both T (pink) and pFGFR1 (brown). (D) By 6–8s (~E8.5), the primitive streak (dashed outline)/ACD (red asterisk) regresses (Downs et al., 2009), and the VOC (red, black asterisk) branches as a result of pFGFR1 signaling to unite, in sequential order (red numbers), the omphalomesenteric artery (purple; 1), umbilical artery (yellow; 2), and dorsal aortae (dark blue; 3) to create the OUA connection. (E) Anterior movements during embryonic turning (11s, ~E9.0) cause the VOC (red, black asterisk) to curve around the hindgut (hg), creating the medial umbilical roots (mur). (F) Later, during the early-to-mid fetal period (~E13.5), the mur begin to regress, allowing the lateral umbilical roots (lur, dark blue; derived from the dorsal aortae) to assume prominence, connecting to the umbilical artery (yellow) at the VOC branchpoint (red, black asterisk). am, amnion; ch, chorion; em, embryo; ys, yolk sac.

References

    1. Abu-Abed S, Dollé P, Metzger D, Beckett B, Chambon P. The retinoic acidmetabolizing enzyme, CYP26A1, is essential for normal hindbrain patterning, vertebral identity, and development of posterior structures. Genes Dev. 2001;15:226–240. - PMC - PubMed
    1. Arora R, Papaioannou VE. The murine allantois: a model system for the study of blood vessel formation. Blood. 2012;120:2562–2572. - PMC - PubMed
    1. Beddington RSP. Induction of a second neural axis by the mouse node. Development. 1994;120:613–620. - PubMed
    1. Blum M, Andre P, Muders K, Schweickert A, Fischer A, Bitzer E, Bogusch S, Beyer T, van Straaten HW, Viebahn C. Ciliation and gene expression distinguish between node and posterior notochord in the mammalian embryo. Differ Res Biol Divers. 2007;75:133–146. - PubMed
    1. Bonnevie K. New facts on mesoderm formation and proamnion derivatives in the normal mouse embryo. J Morphol. 1950;86:495–546. - PubMed

MeSH terms

LinkOut - more resources