. 2017 Aug 15;23(16):4831-4842.
doi: 10.1158/1078-0432.CCR-17-0146. Epub 2017 Apr 7.

Epigenetic Regulation of KPC1 Ubiquitin Ligase Affects the NF-κB Pathway in Melanoma

Affiliations

Epigenetic Regulation of KPC1 Ubiquitin Ligase Affects the NF-κB Pathway in Melanoma

Yuuki Iida et al. Clin Cancer Res. .

Abstract

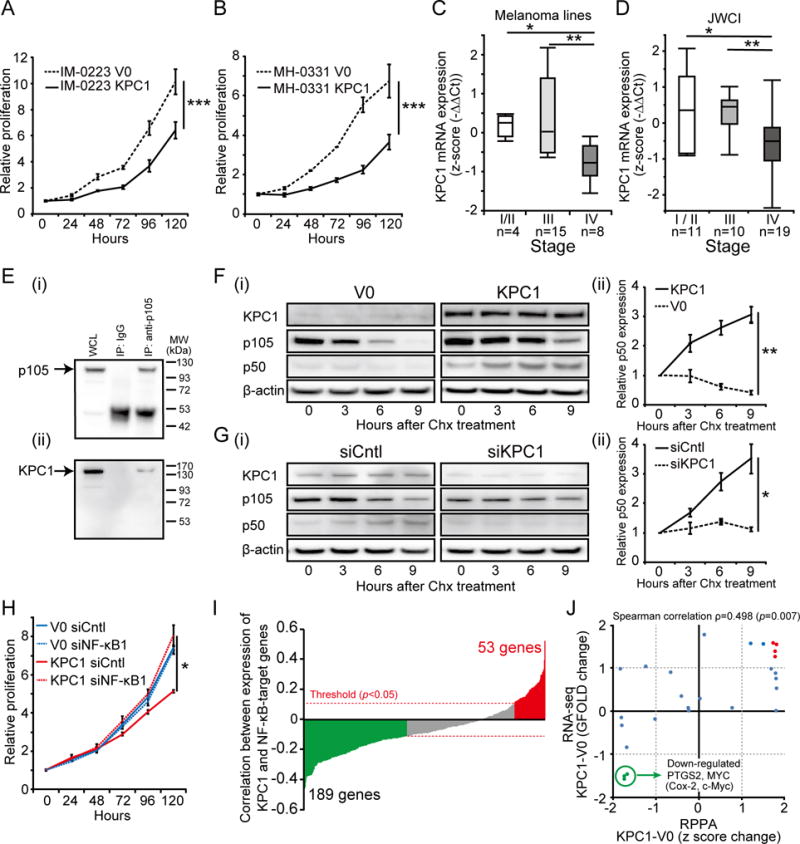
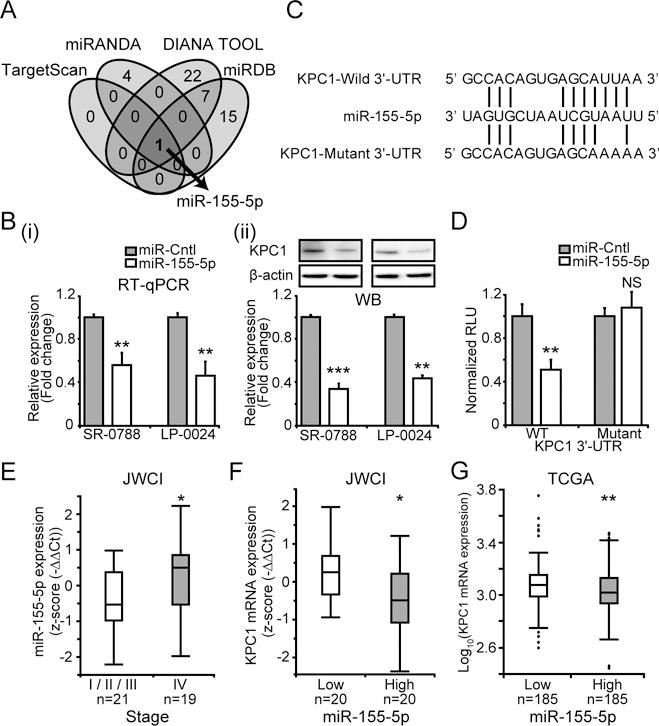
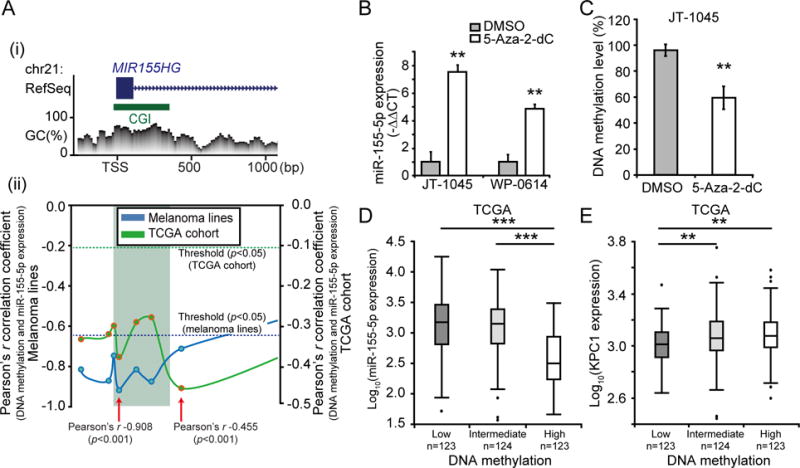
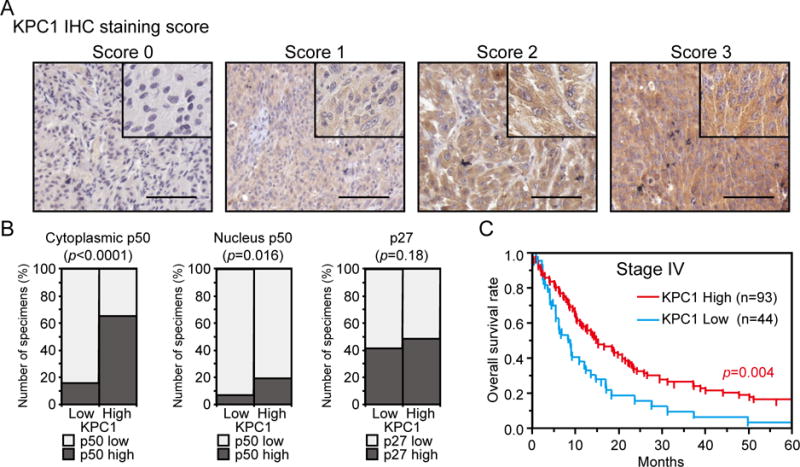
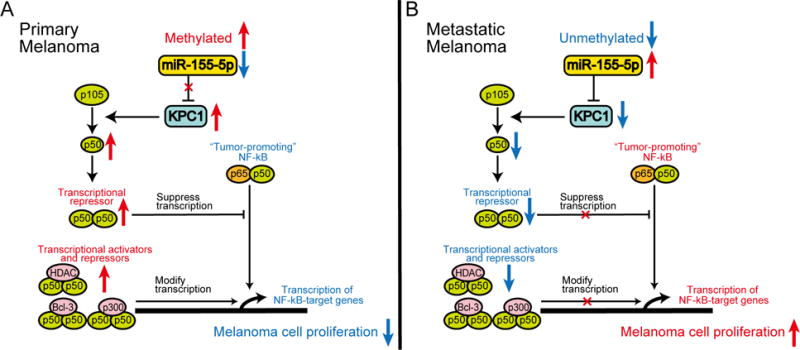
Purpose: Abnormal activation of the NF-κB pathway induces a more aggressive phenotype of cutaneous melanoma. Understanding the mechanisms involved in melanoma NF-κB activation may identify novel targets for this pathway. KPC1, an E3 ubiquitin ligase, is a regulator of the NF-κB pathway. The objective of this study was to investigate the mechanisms regulating KPC1 expression and its clinical impact in melanoma.Experimental Design: The clinical impact of KPC1 expression and its epigenetic regulation were assessed in large cohorts of clinically well-annotated melanoma tissues (tissue microarrays; n = 137, JWCI cohort; n = 40) and The Cancer Genome Atlas database (TCGA cohort, n = 370). Using melanoma cell lines, we investigated the functional interactions between KPC1 and NF-κB, and the epigenetic regulations of KPC1, including DNA methylation and miRNA expression.Results: We verified that KPC1 suppresses melanoma proliferation by processing NF-κB1 p105 into p50, thereby modulating NF-κB target gene expression. Concordantly, KPC1 expression was downregulated in American Joint Committee on Cancer stage IV melanoma compared with early stages (stage I/II P = 0.013, stage III P = 0.004), and low KPC1 expression was significantly associated with poor overall survival in stage IV melanoma (n = 137; HR 1.810; P = 0.006). Furthermore, our data showed that high miR-155-5p expression, which is controlled by DNA methylation at its promoter region (TCGA; Pearson's r -0.455; P < 0.001), is significantly associated with KPC1 downregulation (JWCI; P = 0.028, TCGA; P = 0.003).Conclusions: This study revealed novel epigenetic regulation of KPC1 associated with NF-κB pathway activation, promoting metastatic melanoma progression. These findings suggest the potential utility of KPC1 and its epigenetic regulation as theranostic targets. Clin Cancer Res; 23(16); 4831-42. ©2017 AACR.


Conflict of interest statement

Conflict of Interest: The authors declare no potential conflicts of interest.

Figures

Figure 1
Figure 1. KPC1 suppresses melanoma cell proliferation by inducing NF-κB1 p105 processing into p50
(A & B) IM-0223 or MH-0331 were stably transfected with empty vector (V0) or cDNA coding Myc-KPC1 (KPC1). Melanoma cell proliferation after the transfection was assessed. KPC1 overexpression inhibited melanoma cell proliferation in (A) IM-0223 (B) MH-0331 compared to control at 120 hours (t-test, *** p<0.001). (C) Box plot of KPC1 expression in melanoma lines from AJCC stage I/II (n=4), stage III (n=15), and stage IV (n=8) assessed by RT-qPCR (Wilcoxon-test, * p<0.05, ** p<0.01). (D) KPC expression was analyzed in melanoma patients’ tissues. Boxplot of KPC1 expression in melanoma FFPE samples from AJCC stage I/II (n=11), stage III (n=10), and stage IV (n=19) assessed by RT-qPCR (JWCI cohort, n=40) (Wilcoxon-test, * p<0.05, ** p<0.01). (E) Co-immunoprecipitation of KPC1 and p105. Immunoprecipitation (IP) was performed using anti-p105 or control IgG Abs for IM-0223 cell lysate overexpressing both KPC1 and p105. p105 was detected using anti-p105 Ab (i), and KPC1 was detected using anti-KPC1 Ab (ii) by WB. Whole cell lysate (WCL) was used as a positive control. (F) (i) Cycloheximide chasing assay was performed in IM-0223. Cycloheximide (Chx, 50 μg/ml) was added after transfection of cDNA coding for human p105 and incubated for the indicated time before protein extraction. WB was performed using anti-KPC1 Ab, anti-Flag Ab (to detect exogenous p105 and p50), or anti-β-actin Ab. (ii) p50 expression relative to 0 hour was quantified. p50 expression was higher in KPC1-overexpressing cells compared to control cells at 9 hours (t-test, ** p<0.01). (G) (i) SR-0788 was transfected with control si-RNA (siCntl) or siRNA for KPC1 (siKPC1), and cycloheximide chasing assay was performed. WB was performed using anti-KPC1 Ab, anti-Flag Ab, or anti-β-actin Ab. (ii) p50 expression relative to 0 hour was quantified. p50 expression was lower in cells with KPC1 suppression compared to control cells at 9 hours (t-test, * p<0.05). (H) IM-0223 cells (V0 and KPC1) were transfected with control siRNA (siCntl) or siRNA for NF-κB1 (siNF-κB1). p105 knock-down promoted proliferation in KPC1-overexpressing cells at 120 hours (t-test, * p<0.05). (I) Correlation (Spearman’s rank correlation rho) between KPC1 expression and expression of NF-κB-target genes (413 genes) from TCGA cohort (n=370) was analyzed. Bar plots showing the negative correlation for 189 genes (green bars, p<0.05) and positive correlation for 53 genes (red bars, p<0.05)). Red dotted lines indicate the statistical significant threshold (p=0.05) for correlation analysis. (J) RPPA and RNA-seq were performed for IM-0223 (V0 and KPC1) to demonstrate the downstream regulation of NF-κB-target genes. Scatter plots showing protein expression change (RPPA) and RNA expression change (RNA-seq) from 28 proteins / genes that are targeted by NF-κB pathway. Targets were considered to be up-regulated (red dots) when z score change for RPPA (p<0.05) and GFOLD change for RNA-seq were both more than one, and down-regulated (green dots) when less than -1. Error bars represent means ± standard deviation (SD) from replicates (n=3). WB images were cropped for clarity and focus on relevant bands.
Figure 2
Figure 2. Epigenetic regulatory mechanism of KPC1 expression
(A) Venn diagram showing putative miRs that target 3′-UTR of KPC1 mRNA predicted by different computational tools (TargetScan, miRANDA, DIANA TOOL, and miRDB). (B) SR-0788 and LP-0024 were transfected with pre-miR-155-5p (miR-155-5p) or miR control (miR-Cntl). KPC1 expression was quantified using (i) RT-qPCR (ii) WB after miR-155-5p transfection (t-test, ** p<0.01, *** p<0.001). (C) miR-155-5p sequence aligned with human KPC1-Wild 3′-UTR (WT) and KPC1-Mutant 3′-UTR (Mutant) sequences. (D) A luciferase reporter activity assay to determine miR-155-5p targets 3′-UTR of KPC1 using human KPC1-Wild 3′-UTR (WT) and KPC1-Mutant 3′-UTR (Mutant) sequences on RenSP vector (t-test, NS p≥0.05, ** p<0.01). (E) Boxplot of miR-155-5p expression in JWCI cohort assessed by RT-qPCR (n=40, Wilcoxon-test, * p<0.05). (F) Boxplot of KPC1 expression in the patients with miR-155-5p low (n=20) or high (n=20) expression (classified based on median of miR-155-5p expression) from JWCI cohort (n=40, Wilcoxon-test, * p<0.05). (G) Boxplot showing KPC1 expression in patients with miR-155-5p low (n=185) and high (n=185) expression (classified based on median of miR-155-5p expression) from TCGA cohort (t-test, ** p<0.01). Error bars represent means ± SD from replicates (n=3). WB images were cropped for clarity and focus on relevant bands.
Figure 3
Figure 3. Regulatory mechanism of miR-155-5p expression in melanoma
(A) Promoter DNA methylation level of MIR155HG gene were analyzed to investigate the regulatory mechanism of miR-155-5p expression. (i) MIR155HG gene structure [based on RefSeq Feb. 2009 (GRCh37/hg19) assembly] and CpG Context at promoter region. Blue box represents exon and green box CGI (CpG island). (ii) Correlation analysis between DNA methylation and miR-155-5p expression levels from ten melanoma lines and TCGA cohort (n=370). The correlations were calculated using the Pearson’s r correlation coefficient for each CpG sites. Each point represents one CpG site and solid lines indicate the variation of correlation at the promoter region of MIR155HG gene. Dotted lines indicate the statistical significant threshold (p=0.05) for correlation analysis. CpG sites which demonstrated the strongest negative correlation are indicated by red arrows with its Pearson’s r in the figure. (B) JT-1045 and WP-0614 were treated with medium supplemented with 5-Aza-2-dC or control (DMSO), and miR-155-5p expression was quantified using RT-qPCR (t-test, ** p<0.01). (C) Boxplot showing DNA methylation level of miR-155-5p promoter region quantified by MSP from JT-1045 treated with 5-Aza-2-dC or control (DMSO) (t-test, ** p<0.01). (D & E) Association between miR-155-5p promoter DNA methylation level (Chr21:26,934,456, cg23433889) and miR-155-5p or KPC1 expression were analyzed for TCGA cohort (n=370). Boxplot showing (D) miR-155-5p expression or (E) KPC1 expression in patients with low (n=123), intermediate (n=124) and high (n=123) DNA methylation level (classified based on tertile of DNA methylation level) (t-test, ** p<0.01, *** p<0.001). Error bars represent means ± SD from replicates (n=3).
Figure 4
Figure 4. KPC1, p50 and p27 expression in melanoma patients’ tissues
KPC1, NF-κB1 p50, and p27 expression were analyzed in melanoma patients’ tissues. (A) Representative images of AJCC stage IV melanoma TMA samples immunostained using anti-KPC1 Ab are shown. Staining intensity was evaluated from 0 (negative) to 3 (strong). The magnifications of the low-power and high-power images are ×100 and ×200, respectively. Scale bar = 100 μm. (B) Association between KPC1 expression and cytoplasmic p50, nucleus p50 or p27 expression in stage IV melanoma TMA samples (n=262). (C) Kaplan-Meier curves showing OS for KPC1 high (Score 2 and 3) or low (Score 0, 1) expression patients from stage IV melanoma TMA (n=137). Significance of log rank is shown.
Figure 5
Figure 5. Schematic representation of DNA methylation, miR-155-5p, KPC1, and p105 processing into p50 in melanoma
(A) In primary melanoma, where methylation represses miR-155-5p expression and KPC1 is highly expressed, excess p50–p50 homodimers suppress tumor-promoting p65–p50 heterodimers or modify transcription of NF-κB-target genes with other transcriptional modulators, resulting in suppressive effect on melanoma cell proliferation. (B) Contrarily, metastatic melanoma, which has low DNA methylation / high miR-155-5p and low KPC1 expression, lacks excess p50–p50 homodimers, promoting cell proliferation.

References

    1. Balch CM, Gershenwald JE, Soong SJ, Thompson JF, Atkins MB, Byrd DR, et al. Final version of 2009 AJCC melanoma staging and classification. J Clin Oncol. 2009;27(36):6199–206. doi: 10.1200/JCO.2009.23.4799. - DOI - PMC - PubMed
    1. Siegel R, Ma J, Zou Z, Jemal A. Cancer statistics, 2014. CA Cancer J Clin. 2014;64(1):9–29. doi: 10.3322/caac.21208. - DOI - PubMed
    1. Chapman PB, Hauschild A, Robert C, Haanen JB, Ascierto P, Larkin J, et al. Improved survival with vemurafenib in melanoma with BRAF V600E mutation. N Engl J Med. 2011;364(26):2507–16. doi: 10.1056/NEJMoa1103782. - DOI - PMC - PubMed
    1. Robert C, Karaszewska B, Schachter J, Rutkowski P, Mackiewicz A, Stroiakovski D, et al. Improved overall survival in melanoma with combined dabrafenib and trametinib. N Engl J Med. 2015;372(1):30–9. doi: 10.1056/NEJMoa1412690. - DOI - PubMed
    1. Griewank KG, Scolyer RA, Thompson JF, Flaherty KT, Schadendorf D, Murali R. Genetic alterations and personalized medicine in melanoma: progress and future prospects. J Natl Cancer Inst. 2014;106:2djt435. doi: 10.1093/jnci/djt435. - DOI - PubMed