Identification of small molecule inhibitors of the Aurora-A/TPX2 complex
- PMID: 28389630
- PMCID: PMC5458272
- DOI: 10.18632/oncotarget.16738
Identification of small molecule inhibitors of the Aurora-A/TPX2 complex
Abstract
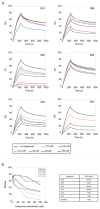
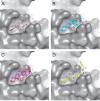
Aurora kinases are a family of cell division regulators that govern the correct assembly of a bipolar mitotic spindle and the fidelity of chromosome segregation. Their overexpression is associated with genomic instability and aneuploidy, and is frequently observed in cancer. Accordingly, competitive inhibitors targeting Aurora kinase activity at the ATP-binding site are being investigated for therapeutic purposes. Despite promising pre-clinical data, these molecules display moderate effects in clinical trials and incomplete selectivity, either against distinct family members, or other kinases. As an alternative approach, protein-protein interaction inhibitors targeting mitotic kinases and their activators can be exploited to achieve increased specificity of action. In this study, a virtual screening of small molecules led to the identification of 25 potential inhibitors of the interaction between Aurora-A and its activator TPX2. In vitro experiments confirmed that 4 hits bind Aurora-A in the low micromolar range and compete for TPX2 binding. Immunofluorescence assays showed that 2 compounds also yield lowered Aurora-A activity and spindle pole defects in cultured osteosarcoma cells. The identified protein-protein interaction inhibitors of the Aurora-A/TPX2 complex might represent lead compounds for further development towards pioneering anti-cancer drugs and provide the proof-of-concept for a new exploitable strategy to target mitotic kinases.
Keywords: Aurora-A kinase; TPX2; anti-cancer therapy; protein-protein interactions; small molecule inhibitors.
Conflict of interest statement
The authors declare no conflicts of interest.
Figures


Similar articles
-
Abrogation of AuroraA-TPX2 by novel natural inhibitors: molecular dynamics-based mechanistic analysis.J Recept Signal Transduct Res. 2015;35(6):626-33. doi: 10.3109/10799893.2015.1041645. Epub 2015 Sep 22. J Recept Signal Transduct Res. 2015. PMID: 26390942
-
A TPX2 Proteomimetic Has Enhanced Affinity for Aurora-A Due to Hydrocarbon Stapling of a Helix.ACS Chem Biol. 2016 Dec 16;11(12):3383-3390. doi: 10.1021/acschembio.6b00727. Epub 2016 Nov 1. ACS Chem Biol. 2016. PMID: 27775325
-
Characterization of Three Druggable Hot-Spots in the Aurora-A/TPX2 Interaction Using Biochemical, Biophysical, and Fragment-Based Approaches.ACS Chem Biol. 2017 Nov 17;12(11):2906-2914. doi: 10.1021/acschembio.7b00537. Epub 2017 Oct 30. ACS Chem Biol. 2017. PMID: 29045126
-
Allosteric Targeting of Aurora A Kinase Using Small Molecules: A Step Forward Towards Next Generation Medicines?Curr Med Chem. 2019;26(13):2234-2242. doi: 10.2174/0929867324666170727120315. Curr Med Chem. 2019. PMID: 28748768 Review.
-
Structural basis for the design of allosteric inhibitors of the Aurora kinase A enzyme in the cancer chemotherapy.Biochim Biophys Acta Gen Subj. 2020 Jan;1864(1):129448. doi: 10.1016/j.bbagen.2019.129448. Epub 2019 Oct 30. Biochim Biophys Acta Gen Subj. 2020. PMID: 31676293 Review.
Cited by
-
Insights into the non-mitotic functions of Aurora kinase A: more than just cell division.Cell Mol Life Sci. 2020 Mar;77(6):1031-1047. doi: 10.1007/s00018-019-03310-2. Epub 2019 Sep 27. Cell Mol Life Sci. 2020. PMID: 31562563 Free PMC article. Review.
-
CHD1 Promotes Sensitivity to Aurora Kinase Inhibitors by Suppressing Interaction of AURKA with Its Coactivator TPX2.Cancer Res. 2022 Sep 2;82(17):3088-3101. doi: 10.1158/0008-5472.CAN-22-0631. Cancer Res. 2022. PMID: 35771632 Free PMC article.
-
Selective Aurora A-TPX2 Interaction Inhibitors Have In Vivo Efficacy as Targeted Antimitotic Agents.J Med Chem. 2024 Sep 12;67(17):15521-15536. doi: 10.1021/acs.jmedchem.4c01165. Epub 2024 Aug 27. J Med Chem. 2024. PMID: 39190548 Free PMC article.
-
The role of Aurora kinase A in hepatocellular carcinoma: Unveiling the intriguing functions of a key but still underexplored factor in liver cancer.Cell Prolif. 2024 Aug;57(8):e13641. doi: 10.1111/cpr.13641. Epub 2024 Apr 8. Cell Prolif. 2024. PMID: 38590119 Free PMC article. Review.
-
Contribution of AurkA/TPX2 Overexpression to Chromosomal Imbalances and Cancer.Cells. 2024 Aug 22;13(16):1397. doi: 10.3390/cells13161397. Cells. 2024. PMID: 39195284 Free PMC article. Review.
References
MeSH terms
Substances
LinkOut - more resources
Full Text Sources
Other Literature Sources
Molecular Biology Databases
Research Materials
Miscellaneous

