. 2017 Apr 7;7(1):734.
doi: 10.1038/s41598-017-00821-5.

RNA sequence analysis of rat acute experimental pancreatitis with and without fatty liver: a gene expression profiling comparative study

Affiliations

RNA sequence analysis of rat acute experimental pancreatitis with and without fatty liver: a gene expression profiling comparative study

Qian Wang et al. Sci Rep. .

Abstract

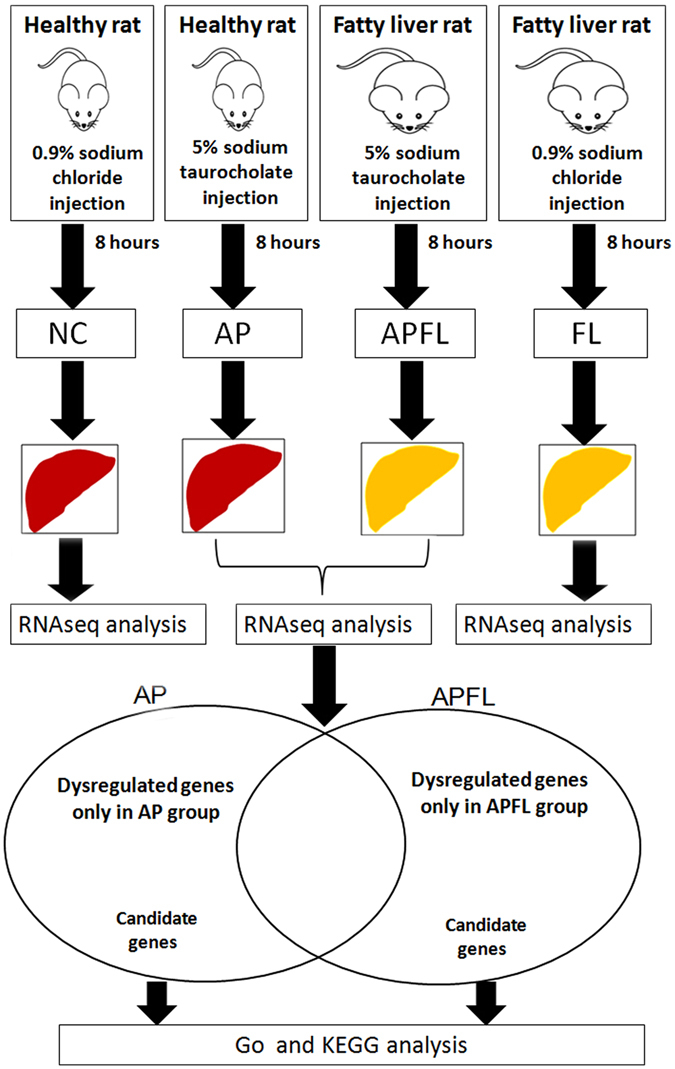
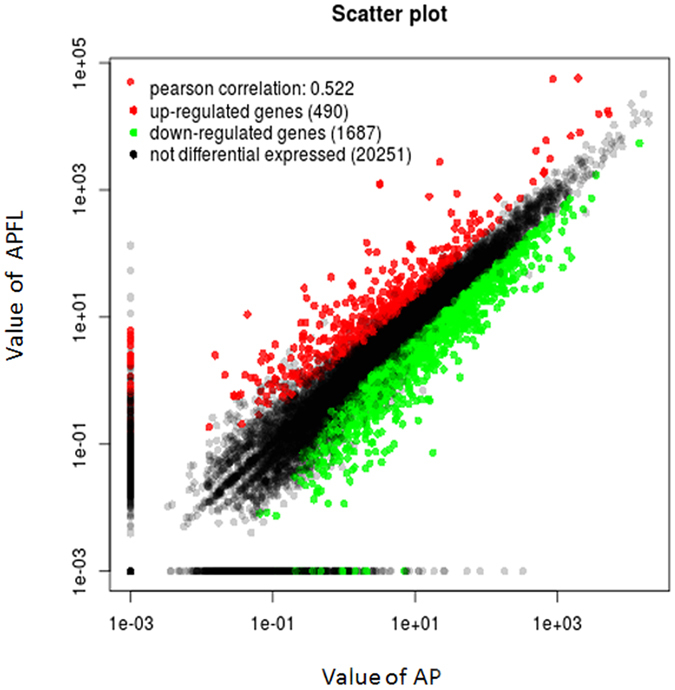
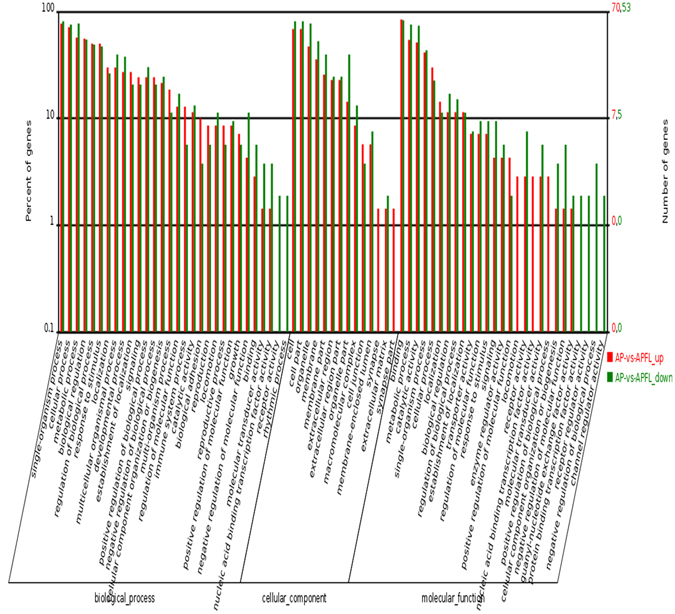
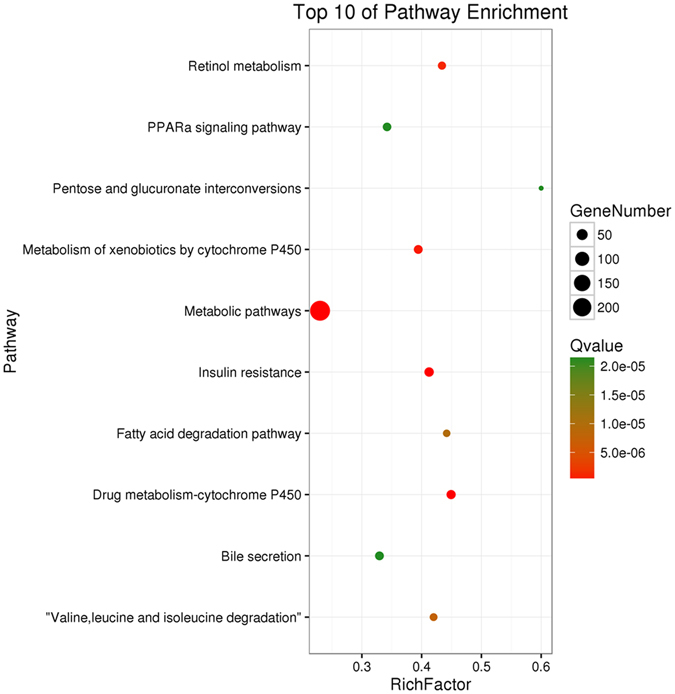
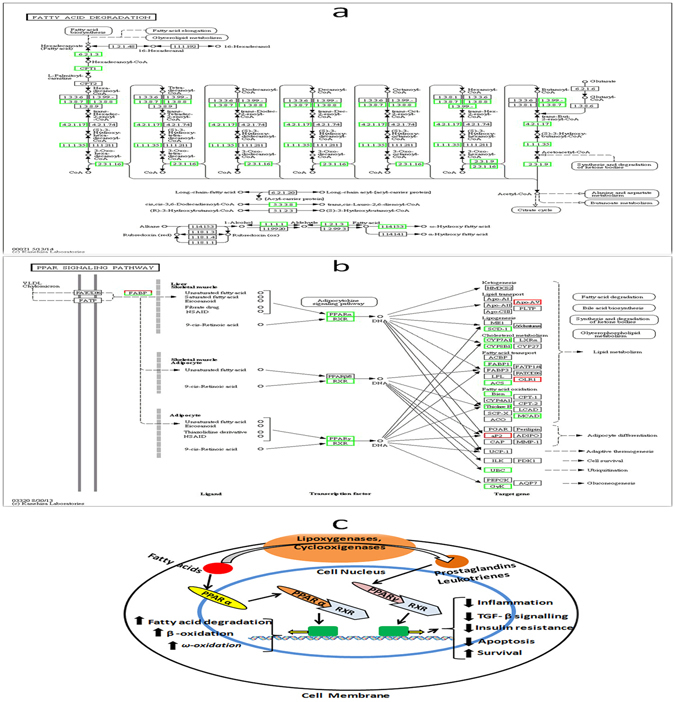
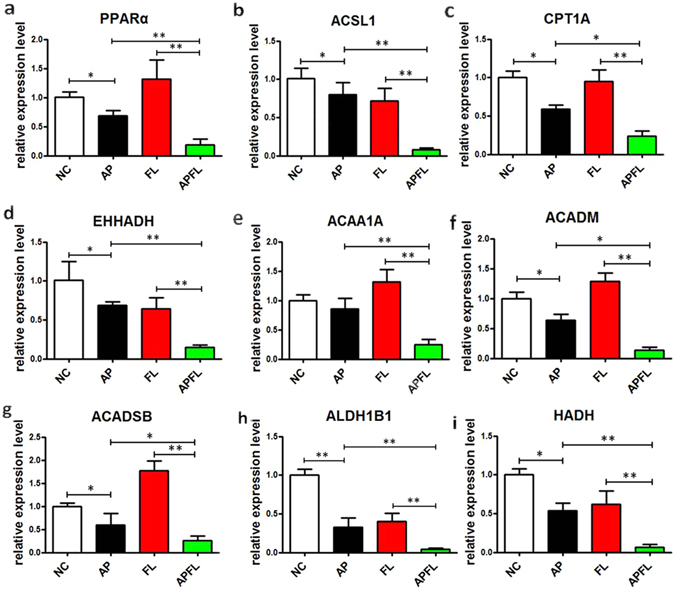
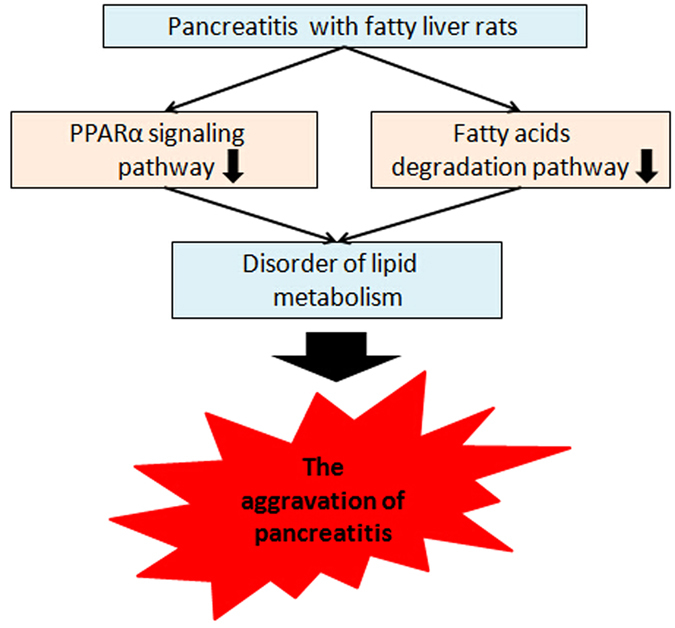
Fatty liver (FL) is one of the risk factors for acute pancreatitis and is also indicative of a worse prognosis as compared to acute pancreatitis without fatty liver (AP). The aim of the present study was to analyze, at the hepatic level, the differentially expressed genes (DEGs) between acute pancreatitis with fatty liver (APFL) rats and AP rats. GO (Gene Ontology) and KEGG (Kyoto Encyclopedia of Genes and Genomes) pathway analyses of these DEGs indicated that PPARα signalling pathway and fatty acid degradation pathway may be involved in the pathological process of APFL, which indicated that fatty liver may aggravate pancreatitis through these pathways. Moreover, the excessive activation of JAK/STAT signaling pathway and toll-like receptor signaling pathway was also found in APFL group as shown in heat map. In conclusion, the inhibition of PPARα signaling pathway and the fatty acid degradation pathway may lead to the further disorder of lipid metabolism, which can aggravate pancreatitis.


Conflict of interest statement

The authors declare that they have no competing interests.

Figures

Figure 1
Figure 1
Experimental flow graph. Step 1: Model induction and liver collection; Step 2: RNA-seq analysis of DEGs between APFL and AP group; Step 3: GO and KEGG analysis of DEGs between APFL and AP.
Figure 2
Figure 2
Tissue morphology in APFL and AP models. H&E staining: liver structure of rats in AP group (a) and APFL group (b); pancreas structure in AP (c) and APFL (d) group.
Figure 3
Figure 3
Differentially expressed genes between APFL and AP. Red spots represented up-regulated genes, and green spots down-regulated genes. Black spots indicate genes that were not differentially expressed between the two samples.
Figure 4
Figure 4
GO classification of DEGs between APFL and AP. The x-axis indicated the subcategories, the left y-axis represented the percentage of a specific category of DEGs and the right y-axis indicated the number of DEGs.
Figure 5
Figure 5
Scatter plot for KEGG enrichment results. The top 10 enrichment pathways are shown in the senior bubble chart. The Rich factor is the ratio of DEGs numbers annotated in this pathway term to all gene numbers annotated in this pathway term. A Q value is the corrected p value.
Figure 6
Figure 6
DEGs related to fatty acid degradation and PPARα signaling pathway between APFL and AP. KEGG pathway maps for (a) fatty acid degradation pathway (ko00071) and (b) PPARα signaling pathway (ko03320). Up-regulated genes are marked with red borders and down-regulated genes with green borders. Non-change genes are marked with black borders. Physiological function of the peroxisome proliferator activated receptors (PPARs) is shown in (c).
Figure 7
Figure 7
Cluster analysis of DEGs annotated in pathways associated with lipid metabolism and inflammation. The heatmap shows the expression levels of DEGs between APFL group and AP group. Transcript levels of genes encoding components involved in lipid metabolism were marked with an asterisk (*), insulin signaling pathway were marked with an asterisk (formula image
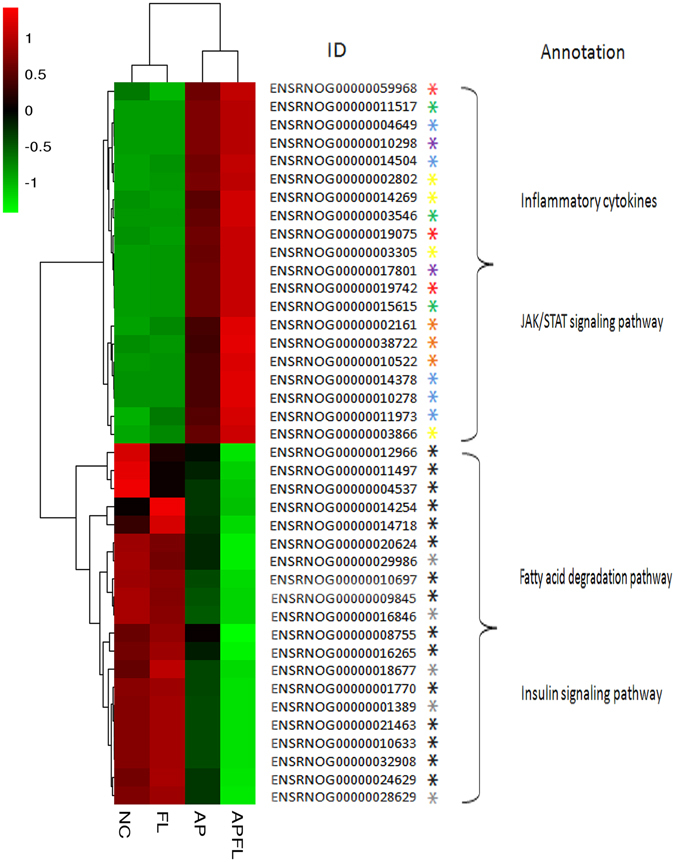
), JAK/STAT signaling pathway were marked with an asterisk (formula image), endoplasmic reticulum stress were marked with an asterisk (formula image), chemokine receptors were marked with an asterisk (formula image), tumor necrosis factor receptor superfamily were marked with an asterisk (formula image), interleukin were marked with an asterisk (formula image) and toll-like receptors were marked with an asterisk (formula image).
Figure 8
Figure 8
Quantitative RT-PCR validation of the selected dysregulated genes associated with fatty acid degradation. The expression levels of PPARα (a), ACSL1 (b), CPT1A (c), EHHADH (d), ACAA1A (e), ACADM (f), ACADSB (g), ALDH1B1 (h) and HADH (i) in NC, AP, FL and APFL were validated using qRT-PCR. The bar graph shows the expression of each gene in AP, FL, APFL relative to the average expression levels in NC. All error bars indicated S.D. *P < 0.05 vs NC, **P < 0.01 vs NC, # P < 0.05 vs FL.
Figure 9
Figure 9
Linear regression analysis of fold change data between qRT-PCR and RNA-seq. Black dots represent log2 transformed fold change values of a single gene in APFL sample obtained from qRT-PCR (X-axis) and RNA-seq analysis (Y-axis). R: correlation coefficient.
Figure 10
Figure 10
The schematic diagram of fatty liver aggravates pancreatitis. Fatty liver may aggravate pancreatitis by affecting lipid metabolism. The disorders of fatty acids degradation pathway and PPARα signaling pathway are involved in the course of APFL. Fatty liver may inhibit these two pathways to aggravate lipid metabolism disorder, which may further aggravate pancreatitis.

Similar articles

Cited by

References

    1. Rakonczay Z, Jr., Hegyi P, Takács T, McCarroll J, Saluja AK. The role of NF-kappaB activation in the pathogenesis of acute pancreatitis. Gut. 2008;57:259–267. doi: 10.1136/gut.2007.124115. - DOI - PubMed
    1. Morgan DE. Imaging of acute pancreatitis and its complications. Clin. Gastroenterol. Hepatol. 2008;6:1077–1085. doi: 10.1016/j.cgh.2008.07.012. - DOI - PubMed
    1. Wu BU. Prognosis in acute pancreatitis. C.M.A.J. 2011;183:673–677. - PMC - PubMed
    1. De-Madaria E, et al. Update of the Atlanta Classification of severity of acute pancreatitis: should a moderate category be included? Pancreatology. 2010;10:613–619. doi: 10.1159/000308795. - DOI - PubMed
    1. Maleth J, et al. Alcohol disrupts levels and function of the cystic fibrosis transmembrane conductance regulator to promote development of pancreatitis. Gastroenterology. 2015;148:427–439. doi: 10.1053/j.gastro.2014.11.002. - DOI - PMC - PubMed

Publication types

MeSH terms