. 2017 Apr 7;7(1):744.
doi: 10.1038/s41598-017-00861-x.

Enhanced interstitial fluid drainage in the hippocampus of spontaneously hypertensive rats

Affiliations

Enhanced interstitial fluid drainage in the hippocampus of spontaneously hypertensive rats

Beatrice Bedussi et al. Sci Rep. .

Abstract

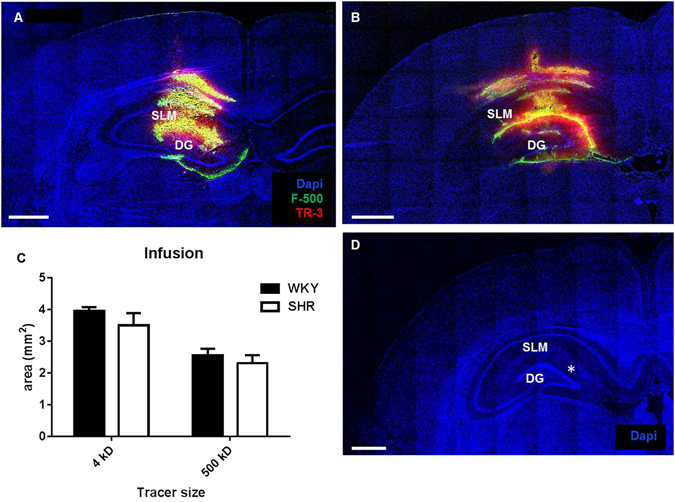
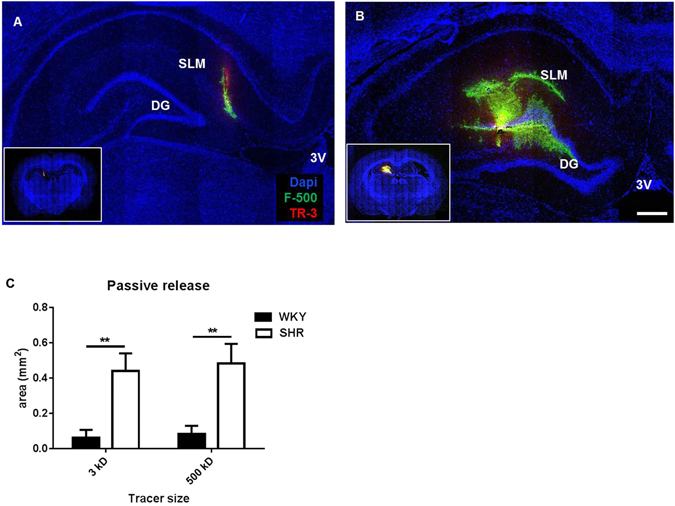
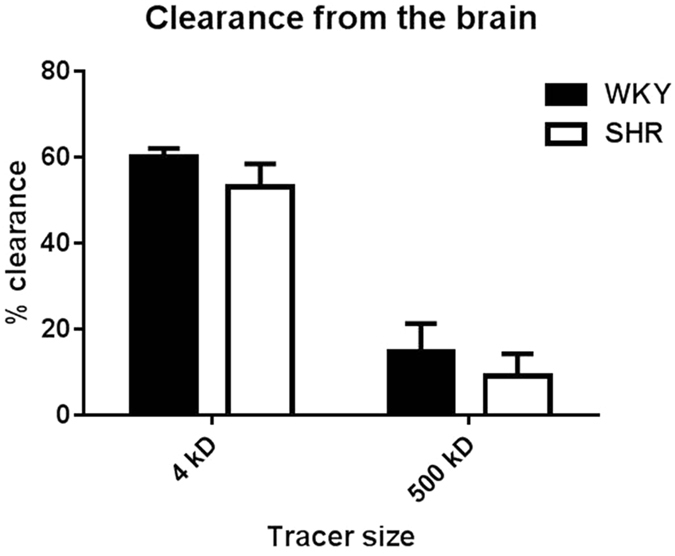
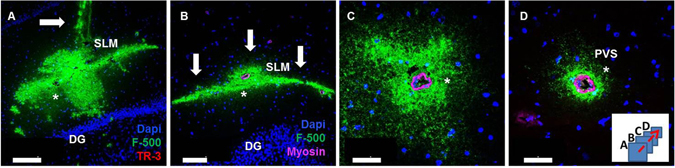
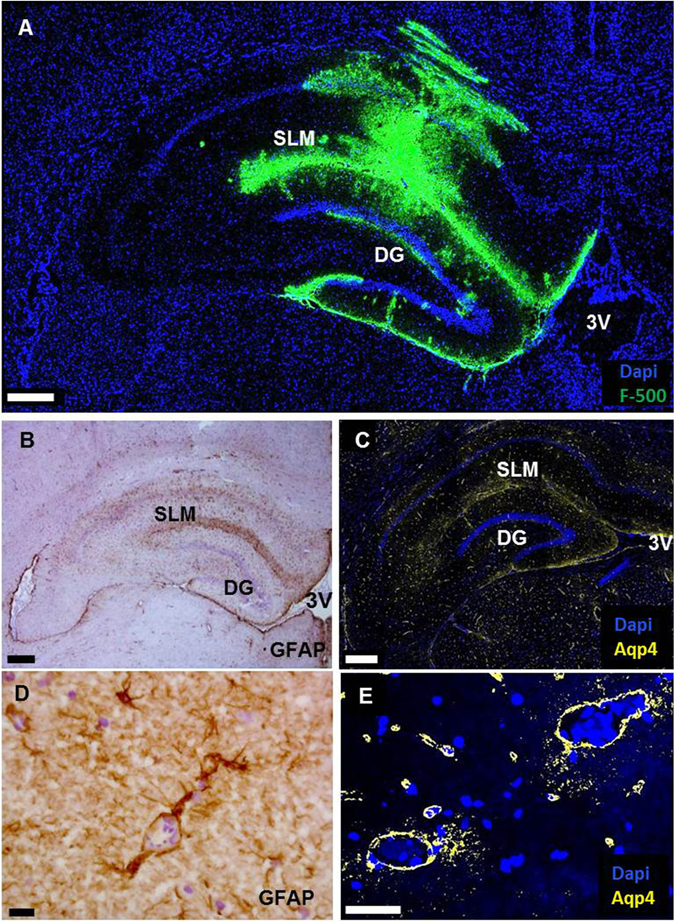
Hypertension is associated with cognitive decline and various forms of dementia, including Alzheimer's disease. In animal models of hypertension, many of Alzheimer's disease characteristics are recapitulated, including brain atrophy, cognitive decline, amyloid β accumulation and blood brain barrier dysfunction. Removal of amyloid β and other waste products depends in part on clearance via the brain interstitial fluid (ISF). Here we studied the impact of hypertension on ISF drainage, using spontaneously hypertensive rats (SHR) and normotensive Wistar Kyoto rats (WKY). At 8 months, high (500 kD) and low (3 kD) fluorescent molecular weight tracers released passively into the hippocampus showed a drastically enhanced spreading in SHR. Tracer spreading was inhomogeneous, with accumulation at ISF-CSF borders, around arteries, and towards the stratum lacunosum moleculare. These locations stained positively for the astrocyte marker GFAP, and aquaporin 4. Despite enhanced dispersion, clearance of tracers was not affected in SHR. In conclusion, these data indicate enhanced bulk flow of ISF in the hippocampus of hypertensive rats. ISF drains along astrocytes towards the cerebrospinal fluid compartment, which leads to sieving of high molecular weight solutes. Sieving may lead to a local increase in the concentration of waste products and potentially promotes the aggregation of amyloid β.


Conflict of interest statement

The authors declare that they have no competing interests.

Figures

Figure 1
Figure 1
Distribution of fluorescent tracers after infusion into the hippocampus. Panel A and B show coronal slices of WKY (left) and SHR (right) hippocampus at the infusion level. We did not observe a difference in the distribution area of either the low or high molecular weight tracer between WKY (N = 6) and SHR (n = 7). Mean data ± SEM are shown in panel C. In panel D the expected infusion site (*) is shown, based on the stereotactic coordinates for the rat brain. Scale bar 1 mm.
Figure 2
Figure 2
Distribution of tracers after passive release into the hippocampus. Panel A and B show representative coronal sections of WKY (left) and SHR (right) hippocampus at the level of needle insertion. Inserts show the overview of the whole sections. Panel C shows the quantification of the distribution area. Data are mean ± SEM. **Indicates P ≤ 0.001. WKY = 8 SHR = 6. Scale bar 1 mm.
Figure 3
Figure 3
Clearance of tracers from the hippocampus. Clearance was calculated as the amount of tracer removed from the brain as percentage of the initially injected quantity. There was no difference in clearance for both the low and high molecular weight tracer in WKY as compared to SHR. Clearance was larger for the small tracer (3 kD) as compared to the large tracer (500 kD; P < 0.00001). WKY = 6 SHR = 6. Data are mean ± SEM.
Figure 4
Figure 4
Tracer spreading within the hippocampus. Sequential sections of a SHR from the injection site (panel A; arrow indicates needle track) moving towards the caudal side of the brain (panels B–D). Tracer (500 kD) is shown in green. Panel B: 0.75 mm caudal from infusion area. Tracer spread along the SLM (arrows) and embedded arteries. Panel C: 1 mm from the infusion area, tracer co-localized with an artery. Panel D: 1.25 mm from the infusion area, stronger co-localization with the same artery. Dentate gyrus (DG); Stratum Lacunosum Molecolare (SLM); Paravascular Space (PVS). Stars indicate the same artery in the different panels. Blue: nuclear stain, magenta: smooth muscle myosin heavy chain, identifying the arterial nature of these vessels. Scale bar in A = 200 μm, B = 100 μm, C–D = 50 μm.
Figure 5
Figure 5
Co-localization of tracer accumulation with GFAP and aquaporin 4 staining. Panel A: High molecular weight tracer (green) distribution after infusion in the hippocampus of a WKY. Tracer accumulates along the stratum lacunosum molecolare (SLM) and at the boundaries of the hippocampus. Panel B: Expression of the astrocyte marker GFAP. Panel C: Expression of aquaporin 4. Tracer, GFAP and Aqp4 colocalize at the suprapyramidal and infrapyramidal blades of the dentate gyrus and the ependyma layer at the third ventricle. DG: dentate gyrus. 3 V: third ventricle. Scale bar in A–C 400 µm. Panels D and E show a close up of the vessels present at the SLM region. Both GFAP and Aqp4 are expressed around vessels. Scale bar in D = 15 μm, E = 50 μm.

References

    1. Zlokovic BV. Neurovascular pathways to neurodegeneration in Alzheimer’s disease and other disorders. Nat Rev Neurosci. 2011;12:723–738. - PMC - PubMed
    1. Iadecola C, Davisson RL. Hypertension and cerebrovascular dysfunction. Cell Metab. 2008;7:476–484. doi: 10.1016/j.cmet.2008.03.010. - DOI - PMC - PubMed
    1. Feldstein CA. Association between chronic blood pressure changes and development of Alzheimer’s disease. J Alzheimers Dis. 2012;32:753–763. - PubMed
    1. Peters R, et al. Incident dementia and blood pressure lowering in the Hypertension in the Very Elderly Trial cognitive function assessment (HYVET-COG): a double-blind, placebo controlled trial. Lancet Neurol. 2008;7:683–689. doi: 10.1016/S1474-4422(08)70143-1. - DOI - PubMed
    1. Anderson C, et al. Renin-angiotensin system blockade and cognitive function in patients at high risk of cardiovascular disease: analysis of data from the ONTARGET and TRANSCEND studies. Lancet Neurol. 2011;10:43–53. doi: 10.1016/S1474-4422(10)70250-7. - DOI - PubMed

Publication types