

Brain structure and verbal function across adulthood while controlling for cerebrovascular risks
- PMID: 28390167
- PMCID: PMC5632576
- DOI: 10.1002/hbm.23602
Brain structure and verbal function across adulthood while controlling for cerebrovascular risks
Abstract
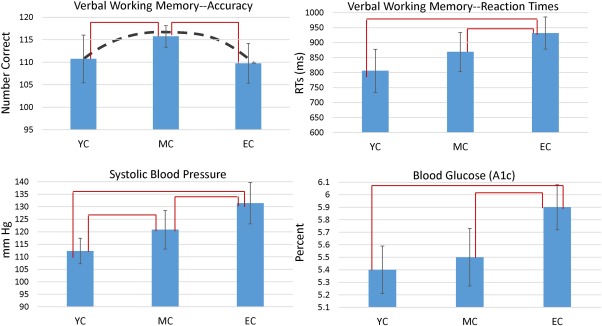
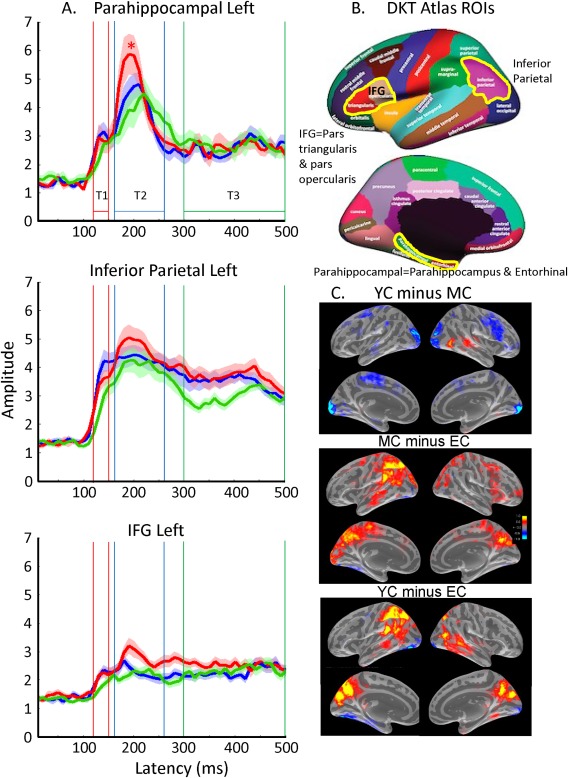
The development and decline of brain structure and function throughout adulthood is a complex issue, with cognitive aging trajectories influenced by a host of factors including cerebrovascular risk. Neuroimaging studies of age-related cognitive decline typically reveal a linear decrease in gray matter (GM) volume/density in frontal regions across adulthood. However, white matter (WM) tracts mature later than GM, particularly in regions necessary for executive functions and memory. Therefore, it was predicted that a middle-aged group (MC: 35-45 years) would perform best on a verbal working memory task and reveal greater regional WM integrity, compared with both young (YC: 18-25 years) and elder groups (EC: 60+ years). Diffusion tensor imaging (DTI) and magnetoencephalography (MEG) were obtained from 80 healthy participants. Objective measures of cerebrovascular risk and cognition were also obtained. As predicted, MC revealed best verbal working memory accuracy overall indicating some maturation of brain function between YC and MC. However, contrary to the prediction fractional anisotropy values (FA), a measure of WM integrity, were not greater in MC (i.e., there were no significant differences in FA between YC and MC but both groups showed greater FA than EC). An overall multivariate model for MEG ROIs showed greater peak amplitudes for MC and YC, compared with EC. Subclinical cerebrovascular risk factors (systolic blood pressure and blood glucose) were negatively associated with FA in frontal callosal, limbic, and thalamic radiation regions which correlated with executive dysfunction and slower processing speed, suggesting their contribution to age-related cognitive decline. Hum Brain Mapp 38:3472-3490, 2017. © 2017 Wiley Periodicals, Inc.
Keywords: DTI; MEG; blood pressure; blood sugar; cerebrovascular risk; development; fractional anisotropy; normal aging; verbal memory; working memory.
© 2017 Wiley Periodicals, Inc.
Figures


References
-
- Aine CJ, Adair JC, Knoefel JE, Sanfratello L, Staphen, JM (2014a). Cognitive decline associated with aging, Alzheimer's disease and cerebrovascular risk: Advantages of dynamic imaging with MEG In: Supek S, Aine CJ, editors. Magnetoencephalography: From Signals To Dynamic Cortical Networks. New York: Springer, pp. 657–676.
-
- Bartzokis G, Beckson M, Lu PH, Nuechterlein KH, Edwards N, Mintz J (2001): Age‐related changes in frontal and temporal lobe volumes in men. Arch Gen Psychiatry 58:461. - PubMed
Grants and funding
- Mind Research Network
- R01 EB006841/EB/NIBIB NIH HHS/United States
- 2P20GM103472/GM/NIGMS NIH HHS/United States
- UL1 TR001449/TR/NCATS NIH HHS/United States
- R01AG029495/AG/NIA NIH HHS/United States
- R01 AG029495/AG/NIA NIH HHS/United States
- UL1 TR000041/TR/NCATS NIH HHS/United States
- The National Center for Research Resources and the National Center for Advancing Translational Sciences of the National Institutes of Health
- Radiology Department at UNM SOM
- R01 EB020407/EB/NIBIB NIH HHS/United States
- P20 GM103472/GM/NIGMS NIH HHS/United States
- 1UL1TR000041/UNM Health Sciences Center
LinkOut - more resources
Full Text Sources
Other Literature Sources
Research Materials
