. 2017 Sep;18(7):1024-1035.
doi: 10.1111/mpp.12559. Epub 2017 May 23.

Involvement of salicylic acid, ethylene and jasmonic acid signalling pathways in the susceptibility of tomato to Fusarium oxysporum

Affiliations

Involvement of salicylic acid, ethylene and jasmonic acid signalling pathways in the susceptibility of tomato to Fusarium oxysporum

Xiaotang Di et al. Mol Plant Pathol. 2017 Sep.

Abstract

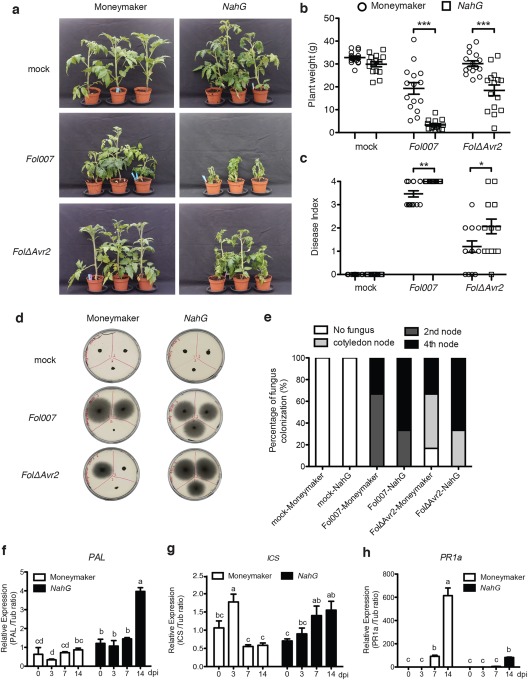
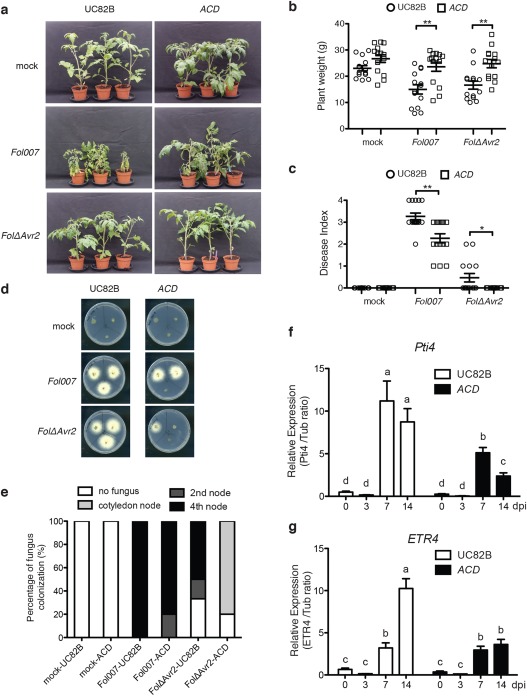
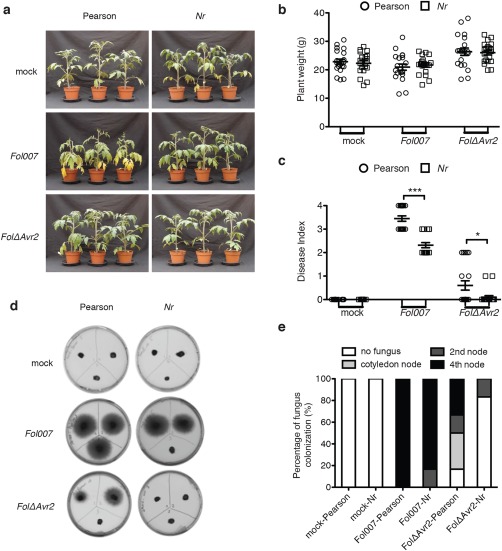
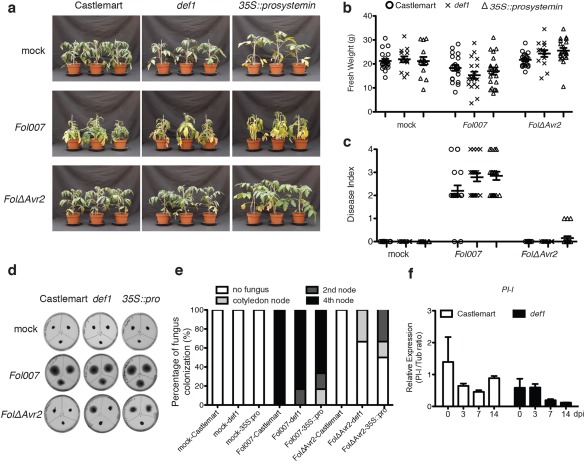
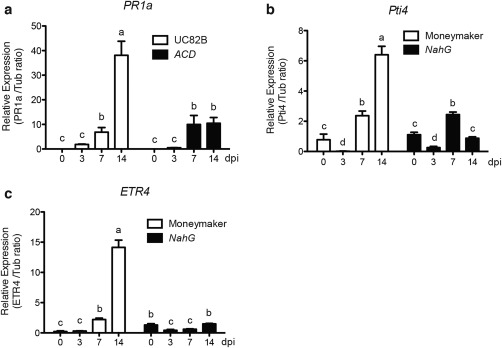
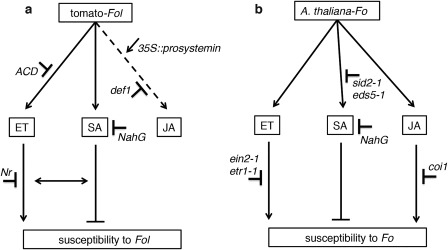
Phytohormones, such as salicylic acid (SA), ethylene (ET) and jasmonic acid (JA), play key roles in plant defence following pathogen attack. The involvement of these hormones in susceptibility following Fusarium oxysporum (Fo) infection has mostly been studied in Arabidopsis thaliana. However, Fo causes vascular wilt disease in a broad range of crops, including tomato (Solanum lycopersicum). Surprisingly little is known about the involvement of these phytohormones in the susceptibility of tomato towards Fo f. sp. lycopersici (Fol). Here, we investigate their involvement by the analysis of the expression of ET, JA and SA marker genes following Fol infection, and by bioassays of tomato mutants affected in either hormone production or perception. Fol inoculation triggered the expression of SA and ET marker genes, showing the activation of these pathways. NahG tomato, in which SA is degraded, became hypersusceptible to Fol infection and showed stronger disease symptoms than wild-type. In contrast, ACD and Never ripe (Nr) mutants, in which ET biosynthesis and perception, respectively, are impaired, showed decreased disease symptoms and reduced fungal colonization on infection. The susceptibility of the def1 tomato mutant, and a prosystemin over-expressing line, in which JA signalling is compromised or constitutively activated, respectively, was unaltered. Our results show that SA is a negative and ET a positive regulator of Fol susceptibility. The SA and ET signalling pathways appear to act synergistically, as an intact ET pathway is required for the induction of an SA marker gene, and vice versa.

Keywords: ET; Fusarium oxysporum; JA; SA; susceptibility; tomato.


Figures

Figure 1
Figure 1
Impaired salicylic acid (SA) signalling enhances Fusarium oxysporum f. sp. lycopersici (Fol) disease symptom development in tomato. (a) Three‐week‐old wild‐type Moneymaker and NahG tomato plants inoculated with water (mock), Fol007 or FolΔAvr2 at 21 days post‐infection (dpi). Disease development was scored by measuring the fresh plant weight (b) and determining the disease index (range, 0–4) (c) of 20 plants per treatment/genotype combination. Circles and squares indicate Moneymaker and NahG plants, respectively. Plant weight was subjected to a pairwise comparison with a Student's t‐test, whereas the disease index was analysed by a non‐parametric Mann–Whitney U‐test (*P < 0.05; **P < 0.01; ***P < 0.001). The bioassay was repeated three times with similar results. (d) Representative stem sections taken from the cotyledon node (top left), second node (top right) and fourth node (bottom) of individual treated plants (n = 6) after incubation for 5 days on potato dextrose agar (PDA) plates. (e) Percentage of infected slices showing fungal outgrowth. Fungal progression in the stem was expressed as the infected percentage of all stem pieces. The experiment was performed twice with similar results. Transcription patterns of phenylalanine ammonia‐lyase (PAL) (f), isochorismate (ICS) (g) and pathogenesis‐related 1a (PR1a) (h) in Fol007‐inoculated wild‐type Moneymaker and NahG plants at 0, 3, 7 and 14 dpi. Gene expression levels relative to the internal control tubulin genes were quantified by quantitative polymerase chain reaction (qPCR). The data are expressed as the mean ± standard deviation (SD). Three biological replicates for each line per time point were analysed. The different letters show significant difference at P < 0.05 as determined by Duncan's multiple‐range test. The experiment was performed twice with similar results.
Figure 2
Figure 2
Impaired ethylene (ET) biosynthesis and production in tomato reduces disease susceptibility to Fusarium oxysporum f. sp. lycopersici (Fol). (a) Three‐week‐old wild‐type UC82B and ACD tomato plants inoculated with water (mock), Fol007 or FolΔAvr2 at 21 days post‐infection (dpi). Disease development was scored by measuring the fresh weight (b) and disease index (range, 0–4) (c) of 20 plants per treatment/genotype combination. Circles and squares indicate UC82B and ACD plants, respectively. Plant weight was subjected to a pairwise comparison using a Student's t‐test, whereas the disease index was analysed by a non‐parametric Mann–Whitney U‐test (*P < 0.05; **P < 0.01; ***P < 0.001). The bioassay was repeated three times with similar results. (d) Representative stem sections taken from the cotyledon node (top left), second node (top right) and fourth node (bottom) of individual treated plants (n = 6) after incubation for 5 days on potato dextrose agar (PDA) plates. (e) Colonization is expressed as the percentage of infected slices of all stem pieces (n = 6). The experiment was repeated twice with similar results. (f, g) Transcription patterns of ET‐regulated marker genes Pti4 and ETR4 in Fol007‐inoculated UC82B and ACD at 0, 3, 7 and 14 dpi. Gene expression levels relative to the internal control tubulin genes were quantified by quantitative polymerase chain reaction (qPCR). The data are expressed as the mean ± standard deviation (SD). Three biological replicates for each line per time point were analysed. The different letters show the significant difference at P < 0.05 as determined by Duncan's multiple‐range test. The experiment was performed twice with similar results.
Figure 3
Figure 3
Ethylene (ET) perception is required for Fusarium oxysporum f. sp. lycopersici (Fol) disease symptom development in tomato. (a) Three‐week‐old wild‐type and Never ripe (Nr) Pearson tomato plants inoculated with water (mock), Fol007 or FolΔAvr2 at 21 days post‐infection (dpi). Disease symptoms were scored by measuring the fresh weight (b) and disease index (range, 0–4) (c) of 20 plants per treatment/genotype combination. Circle and square indicate Pearson plant and Nr plant, respectively. Plant weight was subjected to a pairwise comparison using a Student's t‐test, whereas the disease index was analysed by a non‐parametric Mann–Whitney U‐test (*P < 0.05; **P < 0.01; ***P < 0.001). The bioassay was repeated three times with similar results. (d) Representative stem sections taken from the cotyledon node (top left), second node (top right) and fourth node (bottom) of individual treated plants (n = 6) after incubation for 5 days on potato dextrose agar (PDA) plates. (e) Colonization is expressed as the percentage of infected slices of all stem pieces (n = 6). The experiment was repeated twice with similar results.
Figure 4
Figure 4
Perturbation of jasmonic acid (JA) signalling has no detectable effect on plant susceptibility. (a) Three‐week‐old wild‐type Castlemart, def1 and 35S::prosystemin tomato plants inoculated with water (mock), Fol007 or FolΔAvr2 at 21 days post‐infection (dpi). Disease symptoms were scored by measuring the fresh weight (b) and disease index (range, 0–4) (c) of 20 plants per treatment/genotype combination. Circle, × and Δ indicate Castlemart, def1 and 35S::prosystemin, respectively. The bioassay was repeated three times with similar results. (d) Representative stem sections taken from the cotyledon node (top left), second node (top right) and fourth node (bottom) of individual treated plants (n = 6) after incubation for 5 days on potato dextrose agar (PDA) plates. (e) Colonization is expressed as the percentage of infected slices of all stem pieces (n = 6). The experiment was repeated twice with similar results. (f) Transcription patterns of proteinase inhibitor I (PI‐I) in Fol007‐inoculated wild‐type Castlemart and def1 at 0, 3, 7 and 14 dpi. Three biological replicates for each line were analysed. The data are expressed as the mean ± standard deviation (SD). The experiment was performed twice with similar results.
Figure 5
Figure 5
Time course of transcription patterns of salicylic acid (SA) and ethylene (ET) marker genes on Fusarium oxysporum f. sp. lycopersici (Fol) inoculation. (a) Expression of the SA marker gene pathogenesis‐related 1a (PR1a) in wild‐type UC82B and the transgenic ACD line at 0, 3, 7 and 14 days post‐infection (dpi). (b, c) Transcription patterns of the ET marker genes Pti4 and ETR4 in NahG and the Moneymaker progenitor at 0, 3, 7 and 14 dpi. Gene expression levels relative to the internal control tubulin genes were quantified by quantitative polymerase chain reaction (qPCR). The data are expressed as the mean ± standard deviation (SD). Three biological replicates for each line per time point were analysed. The different letters show the significant difference at P < 0.05 as determined by Duncan's multiple‐range test. The experiment was performed twice with similar results.
Figure 6
Figure 6
Proposed models for the involvement of jasmonic acid (JA), salicylic acid (SA) and ethylene (ET) signalling in tomato (a) and Arabidopsis (b) on Fusarium oxysporum (Fo) infection. Compromised ET biosynthesis and perception reduce disease susceptibility, whereas compromised SA signalling promotes hypersusceptibility to Fo f. sp. lycopersici (Fol) infection in tomato. The SA and ET pathways act synergistically, in that induction of one pathway requires the intactness of the other. Although, in Arabidopsis, the JA pathway is required for disease susceptibility, it is not in tomato. By convention, the arrowhead implies positive regulation (stimulation) and the T‐bar implies negative regulation.

References

    1. Agrios, G.N. (2005) Plant Pathology. St. Louis, MO: Academic Press.
    1. Anderson, J.P. , Badruzsaufari, E. , Schenk, P.M. , Manners, J.M. , Desmond, O.J. , Ehlert, C. , Maclean, D.J. , Ebert, P.R. and Kazan, K. (2004) Antagonistic interaction between abscisic acid and jasmonate–ethylene signaling pathways modulates defense gene expression and disease resistance in Arabidopsis. Plant Cell, 16, 3460–3479. - PMC - PubMed
    1. Bari, R. and Jones, J.D.G. (2009) Role of plant hormones in plant defence responses. Plant Mol. Biol. 69, 473–488. - PubMed
    1. Berrocal‐Lobo, M. and Molina, A. (2004) Ethylene response factor 1 mediates Arabidopsis resistance to the soilborne fungus Fusarium oxysporum . Mol. Plant–Microbe Interact. 17, 763–770. - PubMed
    1. Berrocal‐Lobo, M. and Molina, A. (2008) Arabidopsis defense response against Fusarium oxysporum . Trends Plant Sci. 13, 145–150. - PubMed

Publication types

LinkOut - more resources