Meta-Analysis
. 2017 Aug:12:582-599.
doi: 10.1016/j.redox.2017.03.024. Epub 2017 Mar 28.

Classifying oxidative stress by F2-isoprostane levels across human diseases: A meta-analysis

Affiliations
Meta-Analysis

Classifying oxidative stress by F2-isoprostane levels across human diseases: A meta-analysis

Thomas J van 't Erve et al. Redox Biol. 2017 Aug.

Abstract

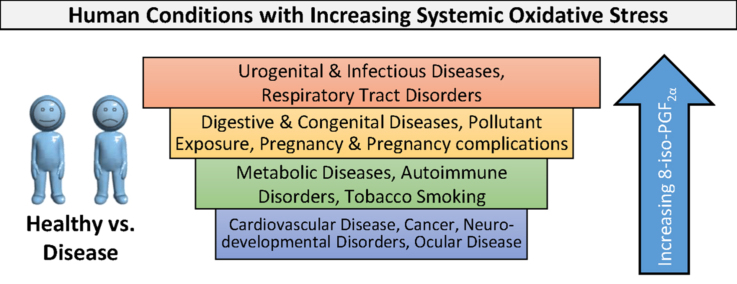
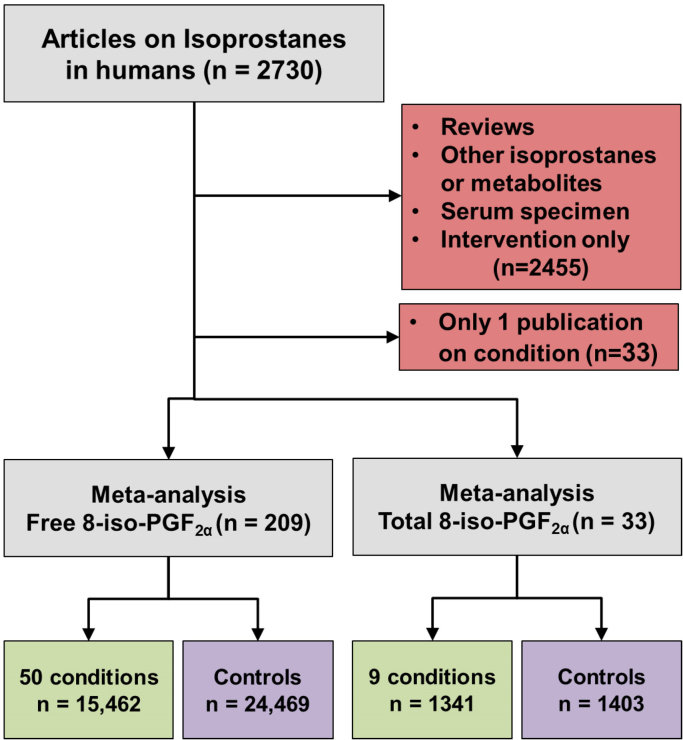
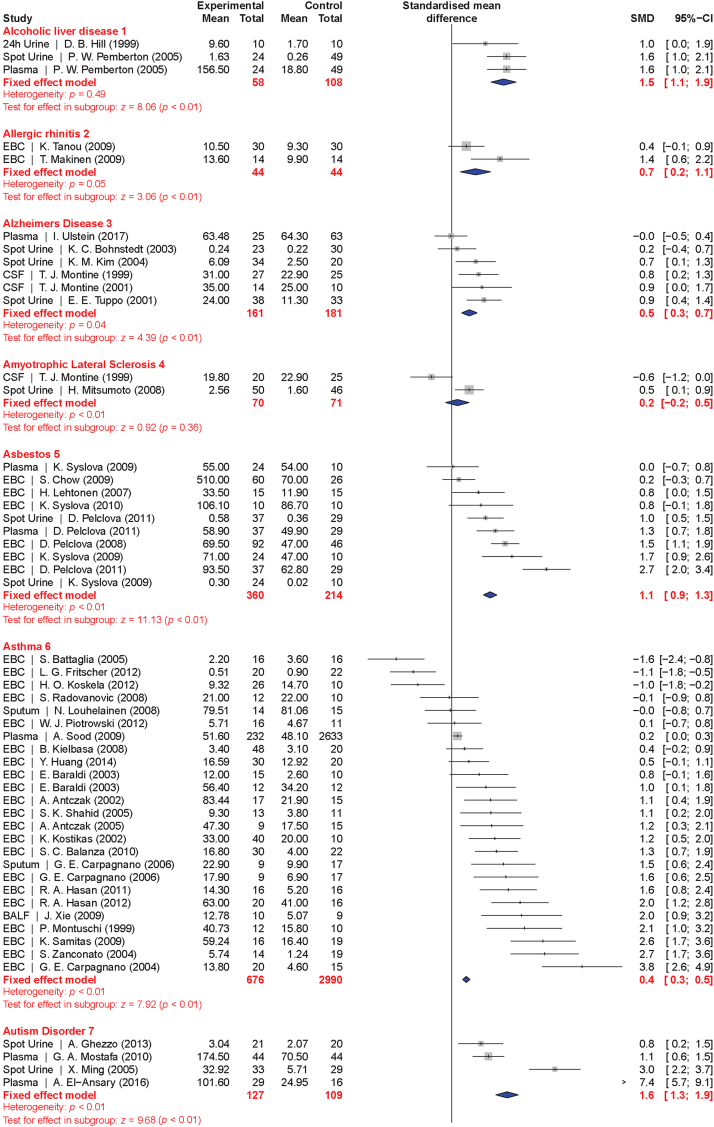
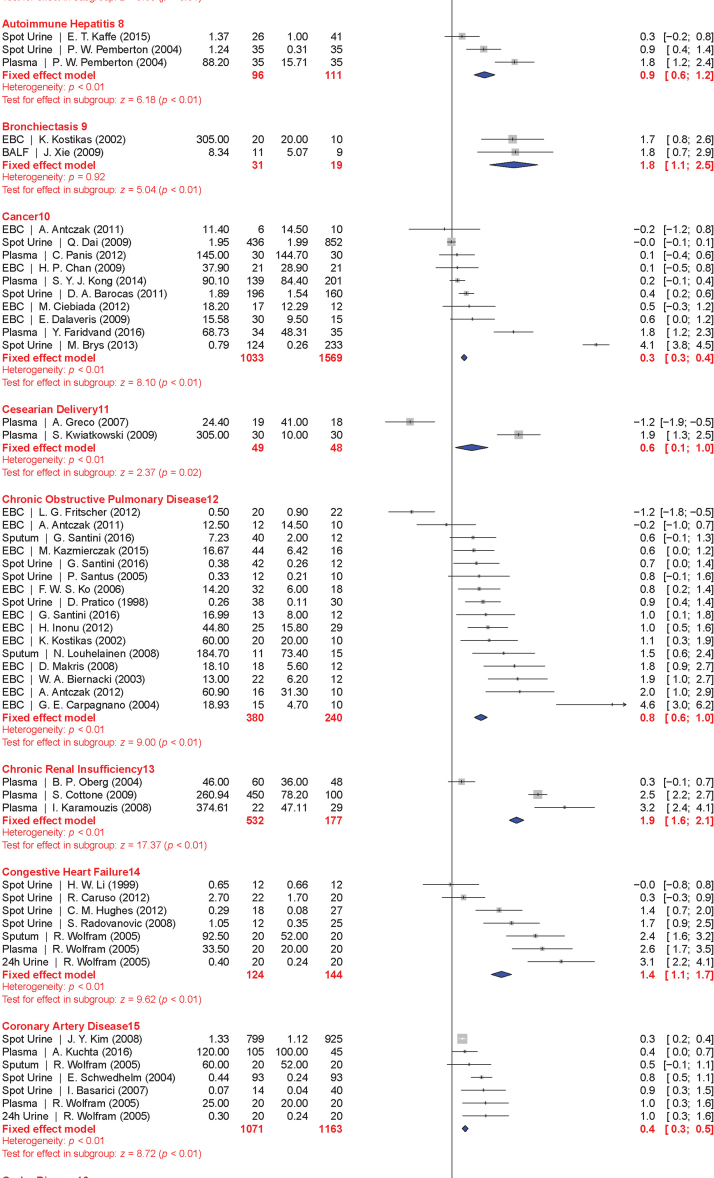
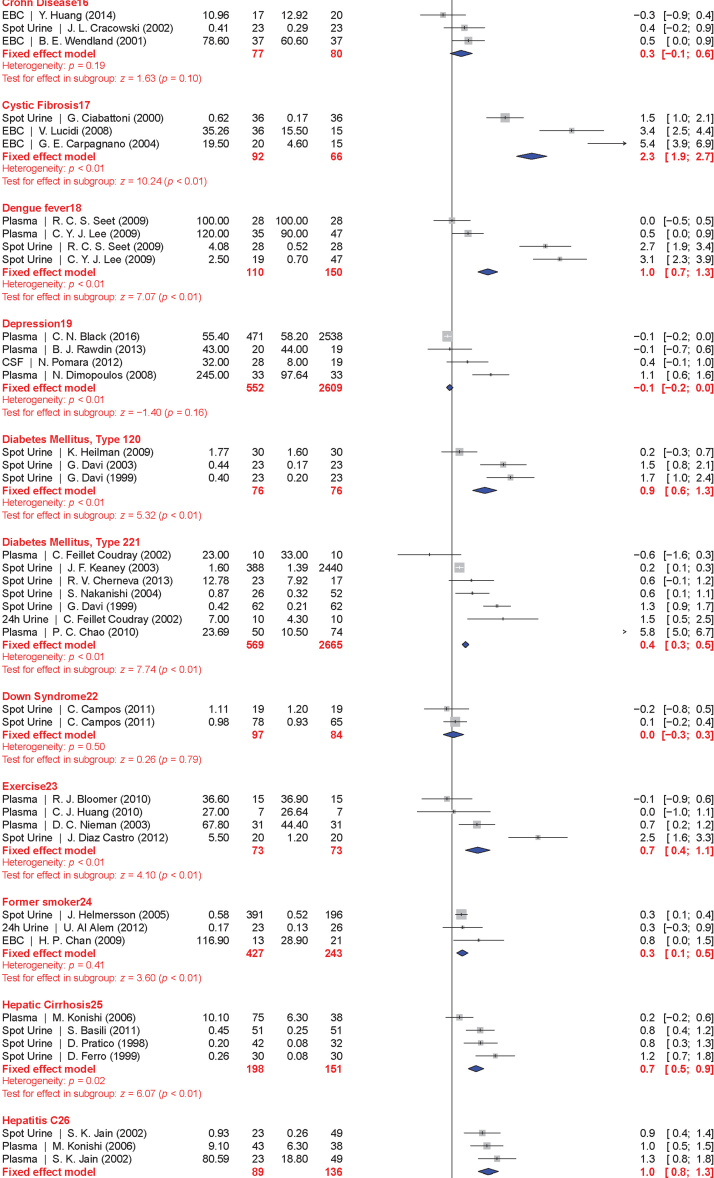
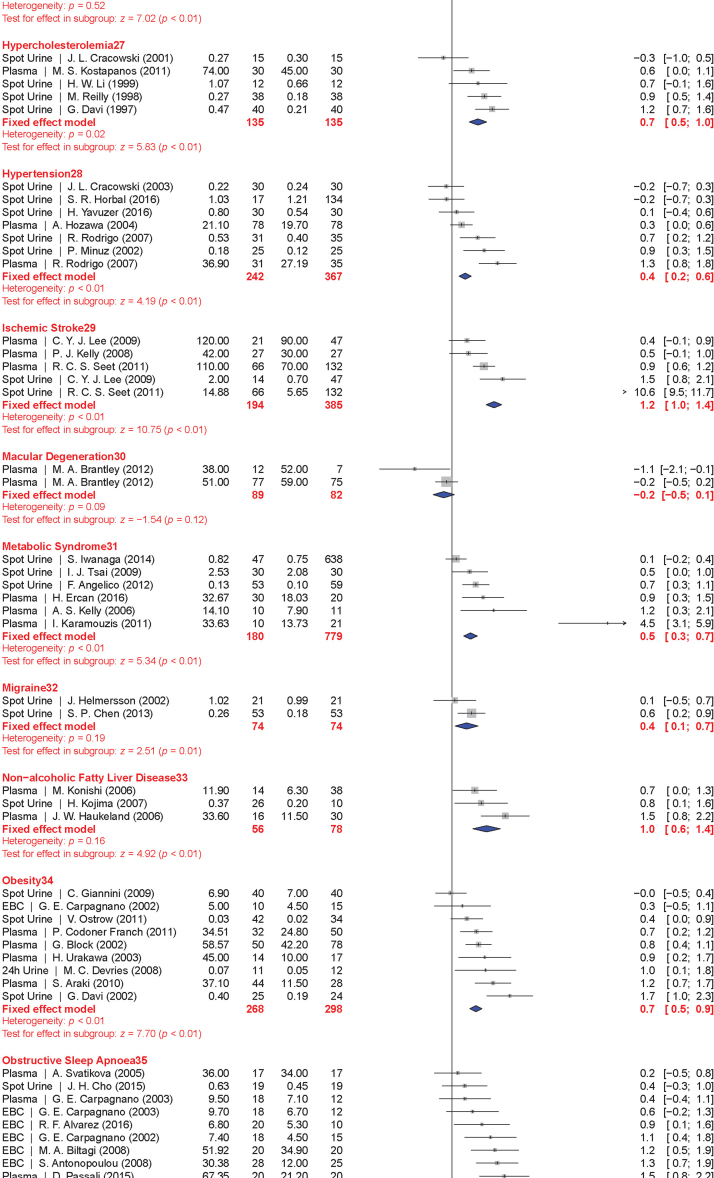
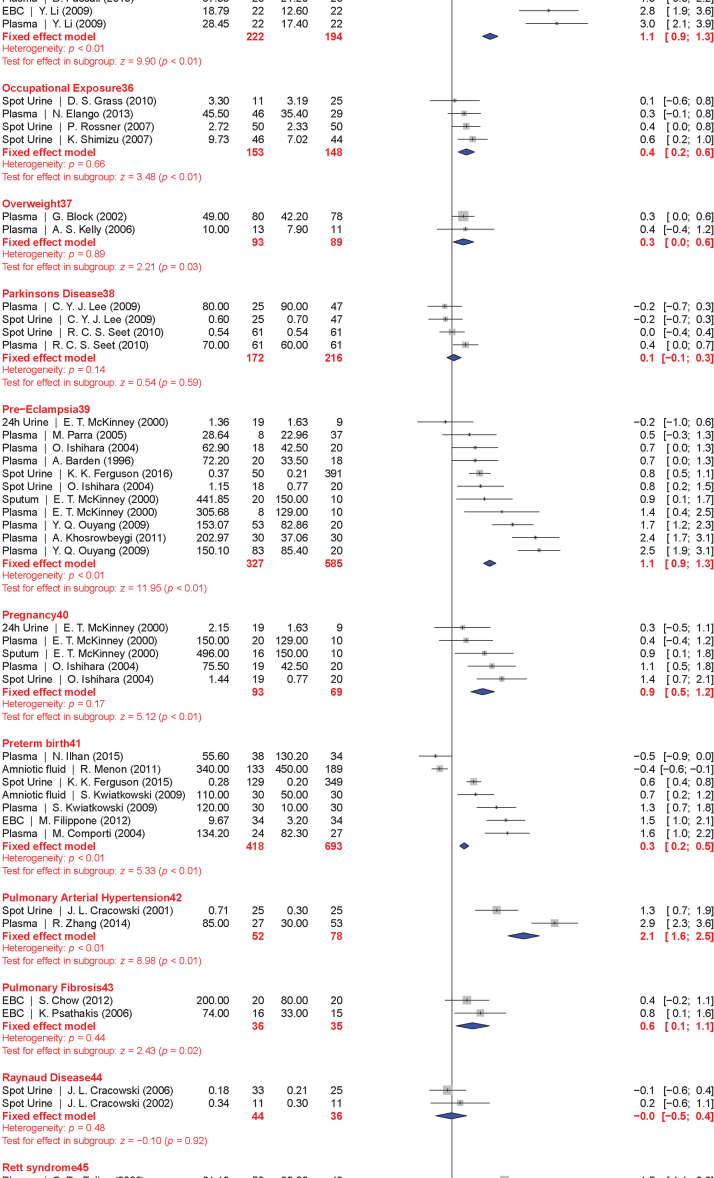
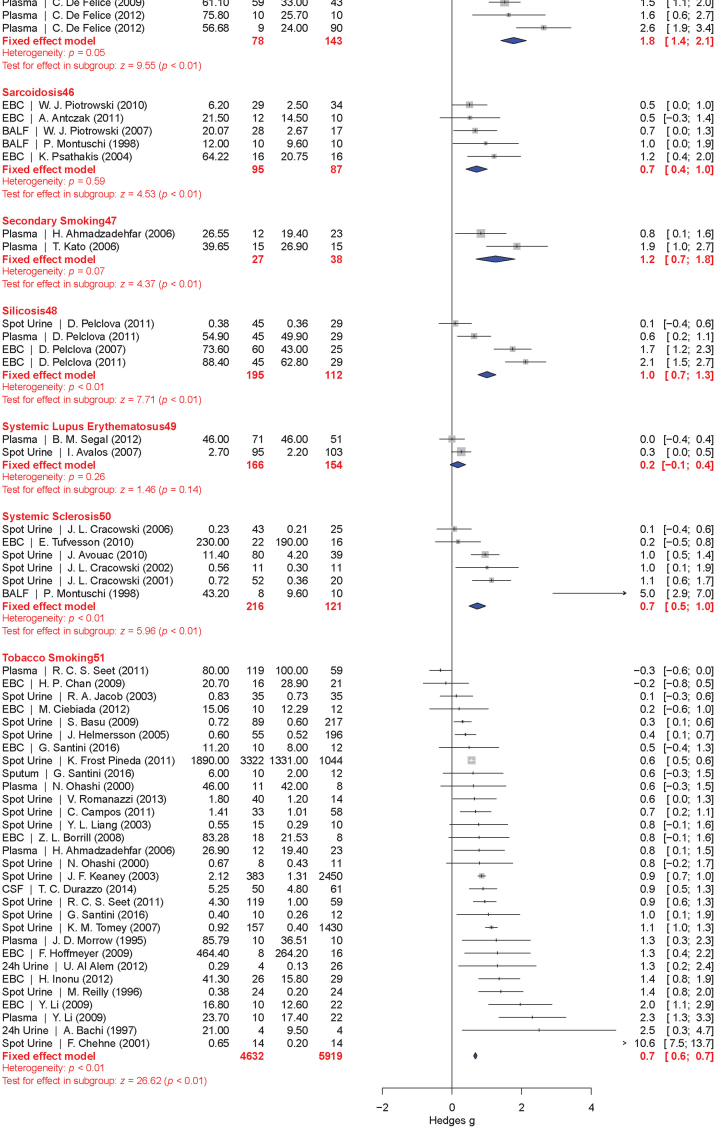
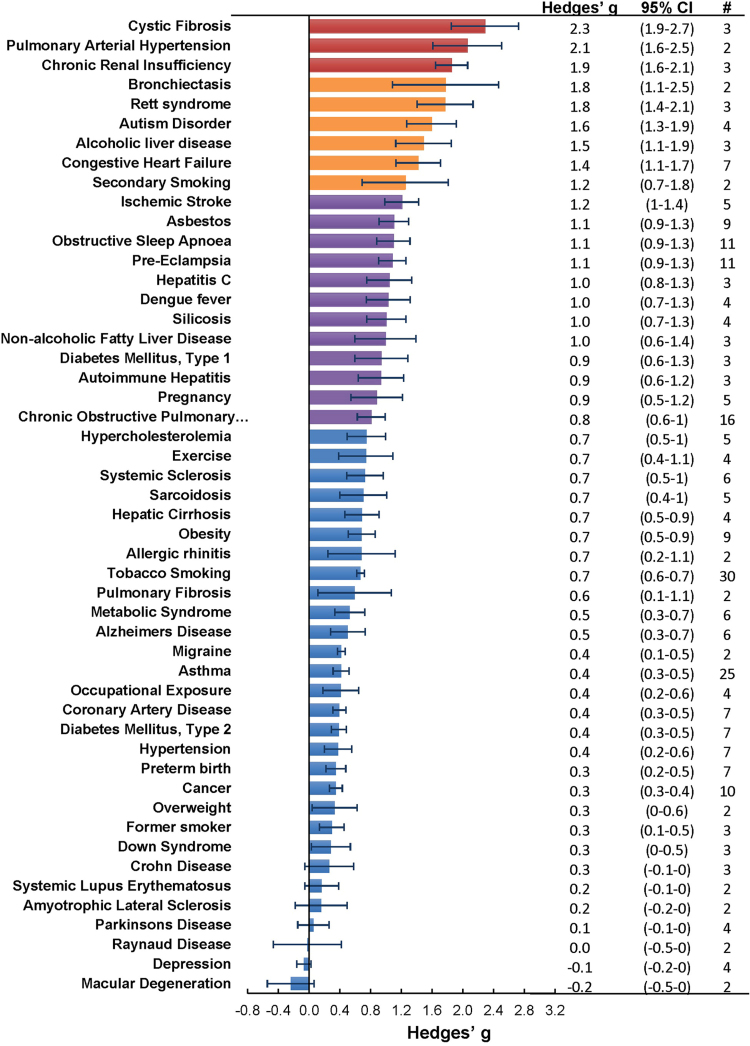
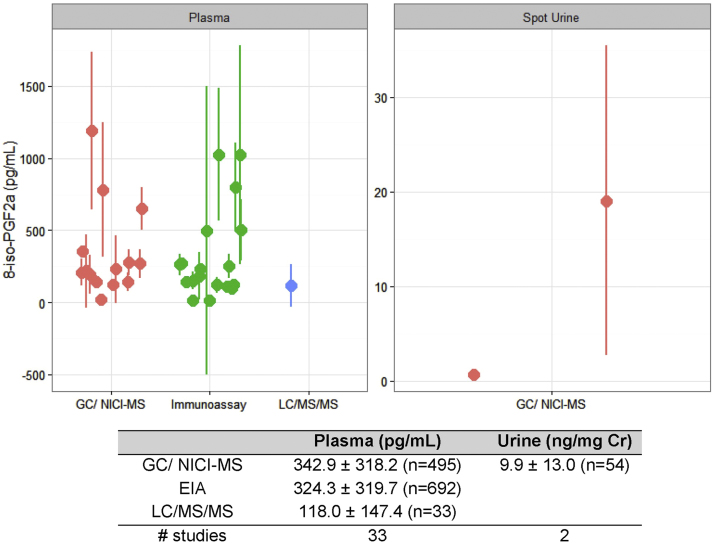
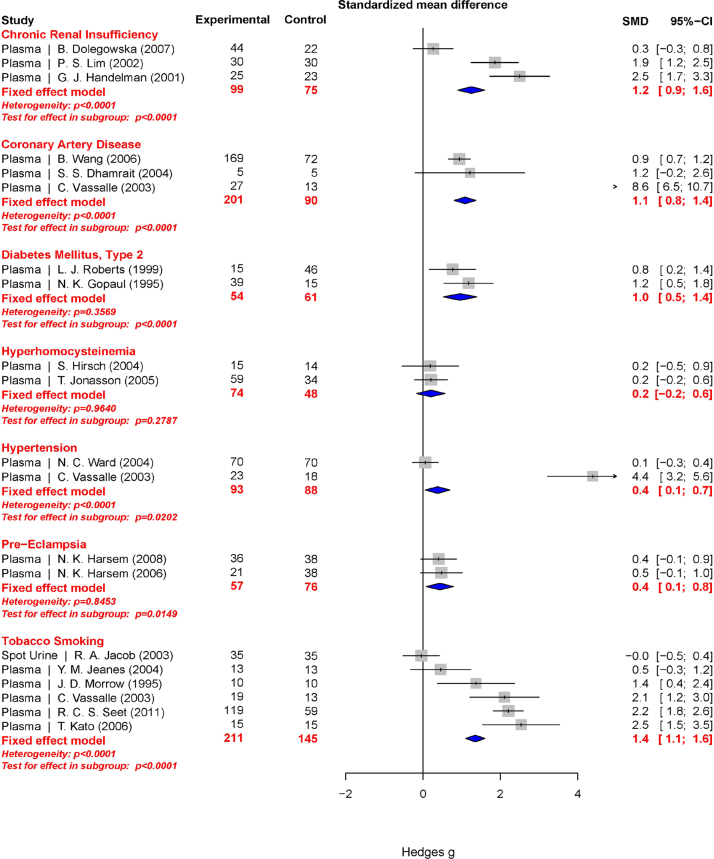
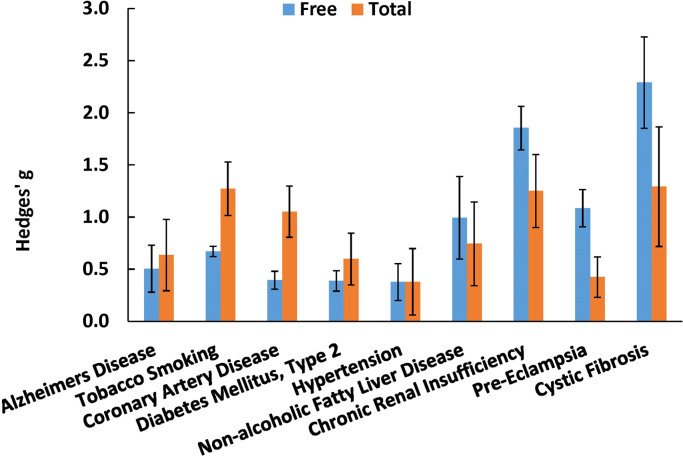
The notion that oxidative stress plays a role in virtually every human disease and environmental exposure has become ingrained in everyday knowledge. However, mounting evidence regarding the lack of specificity of biomarkers traditionally used as indicators of oxidative stress in human disease and exposures now necessitates re-evaluation. To prioritize these re-evaluations, published literature was comprehensively analyzed in a meta-analysis to quantitatively classify the levels of systemic oxidative damage across human disease and in response to environmental exposures. In this meta-analysis, the F2-isoprostane, 8-iso-PGF, was specifically chosen as the representative marker of oxidative damage. To combine published values across measurement methods and specimens, the standardized mean differences (Hedges' g) in 8-iso-PGF levels between affected and control populations were calculated. The meta-analysis resulted in a classification of oxidative damage levels as measured by 8-iso-PGF across 50 human health outcomes and exposures from 242 distinct publications. Relatively small increases in 8-iso-PGF levels (g<0.8) were found in the following conditions: hypertension (g=0.4), metabolic syndrome (g=0.5), asthma (g=0.4), and tobacco smoking (g=0.7). In contrast, large increases in 8-iso-PGF levels were observed in pathologies of the kidney, e.g., chronic renal insufficiency (g=1.9), obstructive sleep apnoea (g=1.1), and pre-eclampsia (g=1.1), as well as respiratory tract disorders, e.g., cystic fibrosis (g=2.3). In conclusion, we have established a quantitative classification for the level of 8-iso-PGF generation in different human pathologies and exposures based on a comprehensive meta-analysis of published data. This analysis provides knowledge on the true involvement of oxidative damage across human health outcomes as well as utilizes past research to prioritize those conditions requiring further scrutiny on the mechanisms of biomarker generation.

Keywords: F(2)-isoprostane; Meta-analysis; Oxidative damage; Oxidative stress; Ranking.


Figures

fx1
Graphical abstract
Fig. 1
Fig. 1
Flow diagram showing the process for inclusion and exclusion of publications into the meta-analysis. N in parentheses represents the number of publications in each step, whereas the end totals represent the sum of all individuals measured for free or total 8-iso-PGF.
Fig. 2
Fig. 2
Free 8-iso-PGF amounts in reported healthy individuals separated by analytical technique and specimen. Data in the graph and table show mean±standard deviation. The number in parentheses is the sum of individuals analyzed per group. The number of studies represents the unique number of publications per group.
Fig. 3
Fig. 3
Forest plots of all calculated standardized mean differences for free 8-iso-PGF subdivided by condition. The standardized mean difference is Hedges' g. Fixed-effects model results are plotted in the blue diamonds. These are calculated for each subgroup with inverse variance weighting of individual studies. DerSimonian-Laird estimators are used for the heterogeneity calculation. The test for effect in subgroup statistically determines whether the effect size is greater than 0. Number in the affected and control groups represents the number of people tested. Data for this figure was extracted from references , , , , , , , , , , , , , , , , , , , , , , , , , , , , , , , , , , , , , , , , , , , , , , , , , , , , , , , , , , , , , , , , , , , , , , , , , , , , , , , , , , , , , , , , , , , , , , , , , , , , , , , , , , , , , , , , , , , , , , , , , , , , , , , , , , , , , , , , , , , , , , , , , , , , , , , , , , , , , , , , , , , , , , , , , , , , , , , , , , , , , , , , , , , , , , , , , , , , , , , , , , , , , , , , , , , , , , , , , , , , , , , , , , , , , , , , (For interpretation of the references to color in this figure legend, the reader is referred to the web version of this article).
Fig. 3
Fig. 3
Forest plots of all calculated standardized mean differences for free 8-iso-PGF subdivided by condition. The standardized mean difference is Hedges' g. Fixed-effects model results are plotted in the blue diamonds. These are calculated for each subgroup with inverse variance weighting of individual studies. DerSimonian-Laird estimators are used for the heterogeneity calculation. The test for effect in subgroup statistically determines whether the effect size is greater than 0. Number in the affected and control groups represents the number of people tested. Data for this figure was extracted from references , , , , , , , , , , , , , , , , , , , , , , , , , , , , , , , , , , , , , , , , , , , , , , , , , , , , , , , , , , , , , , , , , , , , , , , , , , , , , , , , , , , , , , , , , , , , , , , , , , , , , , , , , , , , , , , , , , , , , , , , , , , , , , , , , , , , , , , , , , , , , , , , , , , , , , , , , , , , , , , , , , , , , , , , , , , , , , , , , , , , , , , , , , , , , , , , , , , , , , , , , , , , , , , , , , , , , , , , , , , , , , , , , , , , , , , , (For interpretation of the references to color in this figure legend, the reader is referred to the web version of this article).
Fig. 4
Fig. 4
Ranking of conditions where free 8-iso-PGF is generated in significantly greater amounts compared to the control population. Hedges' g ±95% confidence intervals calculated from the fixed effects model plotted as a rank order. The # column represents the number of studies per condition.
Fig. 5
Fig. 5
Total 8-iso-PGF amounts in reported healthy individuals separated by analytical technique and specimen. Data in the graph and table show mean±standard deviation. The number in parentheses is the sum of individuals analyzed per group. The number of studies represents the unique number of publications per group.
Fig. 6
Fig. 6
Forest plots of all calculated standardized mean differences for total 8-iso-PGF subdivided by condition. The standardized mean difference is Hedges’ g. Fixed-effects model results are plotted in the blue diamonds. These are calculated for each subgroup with inverse variance weighting of individual studies. DerSimonian-Laird estimators are used for the heterogeneity calculation. The test for effect in subgroup statistically determines whether the effect size is greater than 0. The number in the affected and control groups represents the number of people tested. Data for this figure was extracted from references , , , , , , , , , , , , , , , , , , , , , , , , , , , , , , , , , , , , , , , , , , , , , , , , , , , , , , , , , , , , , , , , , , , , , , , , , , , , , , , , , , , , , , , , , , , , , , , , , , , , , , , , , , , , , , , , , , , , , , , , , , , , , , , , , , , , , , , , , , , , , , , , , , , , , , , , , , , , , , , , , , , , , , , , , , , , , , , , , , , , , , , , , , , , , , , , , , , , , , , , , , , , , , , , , , , , , , , , , , , , , , , , , , , , , , , , , . (For interpretation of the references to color in this figure legend, the reader is referred to the web version of this article).
Fig. 7
Fig. 7
Comparison between standardized mean differences for free and total 8-iso-PGF. Data are fixed-effect model Hedges’ g values ±95% confidence interval.

Comment in

Similar articles

Cited by

References

    1. van't Erve T.J., Lih F.B., Kadiiska M.B., Deterding L.J., Eling T.E., Mason R.P. Reinterpreting the best biomarker of oxidative stress: the 8-iso-PGF2α/PGF2α ratio distinguishes chemical from enzymatic lipid peroxidation. Free Radic. Biol. Med. 2015;83:245–251. - PMC - PubMed
    1. van't Erve T.J., Lih F.B., Jelsema C., Deterding L.J., Eling T.E., Mason R.P., Kadiiska M.B. Reinterpreting the best biomarker of oxidative stress: the 8-iso-prostaglandin F2a/prostaglandin F2a ratio shows complex origins of lipid peroxidation biomarkers in animal models. Free. Radic. Biol. Med. 2016;95:65–73. - PMC - PubMed
    1. Kadiiska M.B., Gladen B.C., Baird D.D., Dikalova A.E., Sohal R.S., Hatch G.E., Jones D.P., Mason R.P., Barrett J.C. Biomarkers of oxidative stress study: are plasma antioxidants markers of CCl(4) poisoning? Free Radic. Biol. Med. 2000;28:838–845. - PubMed
    1. Kadiiska M.B., Gladen B.C., Baird D.D., Germolec D., Graham L.B., Parker C.E., Nyska A., Wachsman J.T., Ames B.N., Basu S., Brot N., Fitzgerald G.A., Floyd R.A., George M., Heinecke J.W., Hatch G.E., Hensley K., Lawson J.A., Marnett L.J., Morrow J.D., Murray D.M., Plastaras J., Roberts L.J., II, Rokach J., Shigenaga M.K., Sohal R.S., Sun J., Tice R.R., Van Thiel D.H., Wellner D., Walter P.B., Tomer K.B., Mason R.P., Barrett J.C. Biomarkers of oxidative stress study II. Are oxidation products of lipids, proteins, and DNA markers of CCl4 poisoning? Free Radic. Biol. Med. 2005;38:698–710. - PubMed
    1. Kadiiska M.B., Gladen B.C., Baird D.D., Graham L.B., Parker C.E., Ames B.N., Basu S., Fitzgerald G.A., Lawson J.A., Marnett L.J., Morrow J.D., Murray D.M., Plastaras J., Roberts L.J., II, Rokach J., Shigenaga M.K., Sun J., Walter P.B., Tomer K.B., Barrett J.C., Mason R.P. Biomarkers of oxidative stress study III. Effects of the nonsteroidal anti-inflammatory agents indomethacin and meclofenamic acid on measurements of oxidative products of lipids in CCl4 poisoning. Free Radic. Biol. Med. 2005;38:711–718. - PubMed

Publication types

LinkOut - more resources