. 2017 Apr 24;27(8):1200-1205.
doi: 10.1016/j.cub.2017.03.004. Epub 2017 Apr 6.

A Descending Neuron Correlated with the Rapid Steering Maneuvers of Flying Drosophila

Affiliations

A Descending Neuron Correlated with the Rapid Steering Maneuvers of Flying Drosophila

Bettina Schnell et al. Curr Biol. .

Abstract

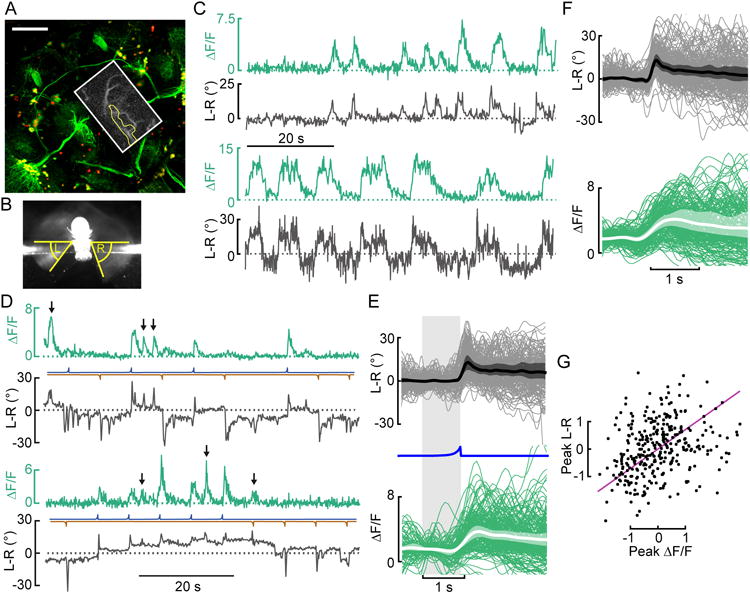
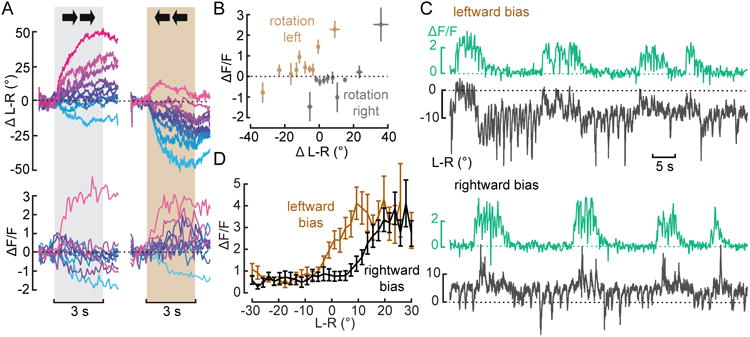
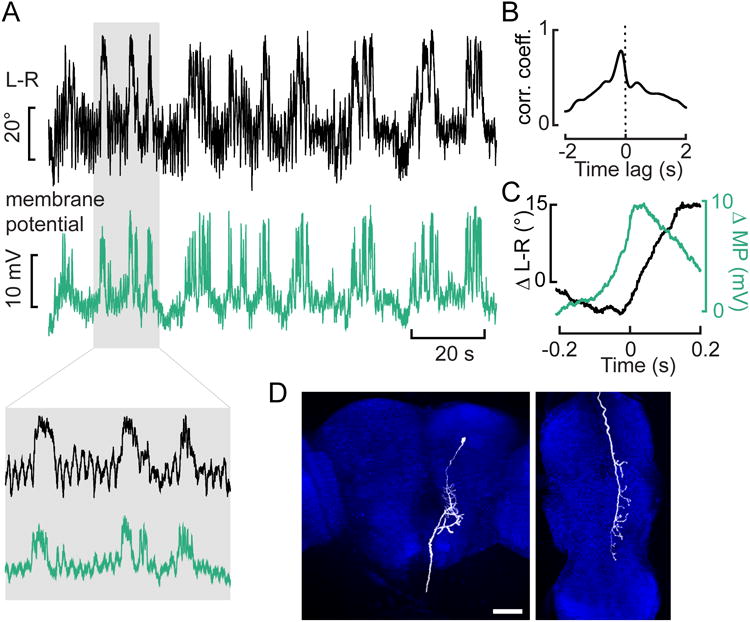
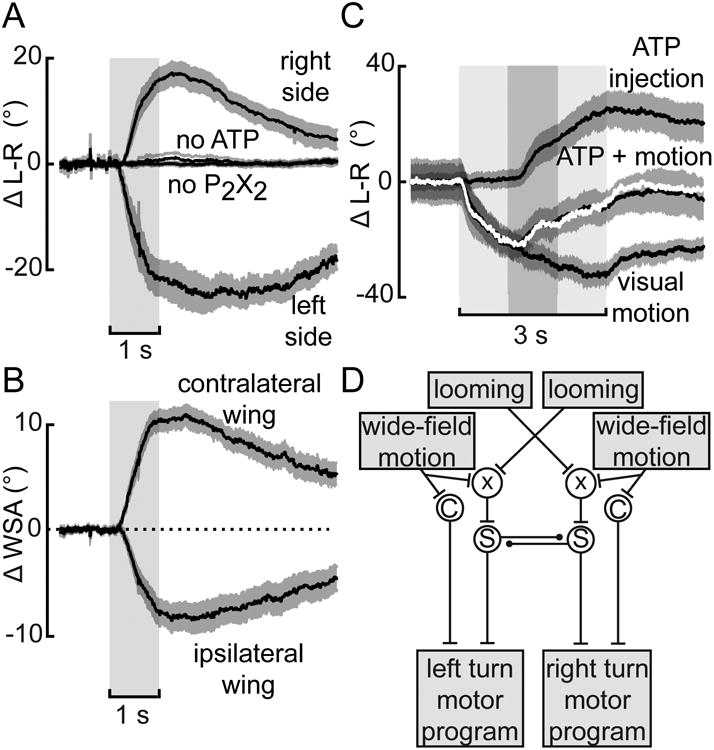
To navigate through the world, animals must stabilize their path against disturbances and change direction to avoid obstacles and to search for resources [1, 2]. Locomotion is thus guided by sensory cues but also depends on intrinsic processes, such as motivation and physiological state. Flies, for example, turn with the direction of large-field rotatory motion, an optomotor reflex that is thought to help them fly straight [3-5]. Occasionally, however, they execute fast turns, called body saccades, either spontaneously or in response to patterns of visual motion such as expansion [6-8]. These turns can be measured in tethered flying Drosophila [3, 4, 9], which facilitates the study of underlying neural mechanisms. Whereas there is evidence for an efference copy input to visual interneurons during saccades [10], the circuits that control spontaneous and visually elicited saccades are not well known. Using two-photon calcium imaging and electrophysiological recordings in tethered flying Drosophila, we have identified a descending neuron whose activity is correlated with both spontaneous and visually elicited turns during tethered flight. The cell's activity in open- and closed-loop experiments suggests that it does not underlie slower compensatory responses to horizontal motion but rather controls rapid changes in flight path. The activity of this neuron can explain some of the behavioral variability observed in response to visual motion and appears sufficient for eliciting turns when artificially activated. This work provides an entry point into studying the circuits underlying the control of rapid steering maneuvers in the fly brain.

Keywords: Drosophila; descending neuron; flight; saccades; spontaneous behavior.


Figures

Figure 1
Figure 1. Descending neuron activity correlates with spontaneous and looming-elicited changes in L-R WSA
(A) Maximum intensity projection of mCDGFP and stingerRed expression in the whole brain driven by R56G08-Gal4. A 261μm z-stack was taken with the 2-photon microscope (scale bar: 50μm). The approximate imaging area is depicted with a white box. An example image (maximum intensity projection of the tdTomato-signal of one experimental trial) with the region of interest highlighted in yellow is shown as inset. See also Movie S1. (B) Image of a fly taken from below illustrating the measurement of left (L) and right (R) wing stroke amplitude (WSA). (C) Representative traces of spontaneous changes in L-R WSA (L-R) and GCaMP6f fluorescence in AX (ΔF/F) from 2 (out of 19) recorded flies in the absence of visual stimulation. (D) Two example traces of changes in L-R and ΔF/F in AX during presentation of looming stimuli presented either left (blue) or right (brown). Several spontaneous saccades (black arrows) occur in between looming stimuli. (E) Top panel: Baseline-subtracted mean L-R (thick line), boot-strapped 95% CI for the mean of fly means (shaded area), and individual responses (thin lines) to looming stimuli on the left (blue line). Bottom panel: Same as top panel, but baseline-averaged ΔF/F instead of baseline-subtracted traces. N=13. (F) Same as E, with L-R and ΔF/F for spontaneous saccades. (G) For pooled responses to looming stimuli (E) and spontaneous saccades (F), a total least squares regression of fly sample version z-scores (purple line) explained 66.1 % of the variance between peak responses in ΔF/F and L-R (N=13).
Figure 2
Figure 2. AX activity is linked to deviations from a straight flight path
(A) Mean baseline-subtracted changes in L-R WSA and ΔF/F in response to a horizontally moving grating grouped into 10 equally spaced bins based on the magnitude of the behavioral response. Corresponding trials are colored the same. N=9 flies, n=57/65 trials. See also Figure S1. (B) Mean +/- 1 s.e.m. changes in ΔF/F during stimulus presentation plotted against simultaneous changes in L-R for all bins from A. (C) Example traces of simultaneously recorded changes in L-R and ΔF/F from the putative descending neuron during closed loop with a constant bias of left- or rightward motion (temporal frequency: 1.56 Hz.) (D) Mean changes in ΔF/F plotted against L-R for a bias of rightward (black) or leftward (brown) motion. N=10 flies.
Figure 3
Figure 3. Whole-cell recordings enable anatomical identification of AX
(A) Example traces of the simultaneously recorded L-R and membrane potential (MP) of the descending neuron during closed loop. The mean resting potential of the three cells recorded was -59 mV. The shaded area is expanded on the inset below. (B) Cross-correlation between the traces shown in A. (C) Averages of the large changes in MP that exceed twice the standard deviation (at time zero) and the concomitant changes in L-R from the traces in A. (D) Reconstruction of the biocytin-filled neuron in the brain (left) and ventral nerve cord (right) (maximum intensity projection). The background staining against NC82 is shown in blue. Scale bar: 50μm. See also Movie S2 and Movie S3.
Figure 4
Figure 4. ATP-induced activation of P2X2-expressing neurons is sufficient to elicit changes in L-R WSA
(A) Changes in L-R WSA upon stimulation with ATP/P2X2 driven by R56G08-Gal4 in either the right (N=11 flies) or left hemisphere (N=9) or of control flies (no ATP: N=14, no P2X2: N= 10). (B) Changes in WSA of the ipsi- and contralateral wing for all experimental flies from A. (C) ATP activation (dark gray) in the right hemisphere during stimulation with leftward motion (light gray). The sum of the responses to each manipulation alone is shown in white. Shaded areas represent s.e.m. (D) Qualitative model describing the experimental findings; C stands for the continuous optomotor pathway, S for the pathway mediating saccadic turns represented by AX. An inhibitory pathway connects the two AX cells. Input from the visual system drives AX albeit through a not yet characterized process represented by χ.

Similar articles

Cited by

References

    1. Collett TS, Land MF. Visual control of flight behaviour in the hoverfly Syritta pipiens L. J Comp Physiol. 1975;1:1–66.
    1. Budick SA, O'Malley DM. Locomotor repertoire of the larval zebrafish: swimming, turning and prey capture. J Exp Biol. 2000;17:2565–2579. - PubMed
    1. Götz KG. Flight control in Drosophila by visual perception of motion. Kybernetik. 1968;6:199–208. - PubMed
    1. Tammero LF, Frye MA, Dickinson MH. Spatial organization of visuomotor reflexes in Drosophila. J Exp Biol. 2004;1:113–122. - PubMed
    1. Mronz M, Lehmann F. The free-flight response of Drosophila to motion of the visual environment. J Exp Biol. 2008;13:2026–2045. - PubMed