

Active-Site Flexibility and Substrate Specificity in a Bacterial Virulence Factor: Crystallographic Snapshots of an Epoxide Hydrolase
- PMID: 28392259
- PMCID: PMC5524515
- DOI: 10.1016/j.str.2017.03.002
Active-Site Flexibility and Substrate Specificity in a Bacterial Virulence Factor: Crystallographic Snapshots of an Epoxide Hydrolase
Abstract
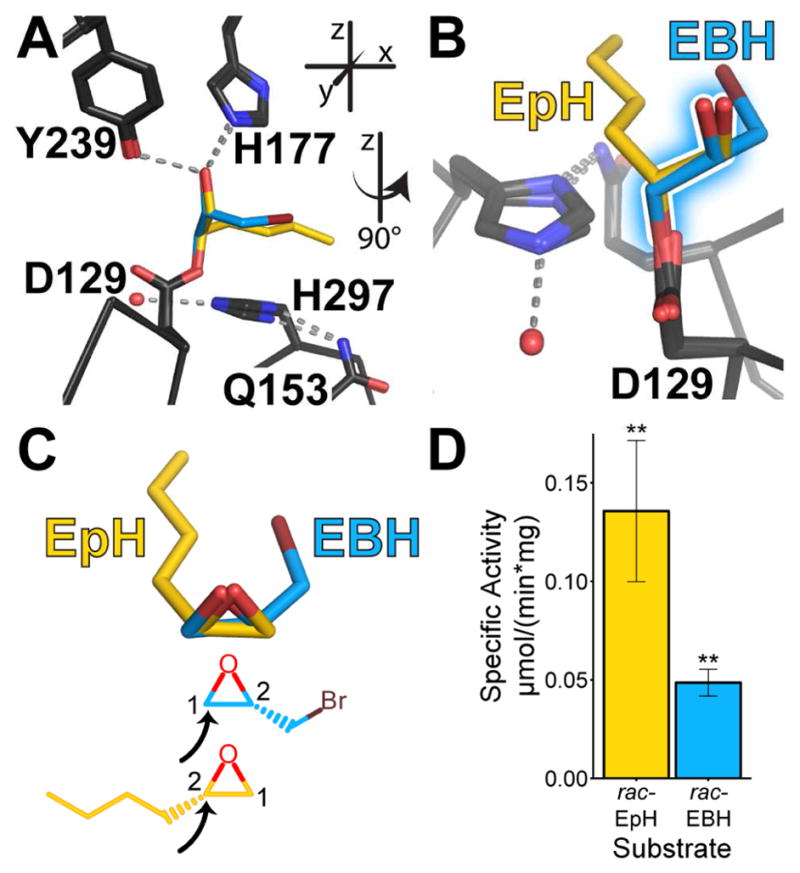
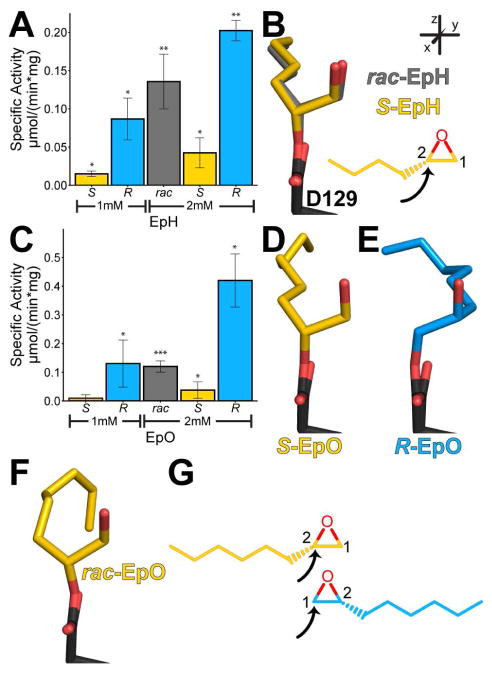
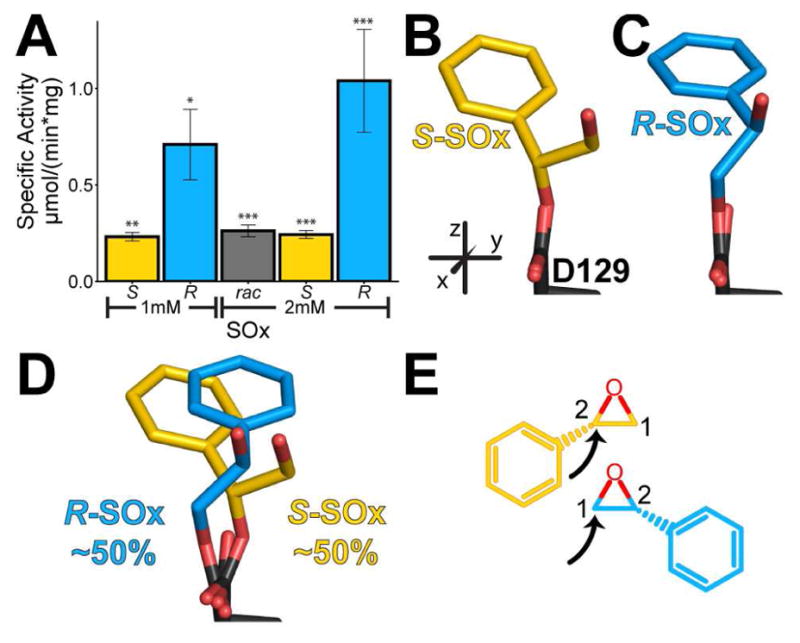
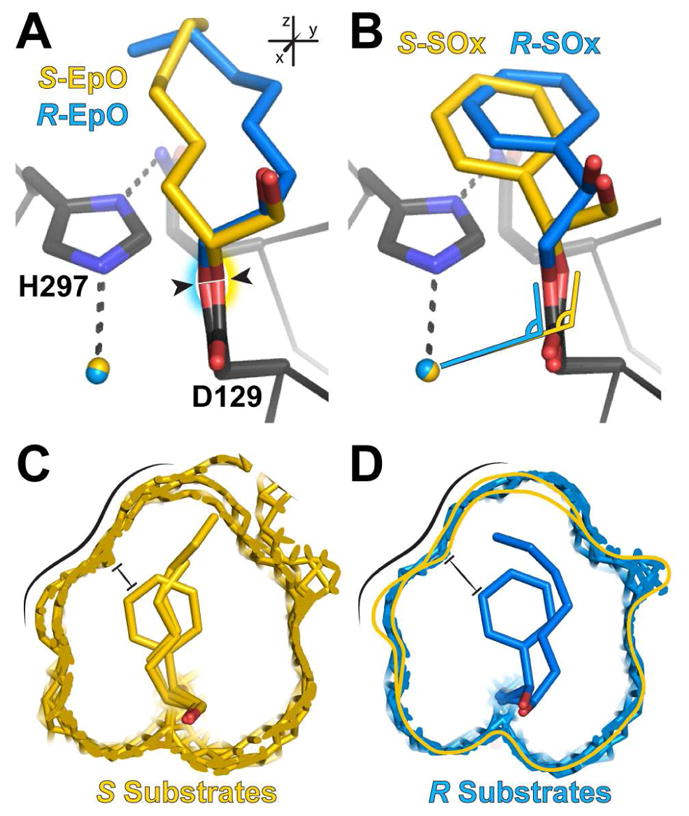
Pseudomonas aeruginosa secretes an epoxide hydrolase with catalytic activity that triggers degradation of the cystic fibrosis transmembrane conductance regulator (CFTR) and perturbs other host defense networks. Targets of this CFTR inhibitory factor (Cif) are largely unknown, but include an epoxy-fatty acid. In this class of signaling molecules, chirality can be an important determinant of physiological output and potency. Here we explore the active-site chemistry of this two-step α/β-hydrolase and its implications for an emerging class of virulence enzymes. In combination with hydrolysis data, crystal structures of 15 trapped hydroxyalkyl-enzyme intermediates reveal the stereochemical basis of Cif's substrate specificity, as well as its regioisomeric and enantiomeric preferences. The structures also reveal distinct sets of conformational changes that enable the active site to expand dramatically in two directions, accommodating a surprising array of potential physiological epoxide targets. These new substrates may contribute to Cif's diverse effects in vivo, and thus to the success of P. aeruginosa and other pathogens during infection.
Keywords: Pseudomonas aeruginosa; X-ray crystallography; enzyme stereospecificity; epoxide hydrolase; epoxy-fatty acids; hydroxyalkyl-enzyme intermediate; structure-function relationships; virulence factor.
Copyright © 2017 Elsevier Ltd. All rights reserved.
Figures
Similar articles
-
Crystal structure of the cystic fibrosis transmembrane conductance regulator inhibitory factor Cif reveals novel active-site features of an epoxide hydrolase virulence factor.J Bacteriol. 2010 Apr;192(7):1785-95. doi: 10.1128/JB.01348-09. Epub 2010 Jan 29. J Bacteriol. 2010. PMID: 20118260 Free PMC article.
-
Visualizing the Mechanism of Epoxide Hydrolysis by the Bacterial Virulence Enzyme Cif.Biochemistry. 2016 Feb 9;55(5):788-97. doi: 10.1021/acs.biochem.5b01229. Epub 2016 Jan 22. Biochemistry. 2016. PMID: 26752215 Free PMC article.
-
Pseudomonas aeruginosa Cif defines a distinct class of α/β epoxide hydrolases utilizing a His/Tyr ring-opening pair.Protein Pept Lett. 2012 Feb;19(2):186-93. doi: 10.2174/092986612799080392. Protein Pept Lett. 2012. PMID: 21933119 Free PMC article.
-
Epoxide hydrolases: structure, function, mechanism, and assay.Methods Enzymol. 2005;400:569-88. doi: 10.1016/S0076-6879(05)00032-7. Methods Enzymol. 2005. PMID: 16399371 Review.
-
Kinetic and chemical mechanism of epoxide hydrolase.Drug Metab Rev. 1999 Feb;31(1):71-86. doi: 10.1081/dmr-100101908. Drug Metab Rev. 1999. PMID: 10065366 Review. No abstract available.
Cited by
-
An epoxide hydrolase secreted by Pseudomonas aeruginosa decreases mucociliary transport and hinders bacterial clearance from the lung.Am J Physiol Lung Cell Mol Physiol. 2018 Jan 1;314(1):L150-L156. doi: 10.1152/ajplung.00383.2017. Epub 2017 Oct 5. Am J Physiol Lung Cell Mol Physiol. 2018. PMID: 28982736 Free PMC article.
-
Ligand Binding Site Structure Influences the Evolution of Protein Complex Function and Topology.Cell Rep. 2018 Mar 20;22(12):3265-3276. doi: 10.1016/j.celrep.2018.02.085. Cell Rep. 2018. PMID: 29562182 Free PMC article.
-
Evolution of tunnels in α/β-hydrolase fold proteins-What can we learn from studying epoxide hydrolases?PLoS Comput Biol. 2022 May 17;18(5):e1010119. doi: 10.1371/journal.pcbi.1010119. eCollection 2022 May. PLoS Comput Biol. 2022. PMID: 35580137 Free PMC article.
-
Mutation of an atypical oxirane oxyanion hole improves regioselectivity of the α/β-fold epoxide hydrolase Alp1U.J Biol Chem. 2020 Dec 11;295(50):16987-16997. doi: 10.1074/jbc.RA120.015563. Epub 2020 Oct 1. J Biol Chem. 2020. PMID: 33004437 Free PMC article.
-
Bacterial Outer Membrane Vesicles and Immune Modulation of the Host.Membranes (Basel). 2023 Aug 24;13(9):752. doi: 10.3390/membranes13090752. Membranes (Basel). 2023. PMID: 37755174 Free PMC article. Review.
References
-
- Arand M, Cronin A, Adamska M, Oesch F. Epoxide hydrolases: Structure, function, mechanism, and assay. Methods Enzymol. 2005;400:569–588. - PubMed
-
- Bahl CD, Morisseau C, Bomberger JM, Stanton BA, Hammock BD, O’Toole GA, Madden DR. Crystal structure of the cystic fibrosis transmembrane conductance regulator inhibitory factor Cif reveals novel active-site features of an epoxide hydrolase virulence factor. J Bacteriol. 2010a;192:1785–1795. - PMC - PubMed
MeSH terms
Substances
Grants and funding
- P20 GM113132/GM/NIGMS NIH HHS/United States
- P30 GM106394/GM/NIGMS NIH HHS/United States
- R01 AI091699/AI/NIAID NIH HHS/United States
- R01 ES002710/ES/NIEHS NIH HHS/United States
- K99 ES024806/ES/NIEHS NIH HHS/United States
- P42 ES004699/ES/NIEHS NIH HHS/United States
- T32 GM008704/GM/NIGMS NIH HHS/United States
- U24 DK097154/DK/NIDDK NIH HHS/United States
- P41 GM111244/GM/NIGMS NIH HHS/United States
- R00 ES024806/ES/NIEHS NIH HHS/United States
- Y01 GM000080/GM/NIGMS NIH HHS/United States
- P41 GM103393/GM/NIGMS NIH HHS/United States
LinkOut - more resources
Full Text Sources
Other Literature Sources
