. 2017 Aug:144:83-92.
doi: 10.1016/j.antiviral.2017.03.027. Epub 2017 Apr 7.

Early phase dynamics of traceable mCherry fluorescent protein-carrying HIV-1 infection in human peripheral blood mononuclear cells-transplanted NOD/SCID/Jak3-/- mice

Affiliations

Early phase dynamics of traceable mCherry fluorescent protein-carrying HIV-1 infection in human peripheral blood mononuclear cells-transplanted NOD/SCID/Jak3-/- mice

Nobuyo Higashi-Kuwata et al. Antiviral Res. 2017 Aug.

Abstract

We attempted to elucidate early-phase dynamics of HIV-1 infection using replication-competent, red-fluorescent-protein (mCherry)-labeled HIV-1JR-FL (HIVJR-FLmC) and NOD/SCID/Jak3-/- mice transplanted with Individual-A's human peripheral blood mononuclear cells (hPBMC)(hNOJ mice). On day 7 following HIVJR-FLmC inoculation, mCherry-signal-emitting infection foci were readily identified in the subserosa of 10 of 10 HIVJR-FLmC-inoculated hNOJ mice, although infection foci were not located without the mCherry signal in unlabeled HIV-1JR-FL-inoculated mice (n = 6). Even on day 14, infection foci were hardly located in the unlabeled HIV-1JR-FL-inoculated mice, while in all of 7 HIVJR-FLmC-inoculated hNOJ mice examined, mCherry-signal-emitting lymph nodes were easily identified, in which active viral replication was present. On day 14, a significantly larger number of mesenteric lymph nodes were seen in HIVJR-FLmC-exposed hNOJ mice than in HIVJR-FLmC-unexposed mice (P = 0.0025). The weights of mesenteric lymph nodes of those HIVJR-FLmC-exposed hNOJ mice were also greater than those of HIVJR-FLmC-unexposed mice (P = 0.0005). When hNOJ mice were inoculated with HIVJR-FLmC-exposed hPBMC from Individual-B, significantly greater viremia was seen than in cell-free HIVJR-FLmC-inoculated hNOJ mice as examined on day 7. In the lymph nodes of those mice inoculated with HIVJR-FLmC-exposed hPBMC from Individual-B, a substantial number of Individual-B's HIVJR-FLmC-infected cells were identified together with Individual-A's cells as examined on day 14. The present HIVJR-FLmC-infected mouse model represents the first system reported using traceable HIVJR-FLmC and human target cells, not using SIV or simian cells, which should be of utility in studies of early-phases of HIV-1 transmission and in evaluating the effects of potential agents for post-exposure and pre-exposure prophylaxis.

Keywords: Cell-associated HIV infection; Early phase dynamics; HIV propagation; In vivo imaging.


Conflict of interest statement

Conflict of interest

The authors declare no conflict of interest.

Figures

Fig. 1.
Fig. 1.. Generation of a recombinant HIV-1 clone containing mCherry florescent protein (HIVJR-FL mC).
(A) Genetic map of HIV-1 containing the mCherry fluorescent protein-encoding gene. HIV-1JR-FL was constructed to contain mCherry fluorescent protein between gp41 and nef proteins. (B) Comparison of the replicative capacity between HIVJR-FL mc and HIV-1JR-FL in monocyte-derived macrophages/dendritic cells (Mϕ/DC). Monocytes were stimulated with rhGM-CSF (i) or rhM-CSF (ii). Note that HIVJR-FLmC propagated in the presence of either of the cytokines, although HIVJR-FL mC was slower in its propagation than HIV-1JR-FL. Data represent the mean values determined in triplicate. (C) The mCherry signal was detected as early as on day 3 following the exposure to HIVJR-FL mC (a: left panel) in Mϕ/DC, but not when the cells were exposed to HIV-1JR-FL (b: left panel) as examined under confocal laser microscopy. Stronger mCherry signals were observed when examined on day 11 (c: left panel) in HIVJR-FL mC-exposed Mϕ/DC, whereas no mCherry signal was detected in HIV-1JR-FL-infected Mϕ/DC (d: left panel). The general morphology of the cells was captured under the differential interference contrast microscopy (a-d: right panels). Scale bar denotes 10 μm. (D) The expression of mCherry, HIV-1 p24, and Nef proteins of HIVJR-FL mC. After 6 days following pHIVJR-FL mc transfection of COS-7 cells, the expression of mCherry/DsRed and HIV-1 p24 proteins was detected as assessed with western blot using the COS-7 cell lysates (a). Neither mCherry nor Nef protein was detected in HIVJR-FLmC virion lysates (b). (E) The mCherry-encoding gene persisted within PBMCs obatined from the HIVJR-FLmC-infected hNOJ mice until day 14 following HIVJR-FLmC inoculation, although deletion of the mCherry-encoding gene apparently occurred by day 21 after the inoculation. Lanes 1 to 4 show the PCR-amplified DNA products containing the mCherry-coding gene within the provirus in huPBMC.
Fig. 2.
Fig. 2.. Reconstitution of hPBMC in organs of hNOJ mice.
(A) Fixed/paraffin-embedded tissue sections were immunohistologically stained with anti-human CD45 antibody (a pan-lymphocyte marker) and examined under light microscopy. Nuclei were counterstained with Mayer's hematoxylin (blue). Note that human CD45+ cells (brown) were abundantly seen in each of the organs examined including brain (a), lungs (b), liver (c), spleen (d), kidneys (e), skin (f), muscle (g), intestines (h), testis (i), vagina (j), and lymph nodes (k). Note that murine lymphocytes are virtually absent, human lymphocytes (hCD45+) are sparse, and no follicles were seen in the lymph nodes excised from the hNOJ mouse (k), while murine lymphocytes (hCD45) are abundantly seen in lymph nodes excised from a healthy BALB/c mouse (l). Scale bars in (h) through (j) denote 200 μm and all others 20 μm. (B) Fixed/paraffin-embedded tissue sections were stained with anti-human CD20 (hCD20) antibody (a B lymphocyte marker). Note that hCD20+ cells (brown) were seen only in spleen (d) and lymph nodes (k) as indicated with arrows. Panel (l) shows the lymph node histology of a healthy BALB/c mouse, where no hCD20+ cells were seen. Scale bars in (h) through (j) denote 200 mm and all others 20 μm.
Fig. 3.
Fig. 3.
Protocol for radiation, hPBMC transplantation, HIVJR-FL mC inoculation, and monitoring the dynamics of HIVJR-FL mC infection.
Fig. 4.
Fig. 4.. Visualization of expanding HIVJR-FL mC infection in the HIVJR-FL mC-exposed hNOJ mice and detection of HIV-1 p24 antigen in the plasma.
(A) mCherry fluorescent protein signals were seen only in the omentum area in all HIVJR-FL mC-exposed hNOJ mice examined on day 7 after HIVJR-FL mC inoculation and no lymph nodes were identified. However, on day 14 after the exposure, enlarged lymph nodes were seen with distinct mCherry fluorescent signals. Panels a and c show mCherry signals alone (at wave lengths 587–610 nm) and panels b and d show mCherry signals superimposed with light microscopy images. Arrows indicate the mCherry signals. Scale bars denote 1 cm. (B) HIV-1 p24 antigen in plasma from HIVJR-FL mC-exposed hNOJ mice. Plasma samples from the HIVJR-FL mC-infected mice were analyzed by the fully automated chemiluminescent enzyme immunoassay system on days 7 (n = 10) and 14 (n = 7) after HIVJR-FL mC inoculation. Histological data shown in C-a through -d are from a representative mouse indicated by a solid black circle, while histological data shown in C-e, -f and D are from a representative mouse demonstrated by a solid black triangle. Asterisk indicates significant difference. (P = 0.0012) (C) HIVJR-FL mc-infected cells in the lamina subserosa on day 7 after inoculation (a-d) and those in lymph nodes on day 14 after the inoculation(e and f). Panels a, c, and e show the immunostaining images of mCherry protein (in brown), while panels b, d, and f show the images of HIV-1 p24 staining(in brown). Note that infected cells are seen only in the lamina subserosa (a and b), while no infected cells were seen in lymphoid tissues (or lymph nodes) (c and d). In panels e and f, cells positive for mCherry protein and HIV-1 p24 are seen. Scale bars in magnified view denote 20 μm and all others 200 μm. (D) mCherry+ cells seen in celiac lymph nodes on day 14 after the inoculation are also positive for HIV-1 p24, CD4, and CD68. Panel a shows simultaneous staining image with anti-mCherry and anti-p24 antibodies; panel b image with anti-mCherry and anti-hCD4 antibodies; panel c image with anti-mCherry and anti-hCD68 antibodies; and panel d image with anti-mCherry and anti-hCD8 antibodies. Note that mCherry signals are seen in red while all other signals in brown. Scale bar, 20 μm.
Fig. 5.
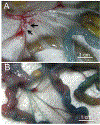
Fig. 5.. No distinct lymph nodes are present in the peritoneal cavity of NOJ mice.
Lymphoid tissues including lymphatic vessels were seen after intraperitoneal injection of patent blue dye, by which mesenteric lymphoid tissues became readily visible. This representative picture of the abdominal area of a BALB/c mouse distinctly shows blue-stained lymphatic vessels accompanied by blood vessels and mesenteric lymph nodes as indicated by arrows (A), whereas no identified lymph nodes were in the same area in a NOJ mouse (B). Scale bars denote 1 cm.
Fig. 6.
Fig. 6.. Mesenteric lymph nodes are greater in number and weight in HIVJR-FL mC-exposed hNOJ mice than in HIVJR-FL mC-unexposed hNOJ mice.
(A) In vivo spectral fluorescence imaging enables identification of lymph nodes otherwise unidentified (or highly difficult to identify) in HIVJR-FL mC-infected humanized mice. The composite image with white light spectra and a mCherry spectrum (wave lengths 587–610 nm) demonstrates the location of the mesenteric lymph node (i-a) and iliac lymph node (i-c). Extracted mCherry spectral imaging is clearly shown in the mesenteric lymph node (i-b) and iliac lymph node (i-d). Fixed/paraffin-embedded tissue sections of the lymph nodes were immunostained with anti-hCD45 (ii-a: mesenteric lymph node, ii-d: iliac lymph node), anti-mCherry (ii-b: mesenteric lymph node, ii-e: iliac lymph node), and anti-HIV-1p24 (ii-c: mesenteric lymph node, ii-f: iliac lymph node) antibodies. Nuclei were counterstained with Mayer's hematoxylin (blue). Scale bar, 20 μm. (B) Comparison of the numbers of the mesenteric lymph nodes. The numbers of lymph nodes in the individual HIVJR-FL mC-exposed hNOJ mouse and unexposed mouse were counted by MVX10-Nuance™ with spotted mCherry signals. The numbers of lymph nodes varied from 0 to 5; however, in the unexposed mice, no lymph nodes were identified in the mesenteric region of those mice. Asterisk indicates significant difference. (P = 0.0025). (C) Representative images of the harvested and measured lymph nodes. (a) indicates a mesenteric lymph node from the HIVJR-FL mC infected mouse and (b) indicates a celiac lymph node from the HIVJR-FL mC -infected mouse, whereas (c) shows a celiac lymph node from the control mice. Scale bar, 1 mm. (D) Comparison of the weight of the mesenteric lymph nodes between non-HIVJR-FL mC-infected mice and HIVJR-FL mC-infected mice. Weight was measured using a microbalance as wet weight. We considered the weight of macroscopically undetectable mesenteric lymph node as 0 mg. Asterisk indicates significant difference. (P = 0.0005). (E) Comparison of the weight of the celiac lymph nodes between non-HIVJR-FL mC-infected mice and HIVJR-FL mC-infected mice.
Fig. 7.
Fig. 7.. Cell-associated and cell-free virions induce more efficient and more rapid transmission than cell-free virions alone in hNOJ mice.
(A) Protocol of examination of cell-associated and cell-free HIVJR-FL mC transmission. (B) Cell-associated and cell-free virions more efficiently and more rapidly caused viremia than cell-free virions alone. Plasma samples from the HIVJR-FL mC-exposed mice were subjected to the fully automated chemiluminescent enzyme p24 immunoassay on days 7 and 14 following HIVJR-FL mC inoculation. Note that the HIVJR-FL mC viremia levels were greater in mice receiving both cell-associated and cell-free virions than in those receiving cell-free virions alone. Histological data of a solid black square is shown in panel C. (C) Distribution of HIVJR-FL mC-infected HLA-A2+ cells (Individual-A), HIVJR-FL mC-infected HLA-A31+ cells (Individual-B), and HIV-1 p24+ +and hCD68+ cells in the omentum area on day 7 after cell-free & cell associated virion exposure. Each panel demonstrates a merged image, which is composed of pictures obtained from 3-color fluorescent immunostaining. HLA-A2+ cells (a–d), HLA-A3+ cells (c, e and f), or hCD68+ cells (d) are shown in red, whereas HIV-1 p24+ cells (a–d) and HLA-A+ (e) cells are shown in green. Nuclei (a-d and f) are in blue. Panel a demonstrates the specific region where HLA-A2 & HIV-1 p24 double positive cells are located and panel b represents a magnified view of the enclosure in panel a. Panel c shows that HLA-A31+ cells (Individual-B) are also positive for HIV-1 p24. Panel d shows that HIV-1 p24+ cells are also positive for hCD68+. Panels e and f show that both HLA-A31+ and HLA-A+ cells are seen in the same area. Arrows indicate double positive cells, which are shown in yellow (a–d). Scale bar in panel c denotes 100 μmm and all others 10 μm.

Similar articles

Cited by

References

    1. Alford R, Ogawa M, Choyke PL, Kobayashi H, 2009. Molecular probes for the in vivo imaging of cancer. Mol. Biosyst. 5, 1279–1291. - PMC - PubMed
    1. Anderson DJ, 2014. Modeling mucosal cell-associated HIV type 1 transmission in vitro. J. Infect. Dis. 210 (Suppl. 3), S648–S653. - PMC - PubMed
    1. Aoki M, Danish ML, Aoki-Ogata H, Amano M, Ide K, Das D, Koh Y, Mitsuya H, 2012. Loss of the protease dimerization inhibition activity of tipranavir (TPV) and its association with the acquisition of resistance to TPV by HIV-1. J. Virol. 86, 13384–13396. - PMC - PubMed
    1. Asmal M, Lane S, Tian M, Nickel G, Venner C, Dirk B, Dikeakos J, Luedemann C, Mach L, Balachandran H, Buzby A, Rao S, Letvin N, Gao Y, Arts EJ, 2016. Pathogenic infection of Rhesus macaques by an evolving SIV-HIV derived from CCR5-using envelope genes of acute HIV-1 infections. Virology 499, 298–312. - PMC - PubMed
    1. Bomsel M, 1997. Transcytosis of infectious human immunodeficiency virus across a tight human epithelial cell line barrier. Nat. Med. 3, 42–47. - PubMed

Publication types