. 2017 Jun:153:246-261.
doi: 10.1016/j.neuroimage.2017.04.010. Epub 2017 Apr 6.

Quantifying cortical development in typically developing toddlers and young children, 1-6 years of age

Affiliations

Quantifying cortical development in typically developing toddlers and young children, 1-6 years of age

Justin Remer et al. Neuroimage. 2017 Jun.

Abstract

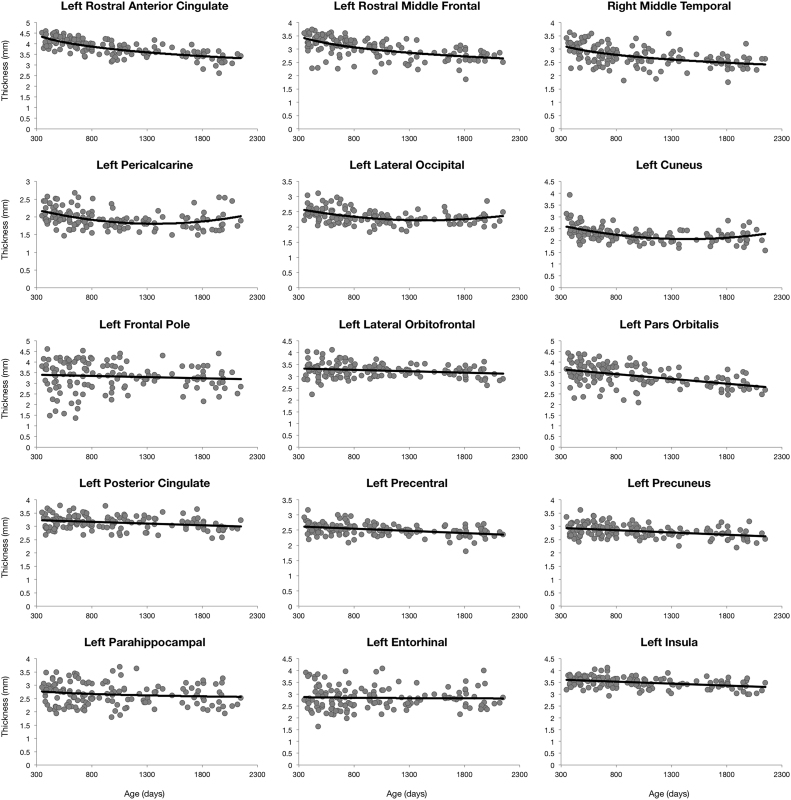
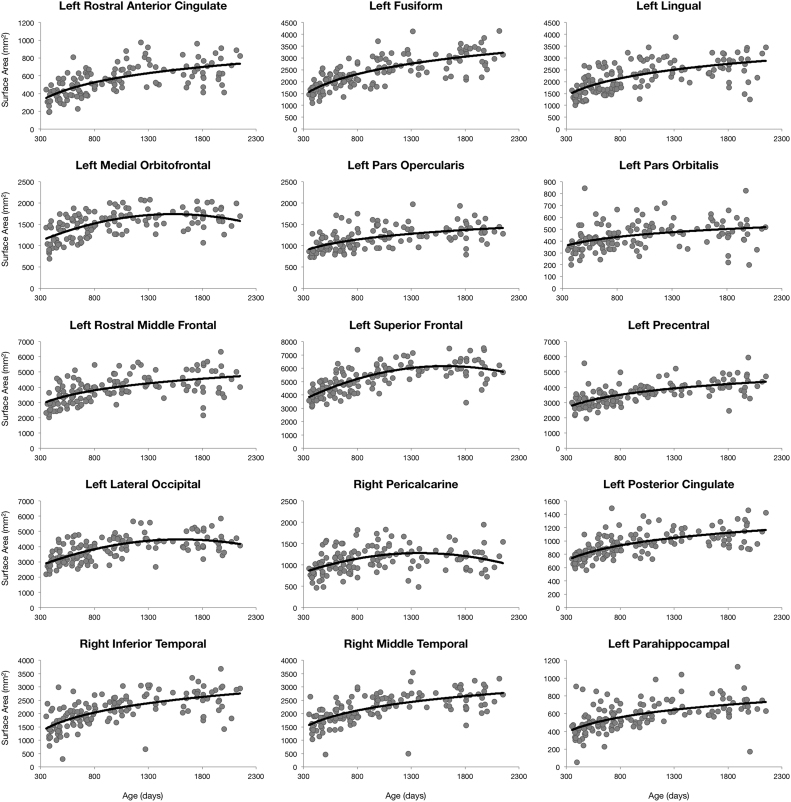
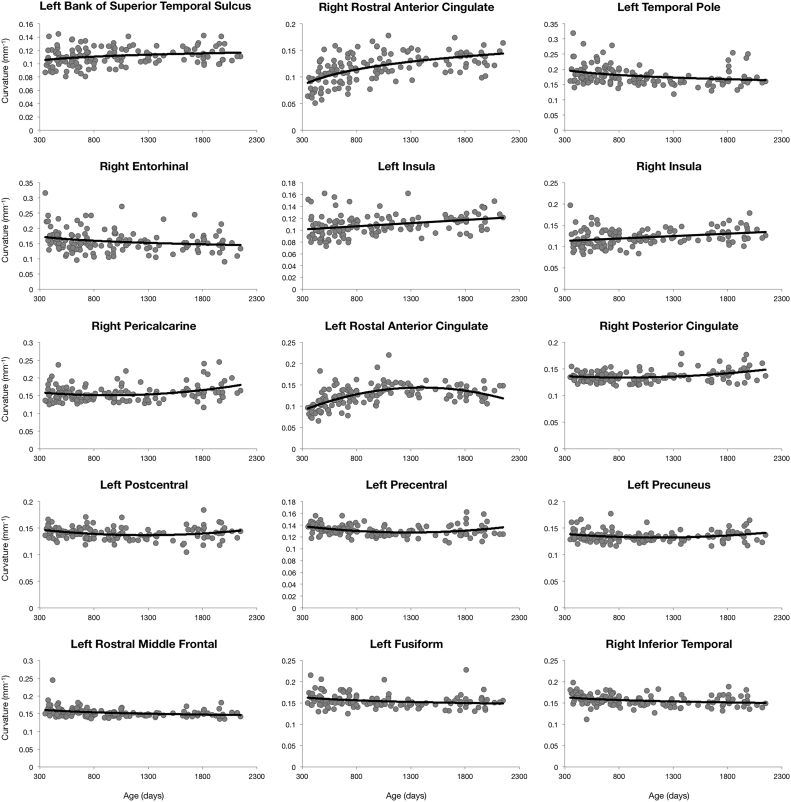
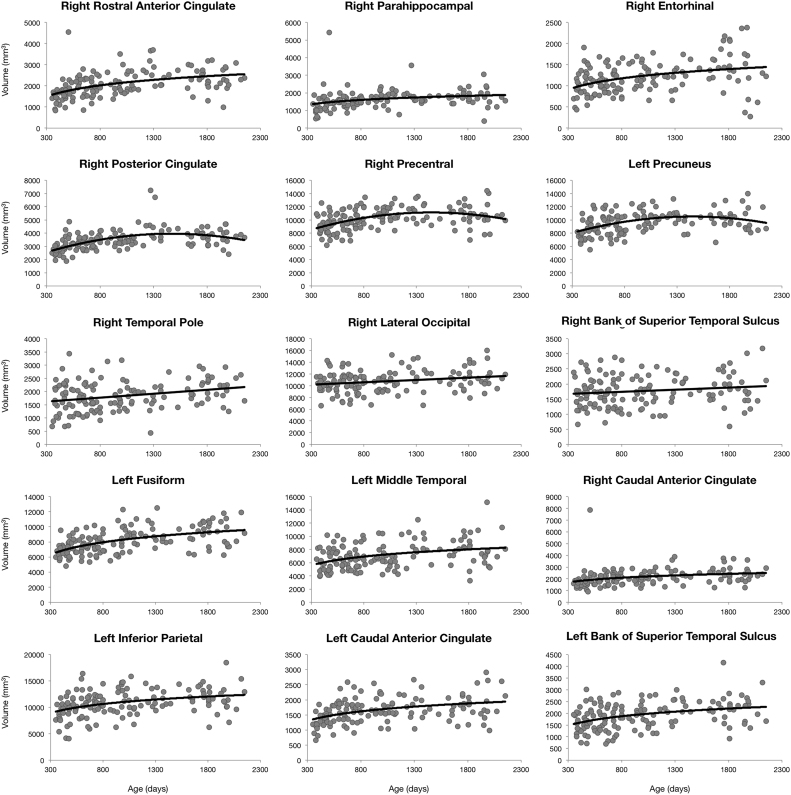
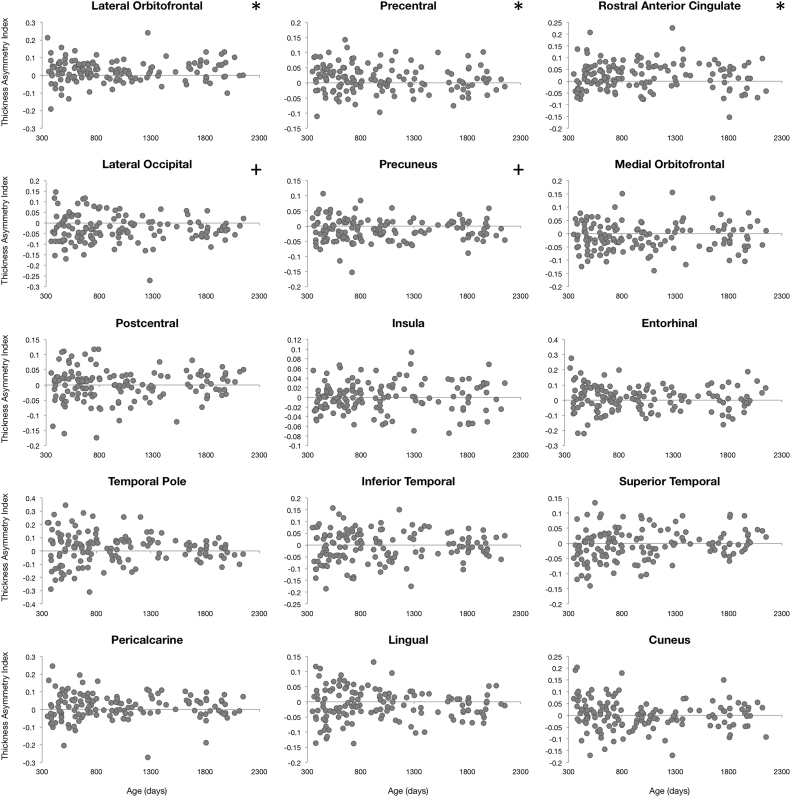
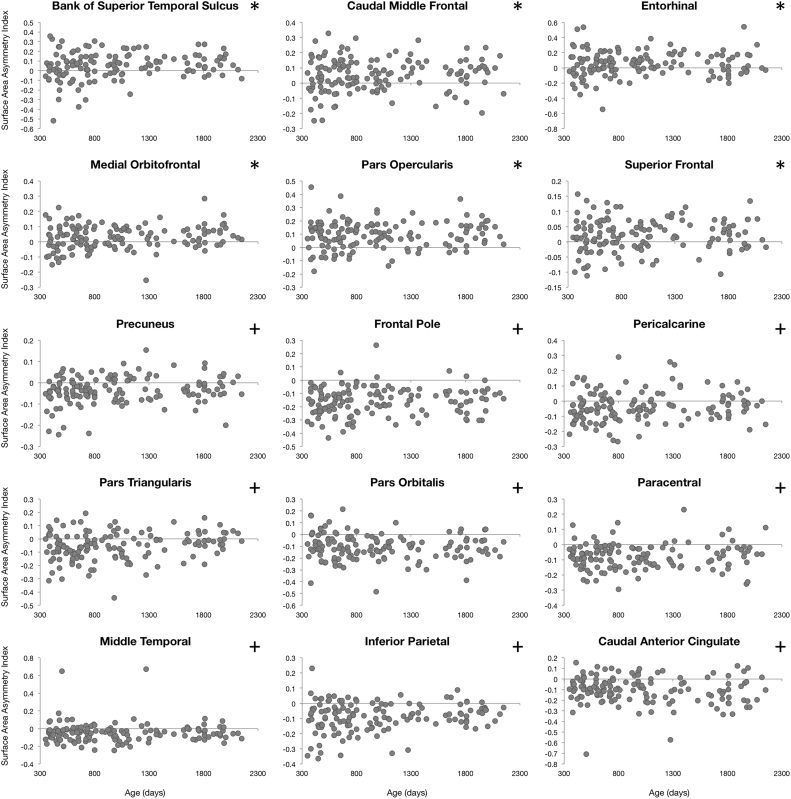
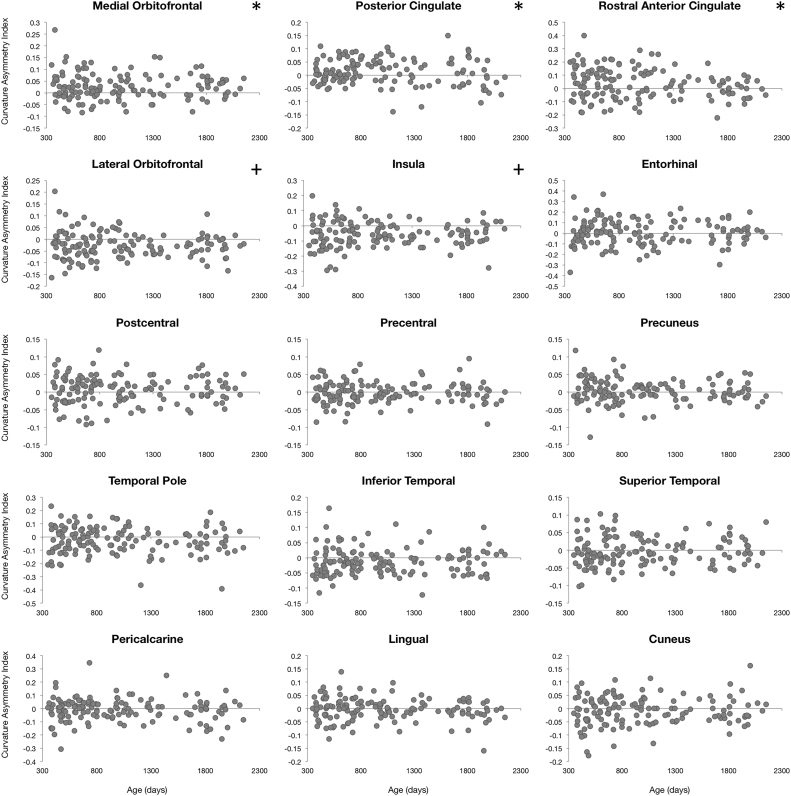
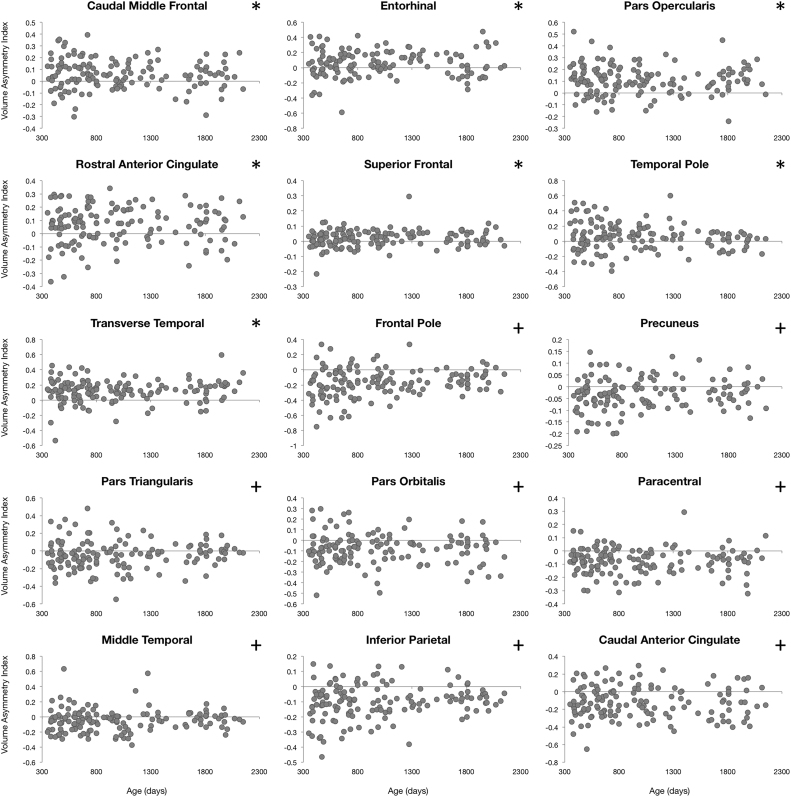
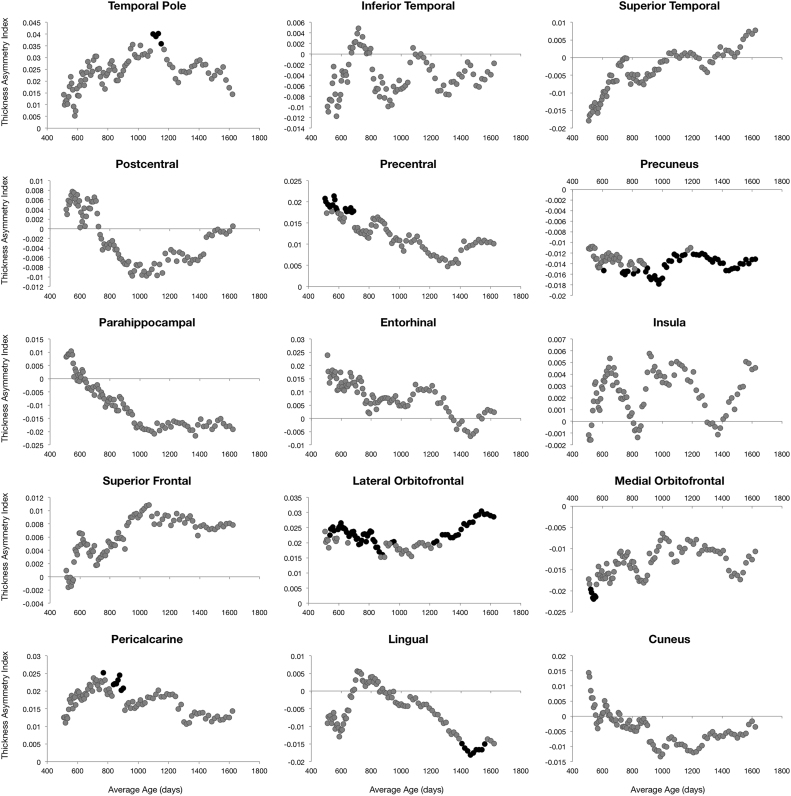
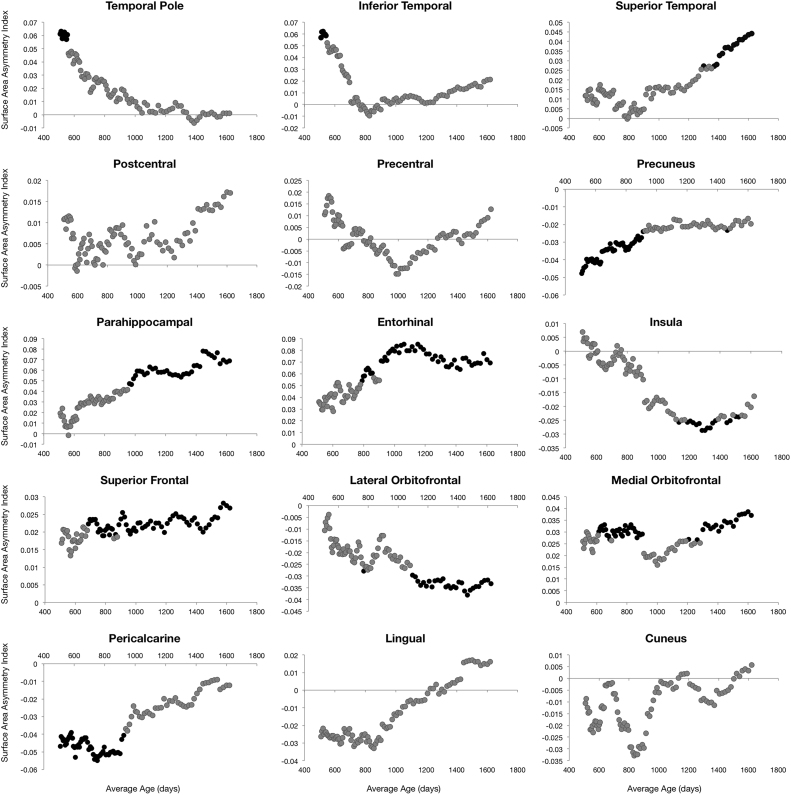
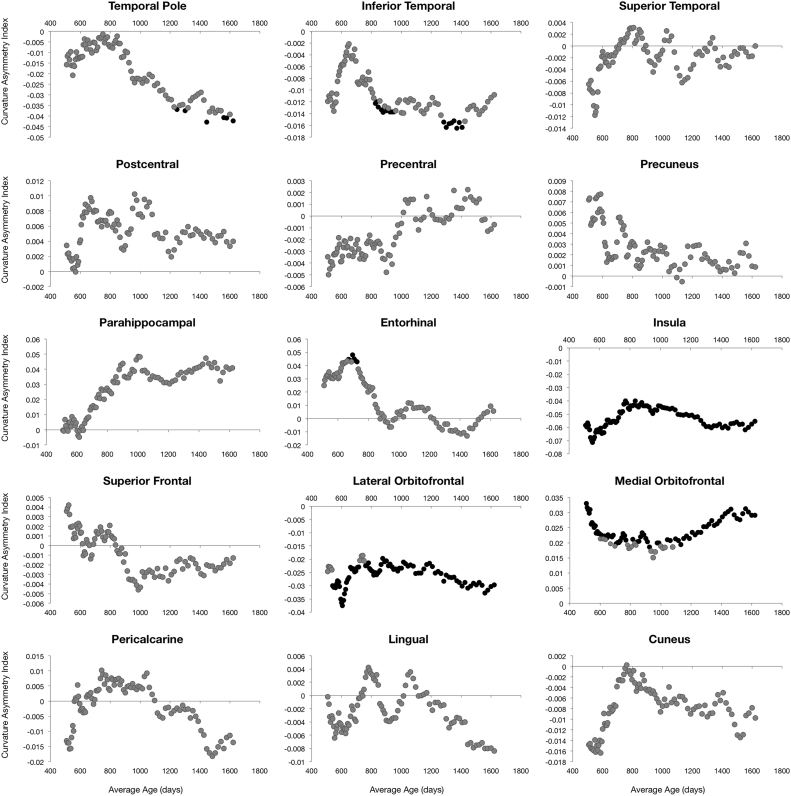
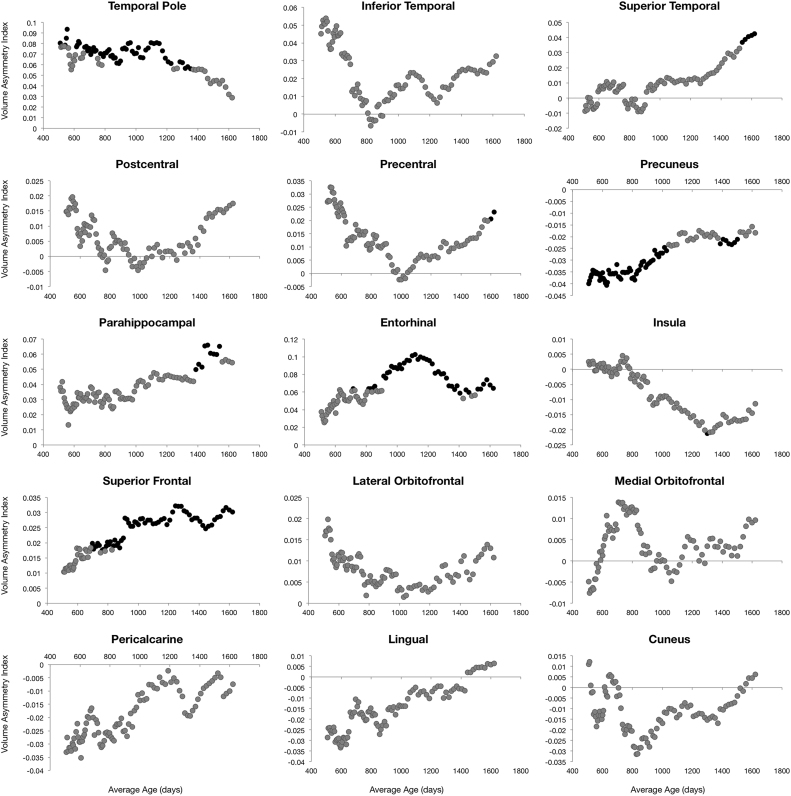
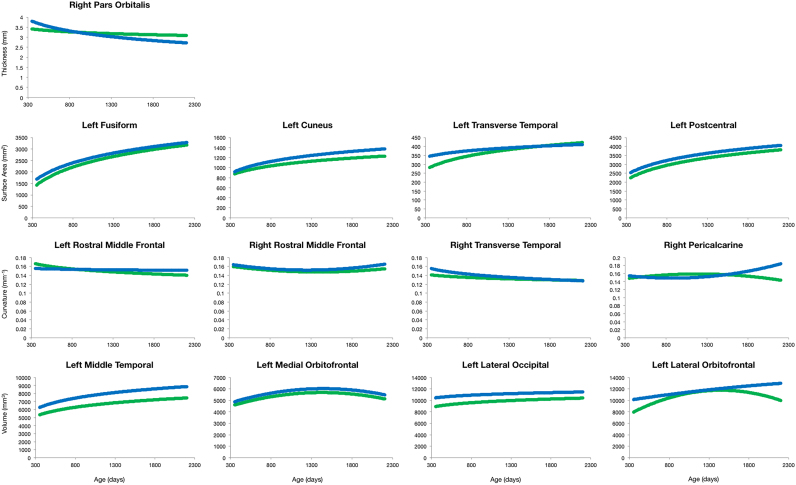
Cortical maturation, including age-related changes in thickness, volume, surface area, and folding (gyrification), play a central role in developing brain function and plasticity. Further, abnormal cortical maturation is a suspected substrate in various behavioral, intellectual, and psychiatric disorders. However, in order to characterize the altered development associated with these disorders, appreciation of the normative patterns of cortical development in neurotypical children between 1 and 6 years of age, a period of peak brain development during which many behavioral and developmental disorders emerge, is necessary. To this end, we examined measures of cortical thickness, surface area, mean curvature, and gray matter volume across 34 bilateral regions in a cohort of 140 healthy children devoid of major risk factors for abnormal development. From these data, we observed linear, logarithmic, and quadratic patterns of change with age depending on brain region. Cortical thinning, ranging from 10% to 20%, was observed throughout most of the brain, with the exception of posterior brain structures, which showed initial cortical thinning from 1 to 5 years, followed by thickening. Cortical surface area expansion ranged from 20% to 108%, and cortical curvature varied by 1-20% across the investigated age range. Right-left hemisphere asymmetry was observed across development for each of the 4 cortical measures. Our results present new insight into the normative patterns of cortical development across an important but under studied developmental window, and provide a valuable reference to which trajectories observed in neurodevelopmental disorders may be compared.


Figures

Fig. 1
Fig. 1
Region specific cortical thickness trajectories for a selection of anatomical regions. Points correspond to subject specific thickness value and the line corresponds to the trend line of best fit from BIC analysis.
Fig. 2
Fig. 2
Region specific cortical surface area trajectories for a selection of anatomical regions. Points correspond to subject specific surface area value and the line corresponds to the trend line of best fit from BIC analysis.
Fig. 3
Fig. 3
Region specific cortical mean curvature trajectories for a selection of anatomical regions. Points correspond to subject specific mean curvature value and the line corresponds to the trend line of best fit from BIC analysis.
Fig. 4
Fig. 4
Region specific cortical gray matter volume trajectories for a selection of anatomical regions. Points correspond to subject specific gray matter volume value and the line corresponds to the trend line of best fit from BIC analysis.
Fig. 5
Fig. 5
Analysis of cortical thickness asymmetry. Points correspond to asymmetry index calculated for each subject. * corresponds to regions with significant left lateralized asymmetry and + corresponds to regions with significant right lateralized asymmetry.
Fig. 6
Fig. 6
Analysis of cortical surface area asymmetry. Points correspond to asymmetry index calculated for each subject. * corresponds to regions with significant left lateralized asymmetry and + corresponds to regions with significant right lateralized asymmetry.
Fig. 7
Fig. 7
Analysis of cortical mean curvature asymmetry. Points correspond to asymmetry index calculated for each subject. * corresponds to regions with significant left lateralized asymmetry and + corresponds to regions with significant right lateralized asymmetry.
Fig. 8
Fig. 8
Analysis of cortical gray matter volume asymmetry. Points correspond to asymmetry index calculated for each subject. * corresponds to regions with significant left lateralized asymmetry and + corresponds to regions with significant right lateralized asymmetry.
Fig. 9
Fig. 9
Sliding window analysis of cortical thickness asymmetry. The asymmetry index was calculated for a sliding and overlapping window of 50 children plotted with respect to mean age for the window. A single sample t-test was used to determine if window asymmetry index differed significantly from zero. Significant areas were defined by p<0.05 corrected for 34 brain regions each with 50 subjects per window and denoted with dark shading.
Fig. 10
Fig. 10
Sliding window analysis of cortical surface area asymmetry. The asymmetry index was calculated for a sliding and overlapping window of 50 children plotted with respect to mean age for the window. A single sample t-test was used to determine if window asymmetry index differed significantly from zero. Significant areas were defined by p<0.05 corrected for 34 brain regions each with 50 subjects per window and denoted with dark shading.
Fig. 11
Fig. 11
Sliding window analysis of cortical mean curvature asymmetry. The asymmetry index was calculated for a sliding and overlapping window of 50 children plotted with respect to mean age for the window. A single sample t-test was used to determine if window asymmetry index differed significantly from zero. Significant areas were defined by p<0.05 corrected for 34 brain regions each with 50 subjects per window and denoted with dark shading.
Fig. 12
Fig. 12
Sliding window analysis of cortical gray matter volume asymmetry. The asymmetry index was calculated for a sliding and overlapping window of 50 children plotted with respect to mean age for the window. A single sample t-test was used to determine if window asymmetry index differed significantly from zero. Significant areas were defined by p<0.05 corrected for 34 brain regions each with 50 subjects per window and denoted with dark shading.
Fig. 13
Fig. 13
Differential cortical development based on sex. First row represents growth trajectories of cortical thickness; the second row represents growth trajectories of cortical surface area; the third row represents growth trajectories of cortical curvature; and the fourth represents growth trajectories of cortical gray matter volume. The blue line represents males and the green line represents the females.

Similar articles

Cited by

References

    1. Backhausen L.L., Herting M.M., Buse J., Roessner V., Smolka M.N., Vetter N.C. Quality control of structural mri images applied using freesurfer—a hands-on workflow to rate motion artifacts. Front. Neurosci. 2016;10:558. - PMC - PubMed
    1. Balthazart J., Ball G. Is brain estradiol a hormone or a neurotransmitter? Trends Neurosci. 2006;29:241–249. - PubMed
    1. Blakemore S.J., Choudhury S. Development of the adolescent brain: implications for executive function and social cognition. J. Child Psychol. Psychiatry. 2006;47:296–312. - PubMed
    1. Boyke J., Driemeyer J., Gaser C., Büchel C., May A. Training-induced brain structure changes in the elderly. J. Neurosci. 2008;28:7031–7035. - PMC - PubMed
    1. Bramen Jennifer E. Sex matters during adolescence: testosterone-related cortical thickness maturation differs between boys and girls. PLoS One. 2012;7.3:e33850. - PMC - PubMed

Publication types

LinkOut - more resources