

Contrast-enhanced computed tomography plus gadolinium-ethoxybenzyl diethylenetriamine pentaacetic acid-enhanced magnetic resonance imaging for gross classification of hepatocellular carcinoma
- PMID: 28392502
- PMCID: PMC5444699
- DOI: 10.18632/oncotarget.15712
Contrast-enhanced computed tomography plus gadolinium-ethoxybenzyl diethylenetriamine pentaacetic acid-enhanced magnetic resonance imaging for gross classification of hepatocellular carcinoma
Abstract
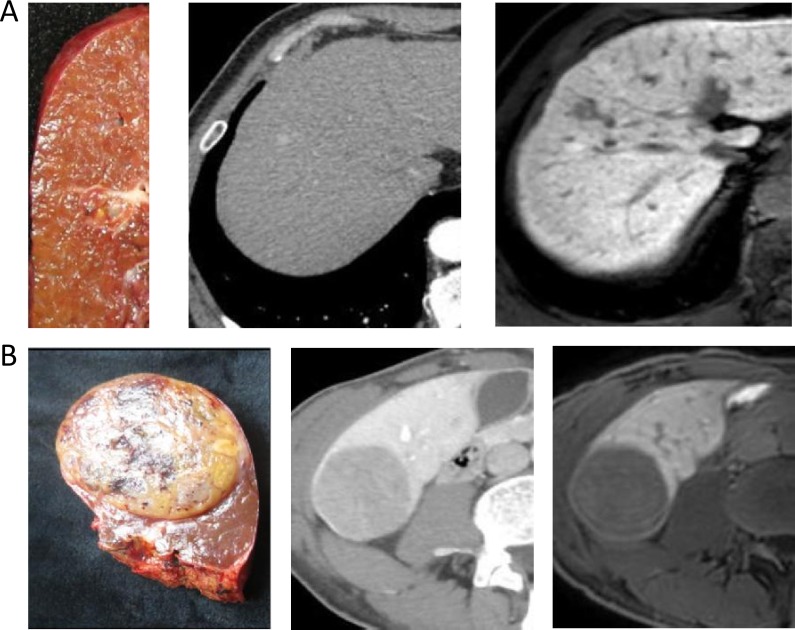
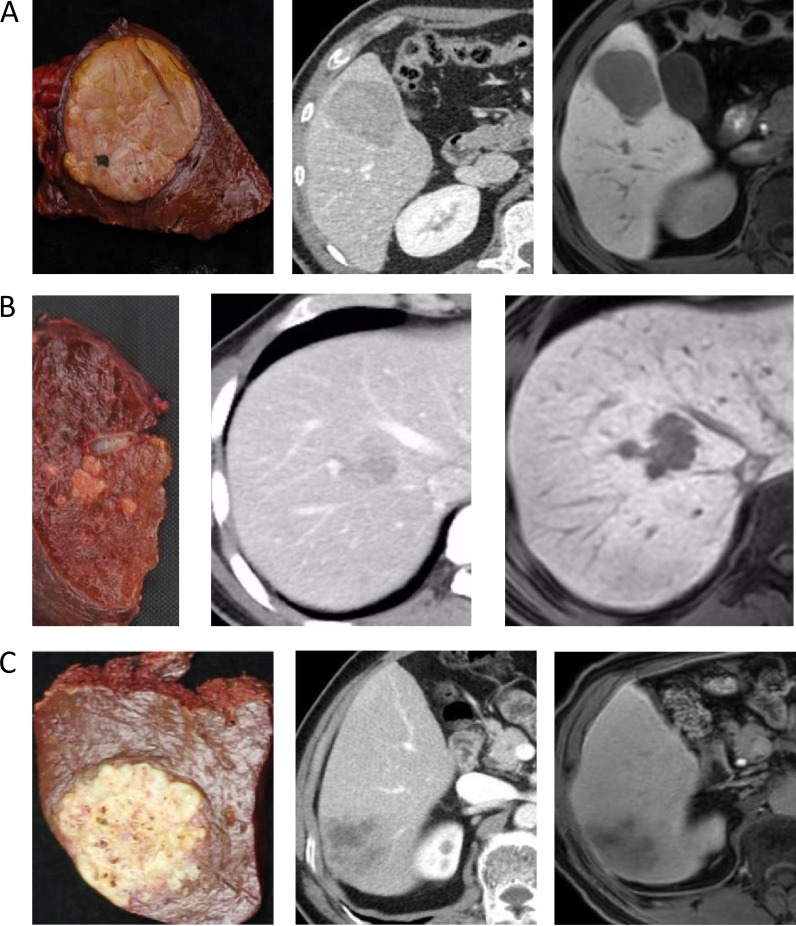
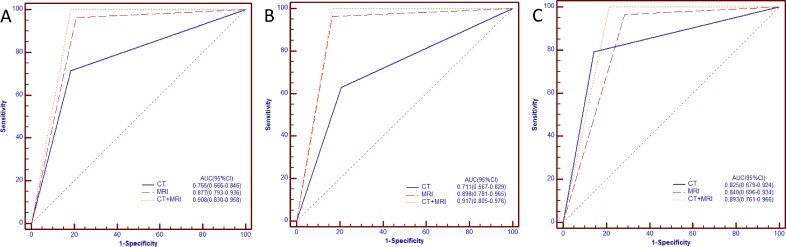
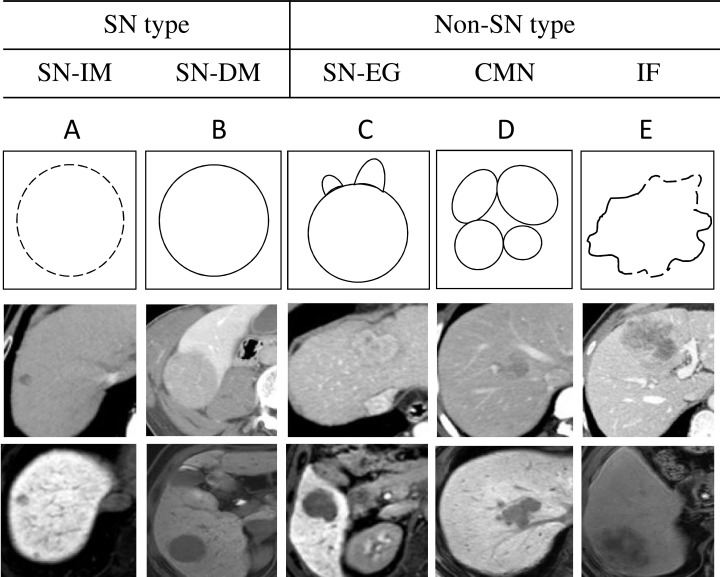
Accurate gross classification through imaging is critical for determination of hepatocellular carcinoma (HCC) patient prognoses and treatment strategies. The present retrospective study evaluated the utility of contrast-enhanced computed tomography (CE-CT) combined with gadolinium-ethoxybenzyl diethylenetriamine pentaacetic acid-enhanced magnetic resonance imaging (EOB-MRI) for diagnosis and classification of HCCs prior to surgery. Ninety-four surgically resected HCC nodules were classified as simple nodular (SN), SN with extranodular growth (SN-EG), confluent multinodular (CMN), or infiltrative (IF) types. SN-EG, CMN and IF samples were grouped as non-SN. The abilities of the two imaging modalities to differentiate non-SN from SN HCCs were assessed using the EOB-MRI hepatobiliary phase and CE-CT arterial, portal, and equilibrium phases. Areas under the ROC curves for non-SN diagnoses were 0.765 (95% confidence interval [CI]: 0.666-0.846) for CE-CT, 0.877 (95% CI: 0.793-0.936) for EOB-MRI, and 0.908 (95% CI: 0.830-0.958) for CE-CT plus EOB-MRI. Sensitivities, specificities, and accuracies with respect to identification of non-SN tumors of all sizes were 71.4%, 81.6%, and 75.5% for CE-CT; 96.4%, 78.9%, and 89.3% for EOB-MRI; and 98.2%, 84.2%, and 92.5% for CE-CT plus EOB-MRI. These results show that CE-CT combined with EOB-MRI offers a more accurate imaging evaluation for HCC gross classification than either modality alone.
Keywords: CE-CT; EOB-MRI; gross classification; hepatocellular carcinoma; imaging.
Conflict of interest statement
The authors have no conflicts of interest to disclose.
Figures
Similar articles
-
Diagnostic accuracy for macroscopic classification of nodular hepatocellular carcinoma: comparison of gadolinium ethoxybenzyl diethylenetriamine pentaacetic acid-enhanced magnetic resonance imaging and angiography-assisted computed tomography.J Gastroenterol. 2015 Jan;50(1):85-94. doi: 10.1007/s00535-014-0947-x. Epub 2014 Feb 22. J Gastroenterol. 2015. PMID: 24563123
-
Comparison of Contrast-Enhanced Ultrasound and Gadolinium-Ethoxybenzyl-Diethylenetriamine Pentaacetic Acid-Enhanced MRI for the Diagnosis of Macroscopic Type of Hepatocellular Carcinoma.Dig Dis. 2016;34(6):679-686. doi: 10.1159/000448855. Epub 2016 Oct 17. Dig Dis. 2016. PMID: 27750237
-
Usefulness of combining gadolinium-ethoxybenzyl-diethylenetriamine pentaacetic acid-enhanced magnetic resonance imaging and contrast-enhanced ultrasound for diagnosing the macroscopic classification of small hepatocellular carcinoma.Eur Radiol. 2015 Nov;25(11):3272-81. doi: 10.1007/s00330-015-3725-0. Epub 2015 Jun 3. Eur Radiol. 2015. PMID: 26037713
-
Focal lesions in the cirrhotic liver: their pivotal role in gadoxetic acid-enhanced MRI and recognition by the Western guidelines.Dig Dis. 2014;32(6):696-704. doi: 10.1159/000368002. Epub 2014 Oct 29. Dig Dis. 2014. PMID: 25376286 Review.
-
Role of gadolinium-ethoxybenzyl-diethylenetriamine pentaacetic acid-enhanced magnetic resonance imaging in the management of hepatocellular carcinoma: consensus at the Symposium of the 48th Annual Meeting of the Liver Cancer Study Group of Japan.Oncology. 2013;84 Suppl 1:21-7. doi: 10.1159/000345885. Epub 2013 Feb 20. Oncology. 2013. PMID: 23428854
Cited by
-
Preoperative predictors of very early recurrence in patients with hepatocellular carcinoma beyond the Milan criteria.Langenbecks Arch Surg. 2024 Sep 18;409(1):283. doi: 10.1007/s00423-024-03474-x. Langenbecks Arch Surg. 2024. PMID: 39292284
References
-
- El-Serag HB. Epidemiology of hepatocellular carcinoma in USA. Hepatol Res. 2007;37:S88–94. - PubMed
-
- LCSGo J. 3. Tokyo: Kanehara & Co, Ltd; 2010. General Rules for the Clinical and Pathological Study of Primary Liver Cancer; pp. 17–18.
-
- Shimada M, Rikimaru T, Hamatsu T, Yamashita Y, Terashi T, Taguchi K, Tanaka S, Shirabe K, Sugimachi K. The role of macroscopic classification in nodular-type hepatocellular carcinoma. Am J Surg. 2001;182:177–182. - PubMed
-
- Hui AM, Takayama T, Sano K, Kubota K, Akahane M, Ohtomo K, Makuuchi M. Predictive value of gross classification of hepatocellular carcinoma on recurrence and survival after hepatectomy. J Hepatol. 2000;33:975–979. - PubMed
-
- Inayoshi J, Ichida T, Sugitani S, Tsuboi Y, Genda T, Honma N, Asakura H. Gross appearance of hepatocellular carcinoma reflects E-cadherin expression and risk of early recurrence after surgical treatment. J Gastroenterol Hepatol. 2003;18:673–677. - PubMed
MeSH terms
Substances
LinkOut - more resources
Full Text Sources
Other Literature Sources
Medical
Miscellaneous
