. 2017 Apr 25;8(17):28840-28853.
doi: 10.18632/oncotarget.16263.

Mechanisms of the anti-tumor activity of Methyl 2-(-5-fluoro-2-hydroxyphenyl)-1 H-benzo[d]imidazole-5-carboxylate against breast cancer in vitro and in vivo

Affiliations

Mechanisms of the anti-tumor activity of Methyl 2-(-5-fluoro-2-hydroxyphenyl)-1 H-benzo[d]imidazole-5-carboxylate against breast cancer in vitro and in vivo

Mohadeseh Hasanpourghadi et al. Oncotarget. .

Abstract

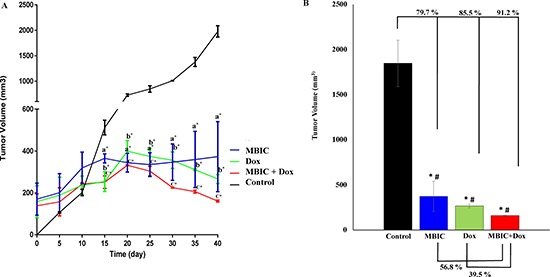
Microtubule Targeting Agents (MTAs) induce cell death through mitotic arrest, preferentially affecting rapidly dividing cancer cells over slowly proliferating normal cells. Previously, we showed that Methyl 2-(-5-fluoro-2-hydroxyphenyl)-1H-benzo[d]imidazole-5-carboxylate (MBIC) acts as a potential MTA. In this study, we demonstrated that MBIC exhibits greater toxicity towards non-aggressive breast cancer cell-line, MCF-7 (IC50 = 0.73 ± 0.0 μM) compared to normal fibroblast cell-line, L-cells (IC50 = 59.6 ± 2.5 μM). The IC50 of MBIC against the aggressive breast cancer cell-line, MDA-MB-231 was 20.4 ± 0.2 μM. We hypothesized that the relatively high resistance of MDA-MB-231 cells to MBIC is associated with p53 mutation. We investigated p53 and three of its downstream proteins: survivin, cyclin dependent kinase (Cdk1) and cyclin B1. Following treatment with MBIC, survivin co-immunoprecipitated with caspases with higher affinity in MDA-MB-231 compared to MCF-7 cells. Furthermore, silencing survivin caused a 4.5-fold increase in sensitivity of MDA-MB-231 cells to MBIC (IC50 = 4.4 ± 0.3). In addition, 4 weeks of MBIC administration in MDA-MB-231 cells inoculated BALB/c nude mice resulted in 79.7% reduction of tumor volume compared to the untreated group with no severe sign of toxicity. Our results demonstrated MBIC has multiple anti-tumor actions and could be a potential drug in breast cancer therapy.

Keywords: breast cancer; drug resistance; microtubule targeting agent; mitotic arrest; mitotic slippage.


Conflict of interest statement

CONFLICTS OF INTEREST

The authors of this study have indicated no conflicts of interest.

Figures

Figure 1
Figure 1. MBIC inhibits MDA-MB-231 and MCF-7 cell proliferation
Cells were treated with various concentrations of MBIC or DMSO for 24 and 48 h before determination of (A). Cell viability dose-dependently using MTT assay, and (B) Cell proliferation time-dependently using RTCA system for 90 h after MBIC application. All results were expressed as total percentage of viable cells of three independent experiments (P < 0.05) with mean ± SD.
Figure 2
Figure 2. MBIC induces caspase-dependent apoptosis
(A) Two-dimensional forward and side scatter plots of FITC-conjugated Annexin V vs PI were generated using FACS technology when cells were treated with various concentrations (0.7, 1.5 and 3 μM against MCF-7; 20, 40 and 80 μM against MDA-MB-231) of MBIC for 24 h. Representative figure shows viable cells accumulation (Q3) vs early apoptotic (Q4), late apoptotic (Q2) and necrotic cells (Q1). (B) MCF-7 and MDA-MB-231 cells were treated with various concentrations of MBIC (0.7, 1.5 and 3 μM against MCF-7; 20, 40 and 80 μM against MDA-MB-231 cells) before measuring protein level of Bax and cleaved caspases-3/7/9 (Cl-C-3/7/9) with Western blot analysis. β-actin was used as loading control. (C) The relative intensity of each protein was normalized with β-actin. Data were results of three independent experiments with mean ± SD. All the treatment groups were compared with control.”*” indicates statistically significant at P < 0.05.
Figure 3
Figure 3. MBIC induces mitochondrial-caspase-dependent apoptosis
Effect of MBIC on mitochondrial-caspase-dependent apoptosis in MCF-7 and MDA-MB-231 cells was quantified a using confocal microscope. Cells were treated with various concentrations of MBIC: 0.7 μM (low dose; LD) and 1.5 μM (high dose; HD) against MCF-7, and 20 μM (low dose; LD) and 40 μM (high dose; HD) against MDA-MB-231 for 24 h. Representative figure shows morphological changes by nucleus dye, cell permeability dye, MMP dye and release of cytochrome c by DyLight 649-conjugated secondary antibody probing anti-cytochrome c primary antibody.
Figure 4
Figure 4. MBIC induces G2-M cell cycle arrest in MCF-7 and mitotic slippage in MDA-MB-231 cell-lines
(A) Flow cytometry analysis of cells treated with various concentrations of MBIC (0.7, 1.5 and 3 μM against MCF-7; 20, 40 and 80 μM against MDA-MB-231) for 48 h was carried out. Representative figure shows distribution of MBIC-treated MDA-MB-231 and MCF-7 cell-lines in different cell cycle phases. Data were results of three independent experiments (P < 0.05) with mean ± SD. (B) MBIC interrupts cytoskeletal rearrangement: HCS reader with 20 × objective was used. Representative figure shows cytoskeletal β-tubulin rearrangement in MBIC-treated MDA-MB-231 and MCF-7 cells. Cells were fixed, washed, probed with anti-β-tubulin antibody and stained with DyLight 554-conjugated secondary antibody (red) and Hoechst 33342 (blue) to detect β-tubulin and nucleus respectively after treatment with 0.7 μM (against MCF-7) and 20 μM (against MDA-MB-231) of MBIC for 48 h. (C) MBIC alters mitotic protein levels: Western blot analysis was done to assess changes of mitotic protein levels. MCF-7 and MDA-MB-231 cell-lines were treated with MBIC dose-dependently (0.7, 1.5 and 3 μM against MCF-7; 20, 40 and 80 μM against MDA-MB-231 cells). (D) The relative intensity of each proteins was normalized with β-actin. Data were results of three independent experiments with mean ± SD. All the treatment groups were compared with control.”*” indicates statistically significant at P < 0.05.
Figure 5
Figure 5
(A) Illustration of p53 status and its downstream effect in MCF-7 and MDA-MB-231 cells post MBIC treatment: Functional wild-type p53 in MCF-7 cells suppresses survivin and Cdk1 protein levels after MBIC application. Low protein level of Cdk1 causes lack of phosphorylated survivin. Low protein level of survivin and p-survivin causes release and activation of caspases in cytoplasm which leads to apoptosis (at IC50 dosage of MBIC and higher). In contrast, dysfunctional mutated p53 in MDA-MB-231 cells, is not capable of inhibiting survivin and Cdk1 proteins after MBIC application. Therefore, there are plenty of survivin in the cell to be phosphorylated and there are enough Cdk1 to phosphorylate the survivin in Thr34 region. Thus, phosphorylated survivin binds to caspases and inhibits their activation (at dosage above 40 μM). (B) MBIC alters affinity of survivin for caspases in MCF-7 and MDA-MB-231 cell-lines with different variations: MDA-MB-231 and MCF-7 cells were treated with MBIC dose-dependently. Complex formation of p-survivin with caspases-3/7/9 was detected while performing Co-IP assay followed by Western blot analysis. (C) Bar graph represents dual quantification of p-survivin and caspases-3/7/9 protein intensities in complex formation which are normalized with β-actin. Data were results of three independent experiments with mean ± SD. All the treatment groups were compared with control.”*” indicates statistically significant at P < 0.05.
Figure 6
Figure 6. Survivin gene silencing increases the sensitivity of MDA-MB-231 to MBIC
(A) Cells were transfected with different concentrations of p53 and survivin siRNA, mock-transfection control (Mock-TF) or not transfected control (Non-TF). Western blot analysis was carried out to identify the effective concentration of each siRNA. P53 siRNA at concentration of 26.6 nM succeeded to silence p53 in MCF-7 cells. Survivin siRNA at concentration of 100 nM succeeded to silence survivin in MDA-MB-231 and MCF-7 cells. β-actin served as a loading control. (B) IC50 of both cell-lines after silencing p53 and survivin. (C) Western blot analysis was carried out to evaluate caspases-3/7/9 activation after survivin siRNA transfection in MDA-MB-231 cells. Cells were divided into six groups: (1) Non-TF and untreated, (2) Non-TF and 80 μM (4-fold > IC50) of MBIC treated, (3) Mock-TF and 10 μM (2-fold < IC50) of MBIC treated, (4) Survivin siRNA transfected and 10 μM of MBIC treated, (5) Mock-TF and 20 μM (= IC50) of MBIC treated and (6) Survivin siRNA transfected and 20 μM of MBIC treated. β-actin served as a loading control. (D) Cell cycle analysis was performed to investigate the absence or presence of mitotic slippage in MDA-MB-231 cell-line, in four different survivin siRNA transfected groups (with/without MBIC treatment), one Non-TF-untreated group and one Mock-TF-untreated group. Data were results of three independent experiments with mean ± SD.
Figure 7
Figure 7. MBIC reduced the tumor growth in xenograft mice
(A) Body weight before treatment and during 30 days of treatment. (B) Represents photograph of tumor sizes after removing from nude mice. We can observe clear reduced size of tumor after treatment with MBIC, doxorubicin and combination treatment (MBIC with doxorubicin) compared to the DMSO-treated group. (C) Represents the tumor weights in 4 groups after removal of the tumor from animals. Figure shows 69.1%, 82.9% and 89.1% reduction of tumor weight in MBIC, doxorubicin and combination treatment groups, compared to untreated group respectively. “*” denotes statistical difference (P < 0.05).
Figure 8
Figure 8. MBIC reduced the tumor volume in xenograft mice
(A) Reduction of tumor volume in MBIC, doxorubicin and combination treatment groups during 40 days of in vivo study. Comparisons: aTumor Control vs MBIC, bTumor Control vs doxorubicin, cTumor Control vs MBIC+doxorubicin. (B) 79.7%, 85.5% and 91.2% tumor volume reduction in MBIC, doxorubicin and combination treatment groups, compared to the untreated group. “*” denotes statistical difference (P < 0.05) between untreated group vs other groups. Combination of MBIC and doxorubicin shows 39.5% reduction of tumor volume compared to doxorubicin treatment alone, and 56.8% reduction of tumor volume compared to the MBIC treatment group alone. This indicates synergism of MBIC and doxorubicin in combination. “#” denotes statistical differences (P < 0.05) between combination group vs MBIC and combination group vs doxorubicin-treated groups.

Similar articles

Cited by

References

    1. Hanahan D, Weinberg RA. Hallmarks of cancer: the next generation. Cell. 2011;144:646–674. - PubMed
    1. Coley HM. Mechanisms and strategies to overcome chemotherapy resistance in metastatic breast cancer. Cancer Treat Rev. 2008;34:378–390. - PubMed
    1. Van-Zijl F, Krupitza G, Mikulits W. Initial steps of metastasis: cell invasion and endothelial transmigration. Mutat Res. 2011;728:23–34. - PMC - PubMed
    1. Michailidou K, Hall P, Gonzalez-Neira A, Ghoussaini M, Dennis J, Milne RL, Schmidt MK, Chang-Claude J, Bojesen SE, Bolla MK. Large-scale genotyping identifies 41 new loci associated with breast cancer risk. Nat Genet. 2013;45:353–361. - PMC - PubMed
    1. Ferlay J, Héry C, Autier P, Sankaranarayanan R. Global burden of breast cancer. In Breast Cancer Epidemiology, Springer. 2010. pp. 1–19.

MeSH terms