Effect of vegetated filter strips on transport and deposition rates of Escherichia coli in overland flow in the eastern escarpments of the Mau Forest, Njoro River Watershed, Kenya
- PMID: 28393102
- PMCID: PMC5381934
- DOI: 10.1007/s40974-016-0006-y
Effect of vegetated filter strips on transport and deposition rates of Escherichia coli in overland flow in the eastern escarpments of the Mau Forest, Njoro River Watershed, Kenya
Abstract
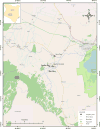
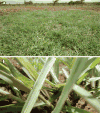
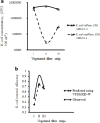
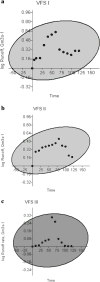
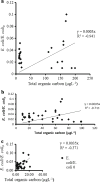
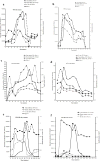
The fate and transport of Escherichia coli (E. coli) in lotic waters through vegetated filter strips (VFSs) was evaluated in a field model pasture, utilizing VFSMOD Windows along with direct pathogen testing. This study assessed effects of VFS on transport and deposition rates of E. coli in lotic overland flow waters. The VFS measured 44 m long by 40 m wide, covering an area of 1584 m2 and land slope of 15 %. Cowpat was applied onto the model pasture and washed by overland flow into the VFS. The 4-methylumbelliferyl β-D-glucuronide substrate confirmed the identity of E. coli prior to cowpat application and after isolating them from soil using centrifugation and membrane filtration techniques. Napier grass root system recorded the highest recovery rates of E. coli at 99.9 % along the length of VFS III. This efficiency reduced significantly (p < 0.05; df = 29) to 95 % in Kikuyu grass and 75 % in Couch grass-Buffer grass. The data demonstrated similarity in transport of manure-borne E. coli and organic carbon (OC) through all the simulated VFS. These results indicated that OC could be used as a true natural tracer of manure-borne E. coli, a pollution indicator organism of lentic and lotic surface waters provided the OC release kinetics from cowpat were similar to that of E. coli kinetics. Thus, efficient filtering to reduce E. coli concentrations and load in overland flows requires managing combined grass species, agro-pastoral systems models and dispersed or preferential flows to enhance surface water quality standards.
Keywords: Escherichia coli; Fate and transport; Lotic surface water; Mass balance; Micro-biome; Overland flow rate; VFS.
Figures




Similar articles
-
Composition and design of vegetative filter strips instrumental in improving water quality by mass reduction of suspended sediment, nutrients and Escherichia coli in overland flows in eastern escarpment of Mau Forest, Njoro River Watershed, Kenya.Energy Ecol Environ. 2016 Dec;1(6):396-407. doi: 10.1007/s40974-016-0032-9. Epub 2016 Jun 13. Energy Ecol Environ. 2016. PMID: 28133624 Free PMC article.
-
The current state of knowledge on the interaction of Escherichia coli within vegetative filter strips as a sustainable best management practice to reduce fecal pathogen loading into surface waters.Energy Ecol Environ. 2016 Aug;1(4):248-266. doi: 10.1007/s40974-016-0026-7. Epub 2016 Jun 7. Energy Ecol Environ. 2016. PMID: 28042601 Free PMC article.
-
Effectiveness of vegetated filter strips in retention of Escherichia coli and Salmonella from swine manure slurry.J Environ Manage. 2012 Nov 15;110:1-7. doi: 10.1016/j.jenvman.2012.05.012. Epub 2012 Jun 15. J Environ Manage. 2012. PMID: 22705854
-
[Research and application advances on vegetative filter strip].Ying Yong Sheng Tai Xue Bao. 2008 Sep;19(9):2074-80. Ying Yong Sheng Tai Xue Bao. 2008. PMID: 19102326 Review. Chinese.
-
A review of rapid transport of pesticides from sloping farmland to surface waters: processes and mitigation strategies.J Environ Sci (China). 2012;24(3):351-61. doi: 10.1016/s1001-0742(11)60753-5. J Environ Sci (China). 2012. PMID: 22655346 Review.
Cited by
-
Composition and design of vegetative filter strips instrumental in improving water quality by mass reduction of suspended sediment, nutrients and Escherichia coli in overland flows in eastern escarpment of Mau Forest, Njoro River Watershed, Kenya.Energy Ecol Environ. 2016 Dec;1(6):396-407. doi: 10.1007/s40974-016-0032-9. Epub 2016 Jun 13. Energy Ecol Environ. 2016. PMID: 28133624 Free PMC article.
-
The current state of knowledge on the interaction of Escherichia coli within vegetative filter strips as a sustainable best management practice to reduce fecal pathogen loading into surface waters.Energy Ecol Environ. 2016 Aug;1(4):248-266. doi: 10.1007/s40974-016-0026-7. Epub 2016 Jun 7. Energy Ecol Environ. 2016. PMID: 28042601 Free PMC article.
-
Preharvest Farming Practices Impacting Fresh Produce Safety.Microbiol Spectr. 2018 Apr;6(2):10.1128/microbiolspec.pfs-0022-2018. doi: 10.1128/microbiolspec.PFS-0022-2018. Microbiol Spectr. 2018. PMID: 29676249 Free PMC article. Review.
References
-
- Abu-Zreig M, Rudra RP, Whiteley HR, Lalonde MN, Kaushik NK. Phosphorus removal in vegetated filter strips. J Environ Qual. 2003;32(2):613–619. - PubMed
-
- Akan A. Preliminary design aid for bio retention filters. J Hydrol Eng. 2013 doi: 10.1061/(ASCE)HE.1943-5584.0000554. - DOI
-
- American Public HealthAssociation, APHA. Standard methods for the examination of water and wastewater. 18th. Am Public health Assoc; New York: 1992.
Grants and funding
LinkOut - more resources
Full Text Sources
Other Literature Sources
Miscellaneous
